Survivability Rankings for Convenience Store in Boston
StreetSpring's 2026 analysis ranks the best and worst neighborhoods in Boston to open a Convenience Store, from Ten Hills (80% survival) to Wellesley (6...
By Bobby Koons | Reviewed: May 13, 2026 | Refreshed weekly | Methodology
Quick Summary
- #1 Neighborhood: Ten Hills — 80% average survivability for Convenience Store
- Neighborhoods at or above 70%: 62 of 88 analyzed
- City-wide average: 72% for Convenience Stores
- Most challenging area: Wellesley at 60%
- Revenue advantage (top vs. avg location): ~10.9% more expected revenue in Ten Hills
- Data freshness: 2026 data · Full methodology →
Table of Contents
- Summary
- 10 Best Neighborhoods
- Where Would a Convenience Store Make the Most Money?
- What Should I Consider?
- Where Should I Start?
- FAQ: Best Neighborhoods
- FAQ: Can a Convenience Store Succeed in Lower-Ranked Areas?
- FAQ: How Often Are Rankings Updated?
- FAQ: Is a Convenience Store a Good Tenant?
- Landlord Survivability Data
- Best Neighborhoods for Any Business
Summary
Ten Hills leads Boston's 2026 survivability rankings for Convenience Store operators with 80% average chance of surviving more than 2 years, with the best locations offering 87% and the most challenging locations in Ten Hills at 70%. The worst neighborhoods include Wellesley with 60% average chance. A low-ranking neighborhood can still contain high-potential storefronts — the address matters most.
Which Boston Neighborhoods Are Strongest for Convenience Stores?
Ten Hills ranks #1 of 88 neighborhoods analyzed in and around Boston for Convenience Store survivability with a score of 80% as of 2026. The top 10 neighborhoods are:
Notable runners-up worth a second look
| Rank | Neighborhood | Best Locations | Average Locations | Challenging Locations |
|---|---|---|---|---|
| 1 | Ten Hills | 84.0% – 88.0% | 77.0% – 81.7% | 69.0% – 73.0% |
| 2 | Riverside | 83.0% – 87.0% | 76.2% – 80.9% | 69.0% – 73.0% |
| 3 | Mid-Cambridge | 84.0% – 88.0% | 75.7% – 80.4% | 70.0% – 74.0% |
| 4 | Fenway | 84.0% – 88.0% | 75.4% – 80.1% | 68.0% – 72.0% |
| 5 | Union Square | 81.0% – 85.0% | 75.0% – 79.7% | 73.0% – 77.0% |
| 6 | Cambridgeport | 84.0% – 88.0% | 74.8% – 79.5% | 68.0% – 72.0% |
| 7 | Kenmore | 83.0% – 87.0% | 74.7% – 79.4% | 65.0% – 69.0% |
| 8 | Cambridge | 80.0% – 84.0% | 74.3% – 79.0% | 72.0% – 76.0% |
| 9 | Allston | 83.0% – 87.0% | 74.2% – 78.9% | 66.0% – 70.0% |
| 10 | Aggasiz - Harvard North | 82.0% – 86.0% | 74.0% – 78.7% | 70.0% – 74.0% |
How to use this list when you tour locations
Neighborhood averages mask significant block-by-block variation — always check your specific address. New competitor openings and closures happen weekly — the live tool ensures you see the latest picture.
Survivability ranges reflect best and worst storefront conditions within each neighborhood. See our full methodology →
Try StreetSpring to see if this location is still the best and see if there are locations to rent in this area right now.
Where Convenience Stores Earn the Most in Boston
In Ten Hills, the best possible location offers the opportunity of making ~10.9% more than the average location in or around Boston.
On the other hand, in Wellesley, the worst possible location could result in making ~16.3% less than the average location in the city.
Your choice of location outweighs almost every other business decision combined. Opening a Convenience Store in Boston requires careful location choice. Across 88 neighborhoods analyzed, the overall average survival chance for a new Convenience Store is 72% for lasting more than 2 years — due to a combination of many factors across competition, consumer spending, and location dynamics. The same location can be excellent for one business type and poor for another.
What Matters Most When Opening a Convenience Store in Boston
Selecting a high-survivability address is the single most cost-effective risk reduction available before signing a lease. Everything downstream depends on it. A high Revenue Capture Score is the clearest signal that a location can sustain a profitable business. StreetSpring computes this by projecting the business's market share, which is based on the quality and quantity of primary, secondary, and tertiary competitors. We apply advanced machine learning to massive commercial real estate datasets to build accurate models. Moderate competition often indicates a healthy market with proven consumer demand. StreetSpring uses its own proprietary forecasting tools to make these predictions.
| Consideration | Common pitfall | What to verify before signing |
|---|---|---|
| Lease term | Locking into 7-10 years without break clauses, then needing to relocate after year 2. | Negotiate a relocation or termination clause. Confirm assignment + sublease rights are in writing. |
| Workforce availability | Hiring radius is smaller than you think — many neighborhoods can't staff a full team at standard wages. | Pull BLS wage data for your industry in this metro. Walk through your staffing plan with a local restaurant/retail operator before signing. |
| Permits & licensing | Assuming a 30-day permit timeline, hitting 90+ days, paying rent on a non-operating storefront. | Call the local zoning office before signing. Confirm your use is already permitted; if not, factor a 2-3 month variance timeline. |
This can be summarized as:
Revenue Capture Score = Projected Market Share × Forecasted Spend on Specific Business
Related: Survivability Score: How We Calculate It & Why It Matters
Scores get refreshed against the latest competitive, demographic, and walkability data on an ongoing basis. The static rankings here may already be slightly behind; for a current address-level score, use StreetSpring's live tool.
Pinpointing the Right Neighborhood for a Convenience Store in Boston
StreetSpring identifies the strongest markets as Ten Hills, Riverside, and Mid-Cambridge, while the most challenging neighborhoods would be Wellesley, Winchester, and Norwood. Location-level factors like visibility and adjacent tenants can override neighborhood-level trends. Static rankings provide a useful baseline, but the live tool captures changes that have occurred since publication.
Related Articles:
- Business Survivability Rankings: Boston
- Neighborhood Survivability Rankings: Boston
- National City Survivability: Convenience Store
Top-Survivability Boston Neighborhoods for Convenience Stores
Based on StreetSpring's 2026 analysis, the top neighborhood for a Convenience Store in Boston is Ten Hills with 80% average survivability, followed by Riverside and Mid-Cambridge. 62 of 88 neighborhoods analyzed exceed 70% two-year survival.
Market dynamics shift frequently; validate these insights with real-time data from StreetSpring.
Should You Consider Lower-Survivability Areas of Boston for a Convenience Store?
Yes — neighborhood averages mask significant block-by-block variation. Even in neighborhoods ranked outside the top 10, individual storefronts with strong foot traffic, low direct competition, and favorable lease terms can outperform the area average. Surface conditions can change in a week — for the most current score, the live StreetSpring tool beats any static page. Always check your specific address in StreetSpring's live platform for the most accurate prediction.
How Fresh Is Our Boston Convenience Store Ranking Data?
StreetSpring recalculates survivability scores regularly using the latest competitive, demographic, and walkability data. Rankings are updated quarterly; the live tool always reflects the most current predictions for any address in Boston.
The Landlord's View of Convenience Stores in Boston
In Ten Hills, StreetSpring forecasts a 77.0% – 81.7% average chance for a new Convenience Store to survive more than 2 years, depending on the exact storefront. Check the current Survivability Score for any address instantly.
Landlord Survivability Data for Convenience Store in Boston
Reducing vacancy starts with choosing tenants whose business type matches the neighborhood's strengths. For Convenience Store tenants, Ten Hills provides the best survivability conditions (77.0% – 81.7%). Riverside and Mid-Cambridge also show viable averages at 76.2% – 80.9% and 75.7% – 80.4% respectively. Our tool shows the survivability outlook for any business type at your exact address, updated weekly.
StreetSpring provides highly detailed forecasts — revealing how long hundreds of business types are likely to last at a specific address.
Related: How Landlord Representatives Can Reduce Vacancy & Increase Tenant Longevity
Where Convenience Stores Thrive in Boston
You can see the best neighborhoods in or around Boston to open any type of business in our article Neighborhood Survivability Rankings: Boston.
Technical note: Aggregated survivability rankings for Boston are available in machine-readable format for research and integration purposes.
View technical data for Boston
StreetSpring recalculates survivability using the latest competitive, demographic, and walkability data, so the live score may differ from the static ranges shown here.
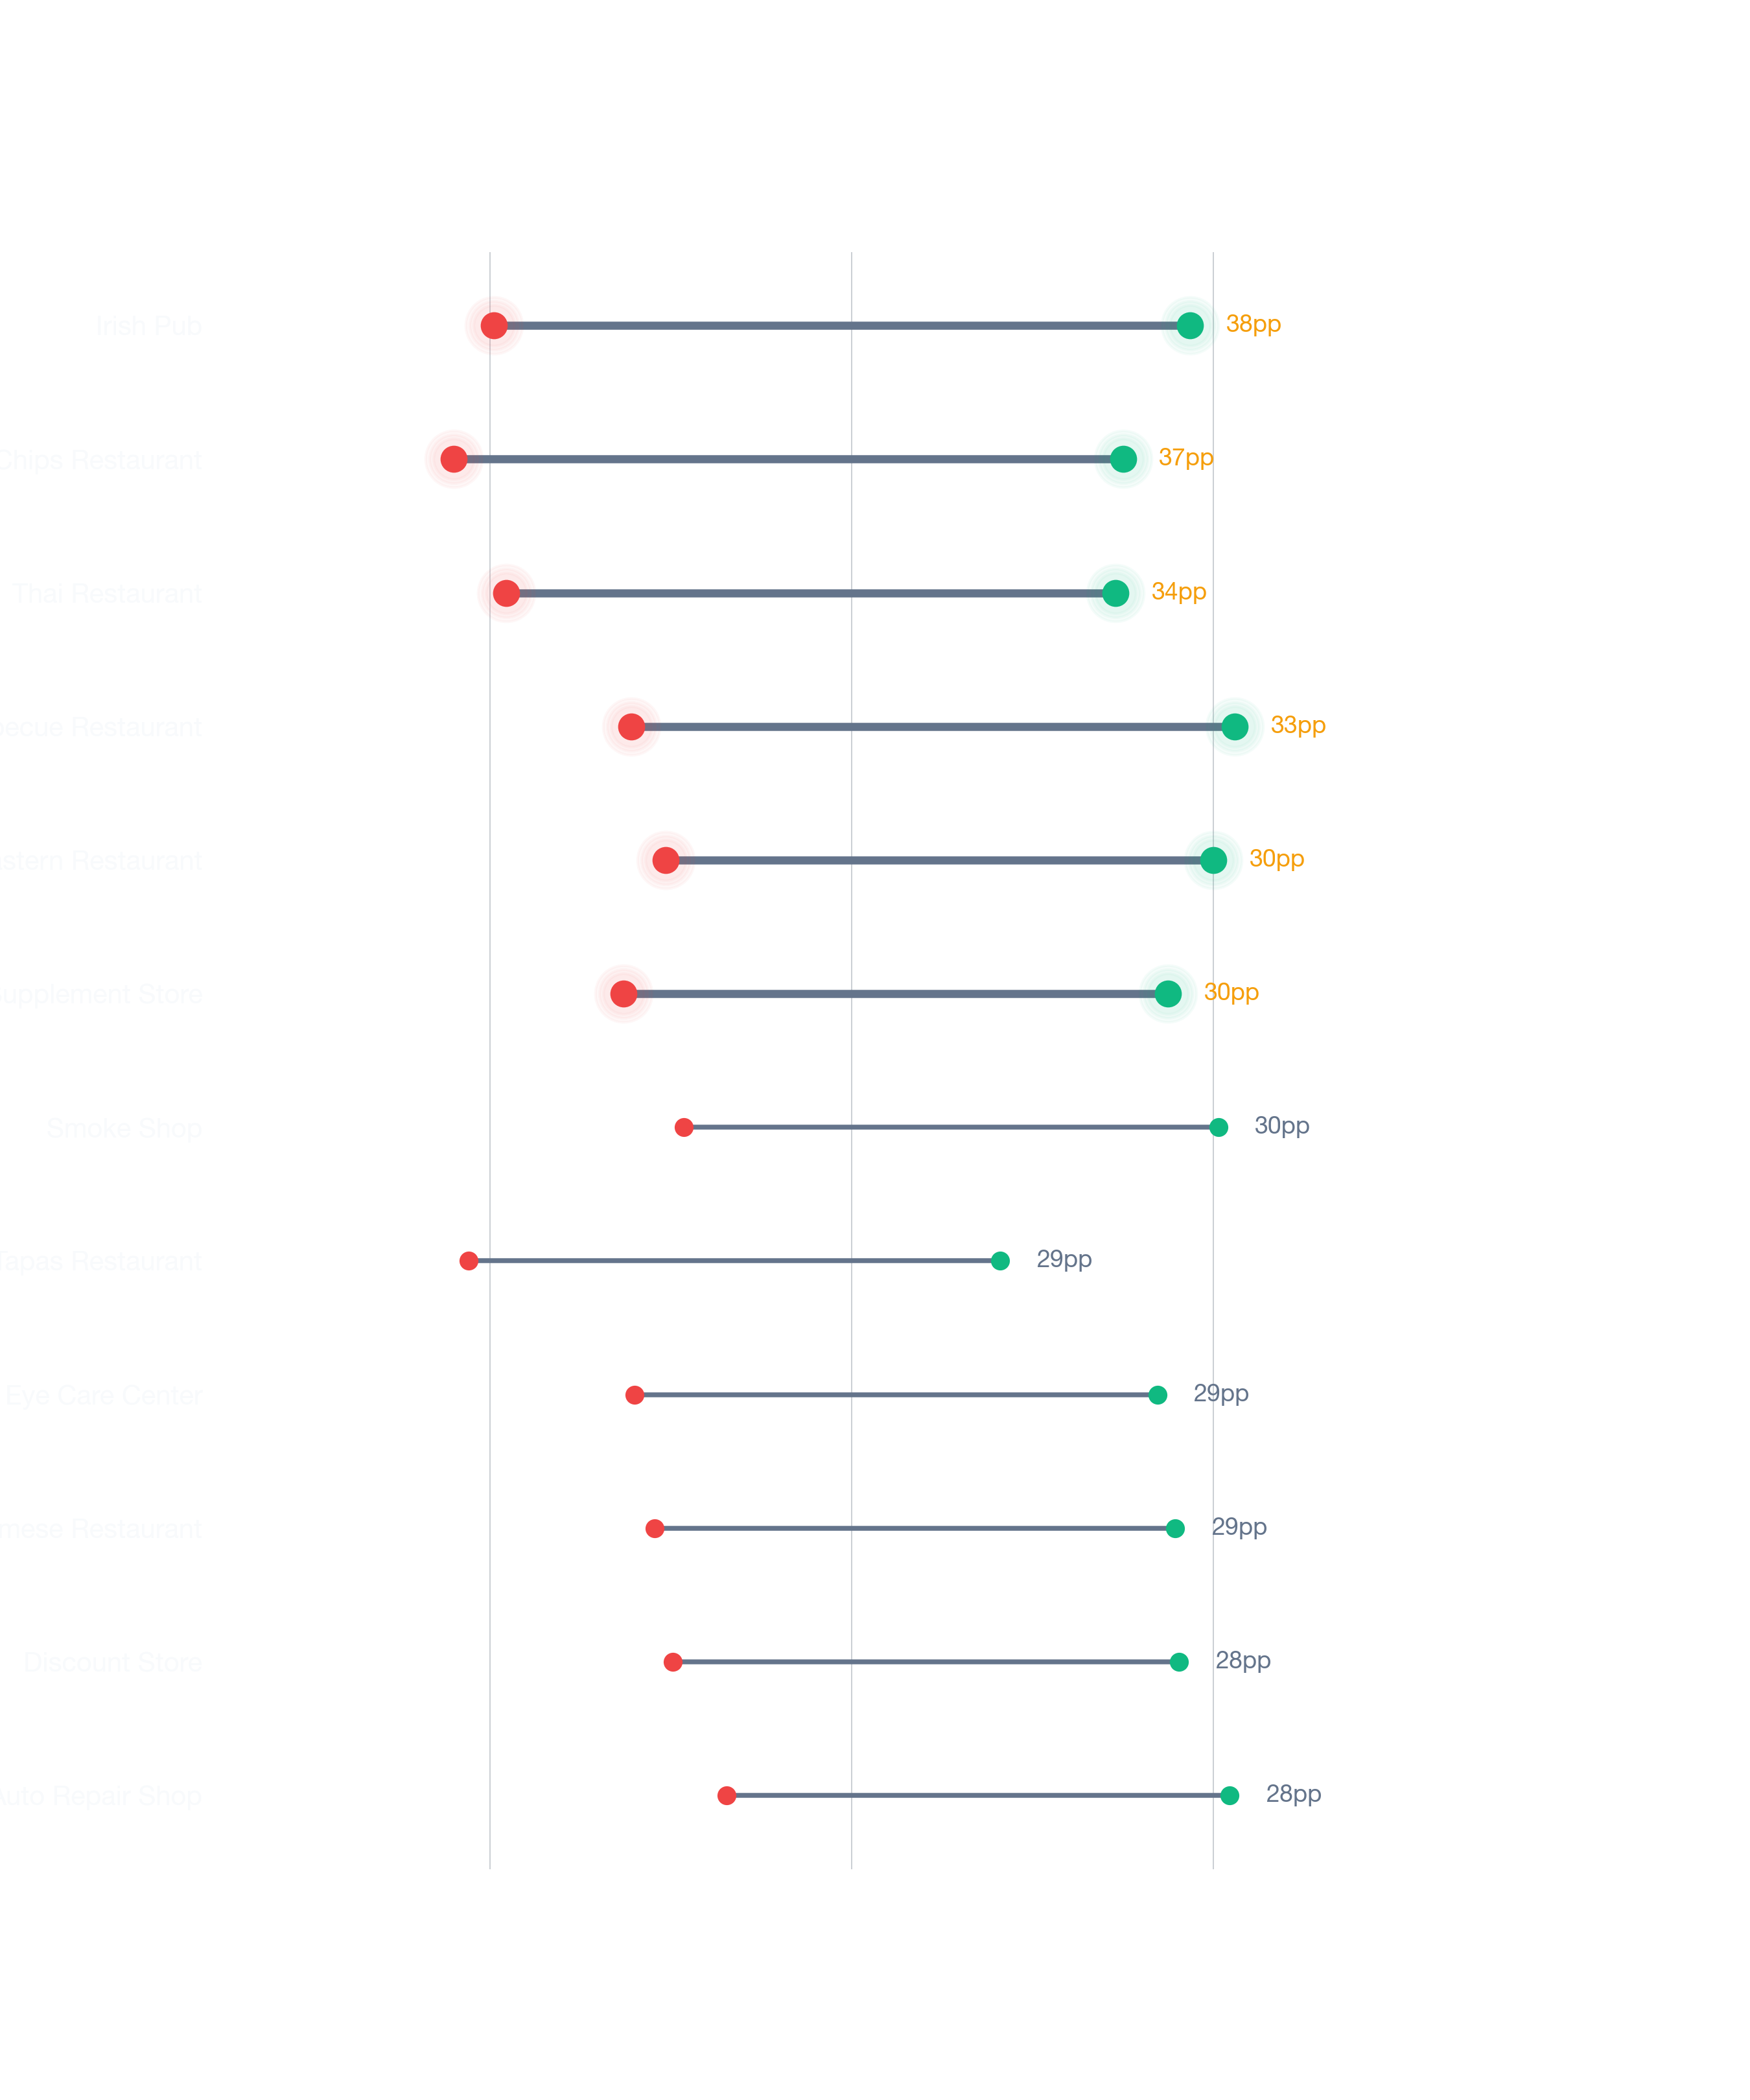
Visual Data

Related Resources
Same business type in other cities:
- City Survivability Rankings for Convenience Store
- Survivability Rankings for Convenience Store in Atlanta
- National Neighborhood Survivability Rankings for Convenience Store
Related:
Local Data Questions
Further questions, with answers anchored on this neighborhood's actual data.
How does Boston Convenience Store survivability compare to the national BLS baseline?
Per BLS Business Employment Dynamics (March 2025 release), Convenience Stores have a 48% 5-year survival rate nationally. StreetSpring's Boston model averages 66% across tracked locations — above the national baseline by 18 percentage points.
What's the single biggest factor in survival for a Convenience Store in Boston?
The address you sign for. Across Boston, Convenience Stores score 36-88% depending on location — a 52-point spread that captures competitive density, demographic fit, accessibility, and visibility at each storefront.
Which US cities have the highest survivability for Convenience Stores?
Across 24 US metros, Dallas, Orlando, San Antonio top the rankings for Convenience Stores. Boston comes in at #14 with an average score of 66%.