Survivability Rankings for African Restaurant in Boston
StreetSpring's 2026 analysis ranks the best and worst neighborhoods in Boston to open an African Restaurant, from Boston (87% survival) to Winchester (7...
By Bobby Koons | Last reviewed by Bobby Koons on May 9, 2026 | Methodology
Quick Summary
- #1 Neighborhood: Boston — 87% average survivability for African Restaurant
- Neighborhoods at or above 70%: 88 of 88 analyzed
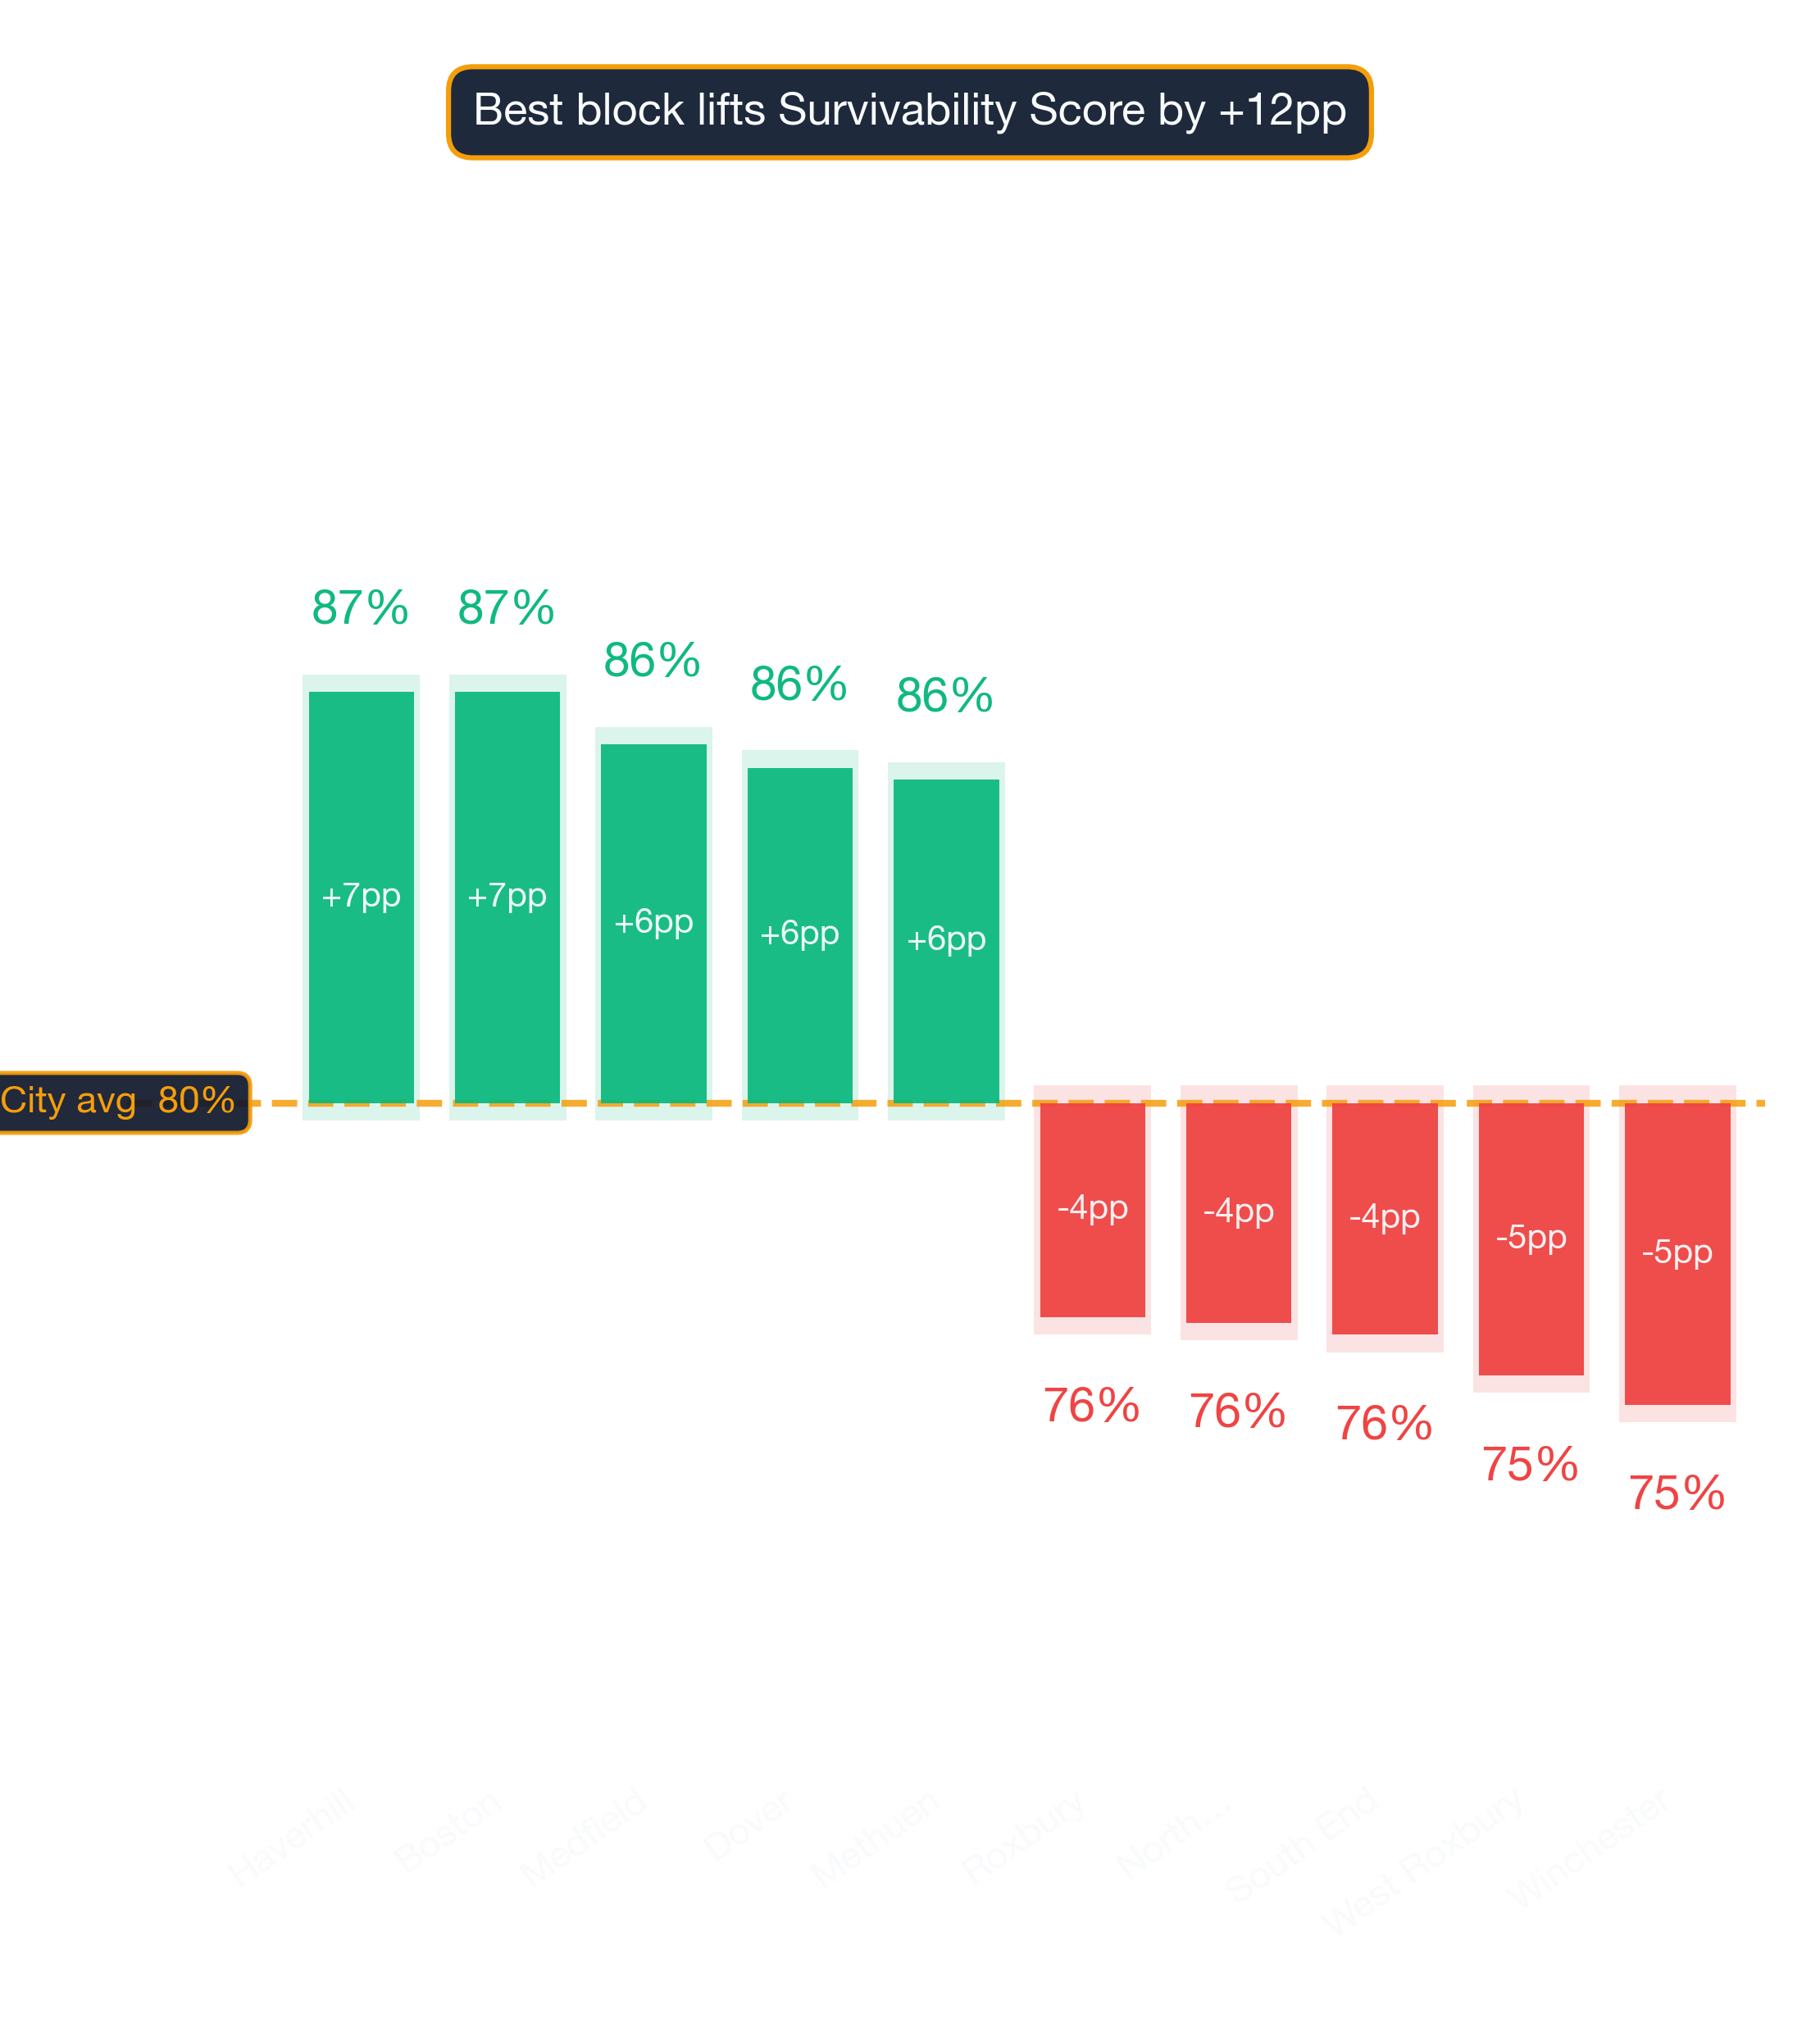
- City-wide average: 80% for African Restaurants
- Most challenging area: Winchester at 75%
- Revenue advantage (top vs. avg location): ~8.8% more expected revenue in Boston
- Data freshness: 2026 data · Full methodology →
Table of Contents
- Summary
- 10 Best Neighborhoods
- Where Would an African Restaurant Make the Most Money?
- What Should I Consider?
- Where Should I Start?
- FAQ: Best Neighborhoods
- FAQ: Can an African Restaurant Succeed in Lower-Ranked Areas?
- FAQ: How Often Are Rankings Updated?
- FAQ: Is an African Restaurant a Good Tenant?
- Landlord Survivability Data
- Best Neighborhoods for Any Business
Summary
Boston leads Boston's 2026 survivability rankings for African Restaurant operators with 87% average chance of surviving more than 2 years, with the best locations offering 93% and the most challenging locations in Boston at 73%. The worst neighborhoods include Winchester with 75% average chance. These rankings are based on the latest available data; check StreetSpring for real-time updates.
Where African Restaurants Thrive in Boston
Boston ranks #1 of 88 neighborhoods analyzed in and around Boston for African Restaurant survivability with a score of 87% as of 2026. The top 10 neighborhoods are:
How rent and competition shape the leaderboard
| Rank | Neighborhood | Best Locations | Average Locations | Challenging Locations |
|---|---|---|---|---|
| 1 | Boston | 90.0% – 94.0% | 85.6% – 88.5% | 72.0% – 76.0% |
| 2 | Haverhill | 94.0% – 97.0% | 85.6% – 88.5% | 63.0% – 67.0% |
| 3 | Medfield | 95.0% – 97.0% | 84.6% – 87.5% | 61.0% – 65.0% |
| 4 | Dover | 94.0% – 97.0% | 84.2% – 87.2% | 64.0% – 68.0% |
| 5 | Methuen | 94.0% – 97.0% | 84.0% – 86.9% | 66.0% – 70.0% |
| 6 | Needham | 95.0% – 97.0% | 83.1% – 86.1% | 64.0% – 68.0% |
| 7 | Lowell | 94.0% – 97.0% | 83.0% – 85.9% | 65.0% – 69.0% |
| 8 | Merrymount | 90.0% – 94.0% | 82.8% – 85.8% | 70.0% – 74.0% |
| 9 | Adams Shore | 92.0% – 96.0% | 81.9% – 84.8% | 68.0% – 72.0% |
| 10 | Lawrence | 92.0% – 96.0% | 81.2% – 84.1% | 66.0% – 70.0% |
The data signals behind these scores
Remember that a neighborhood average smooths over wide variation — your exact block could significantly outperform. StreetSpring's Survivability Scores are updated regularly, so the most accurate prediction for your exact storefront is always available in the live tool.
Survivability ranges reflect best and worst storefront conditions within each neighborhood. See our full methodology →
Try StreetSpring to see if this location is still the best and see if there are locations to rent in this area right now.
Where in or Around Boston Would an African Restaurant Make the Most Money?
In Boston, the best possible location offers the opportunity of making ~8.8% more than the average location in or around Boston.
On the other hand, in Winchester, the worst possible location could result in making ~6.5% less than the average location in the city.
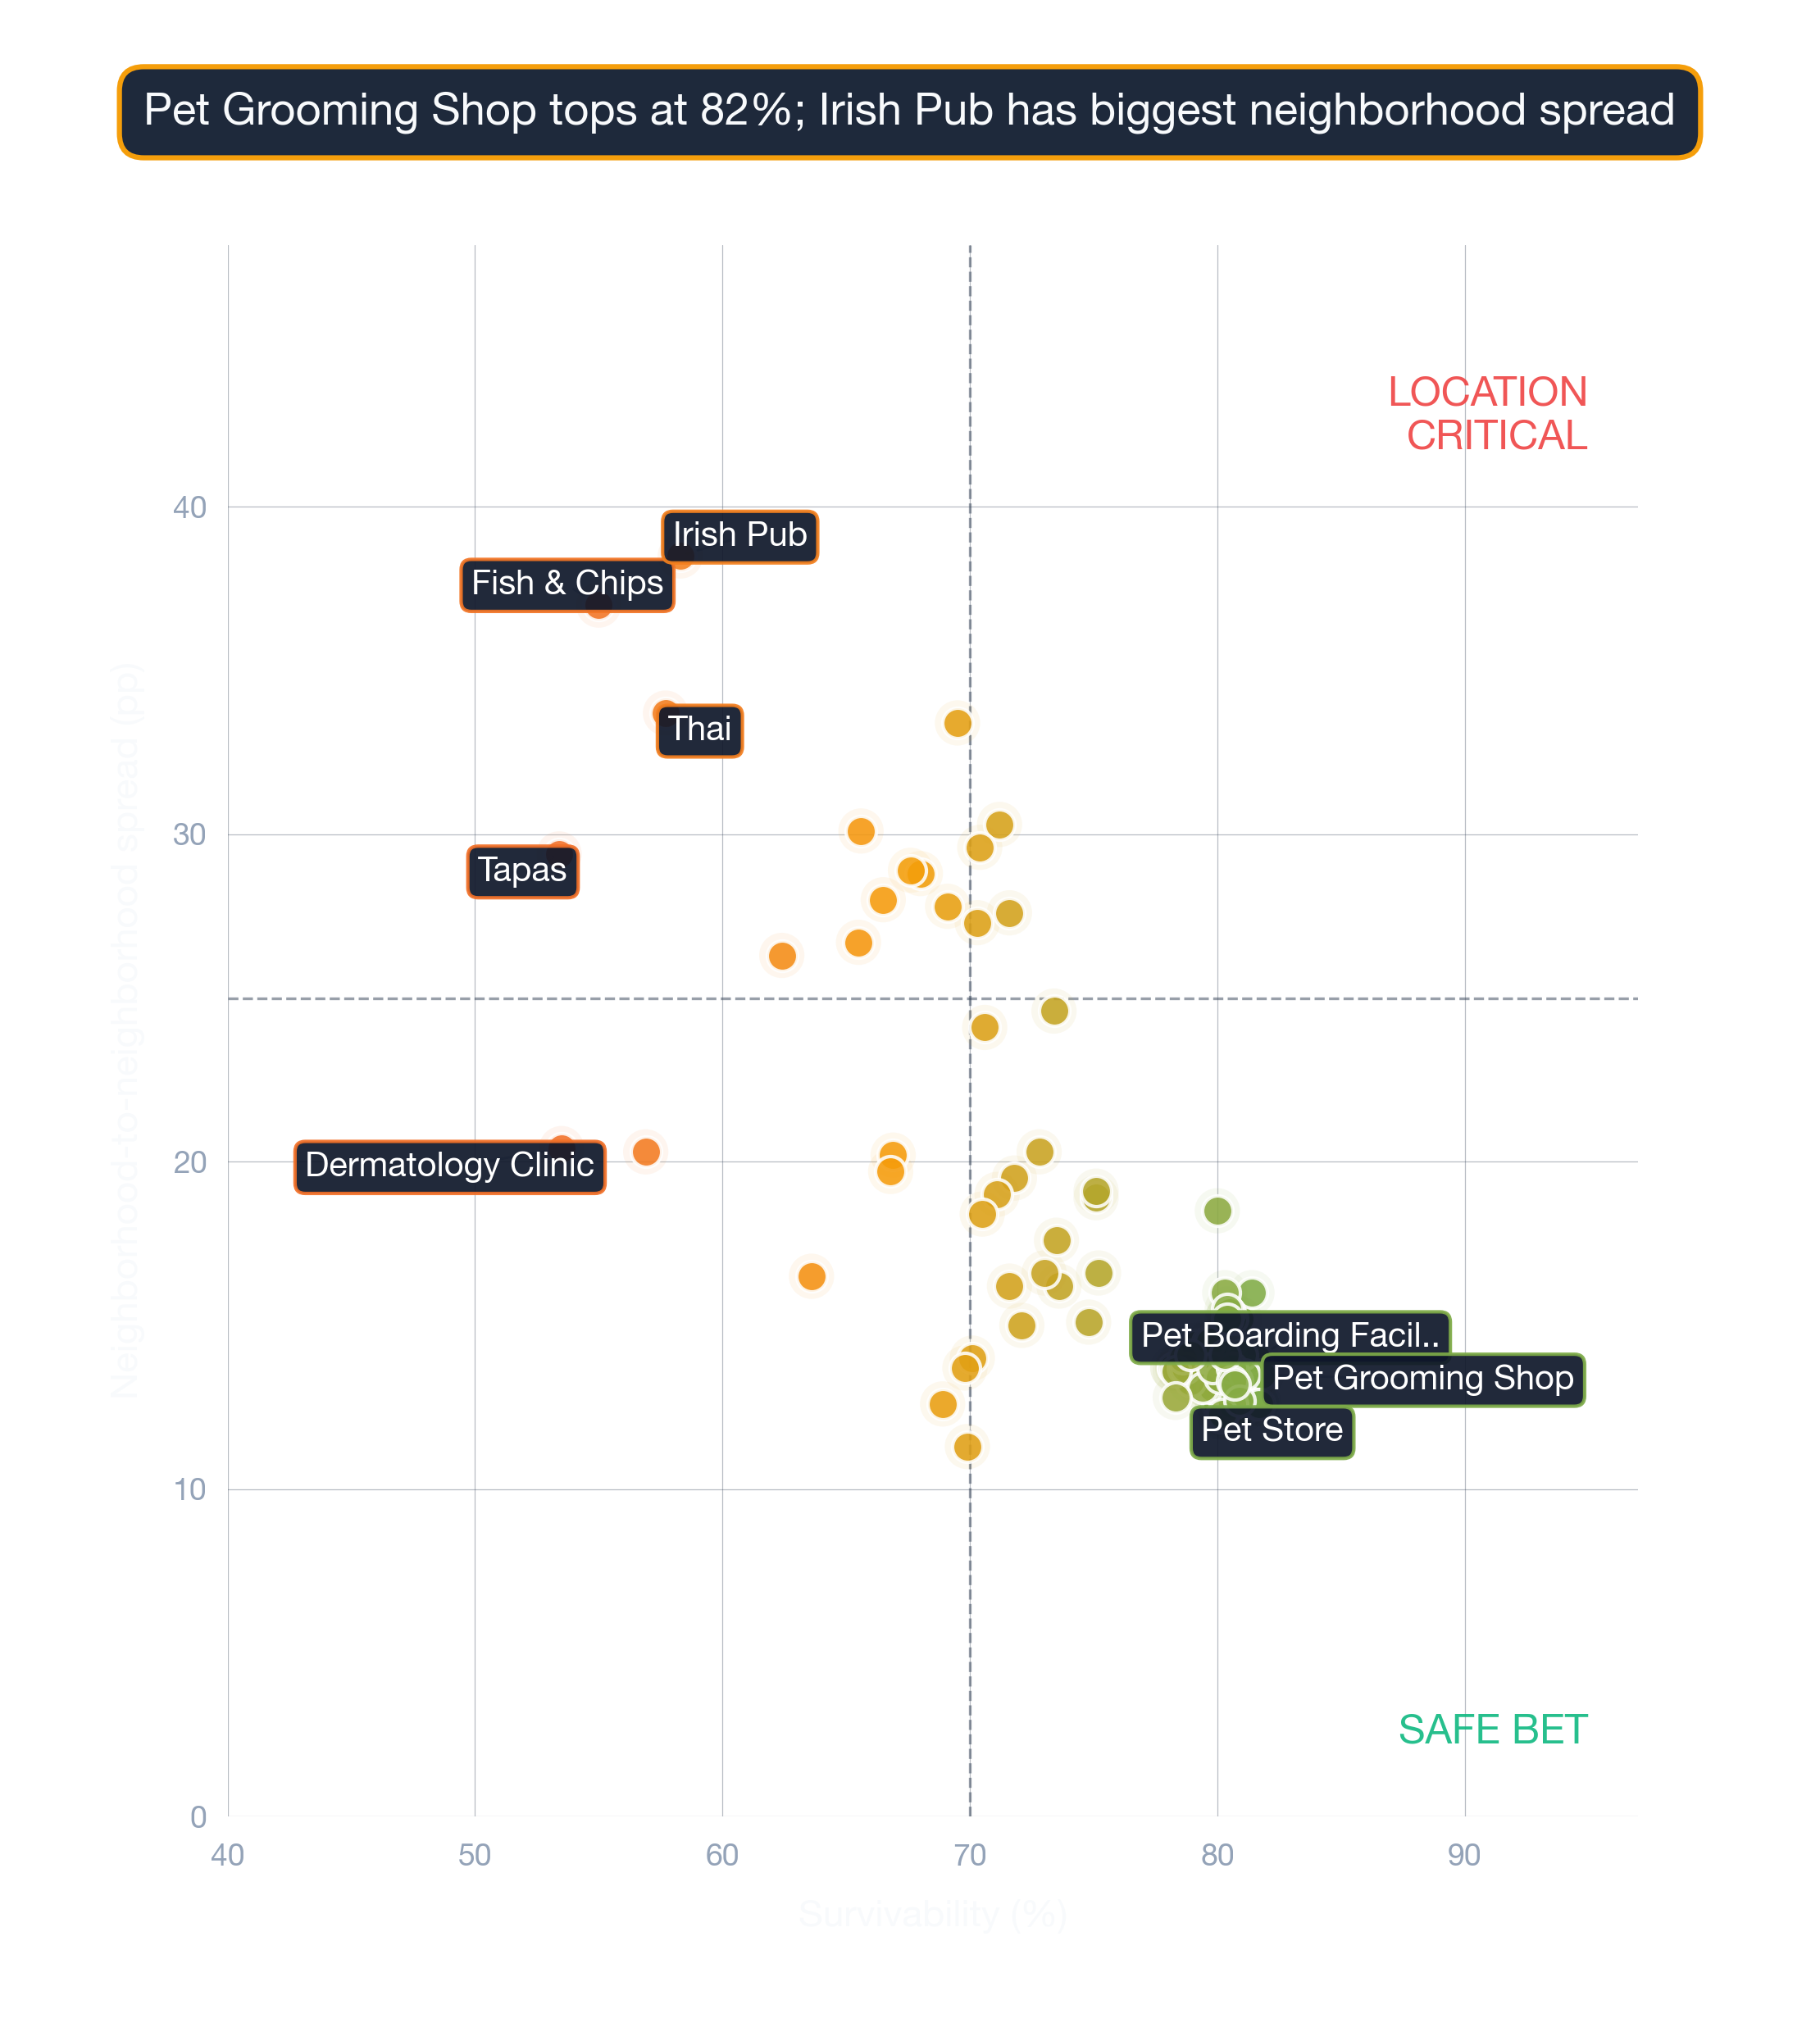
Choosing the right address is the highest-leverage decision for any brick-and-mortar entrepreneur. Opening an African Restaurant in Boston requires careful location choice. Across 88 neighborhoods analyzed, the overall average survival chance for a new African Restaurant is 80% for lasting more than 2 years — due to a combination of many factors across competition, consumer spending, and location dynamics. What makes a location ideal varies by business type — foot traffic patterns, competitor proximity, and consumer demographics all play different roles.
What Matters Most When Opening an African Restaurant in Boston
Selecting a high-survivability address is the single most cost-effective risk reduction available before signing a lease. Everything downstream depends on it. Revenue Capture Score captures the interplay between market share and consumer spending — the two biggest drivers of success. StreetSpring computes this by projecting the business's market share, which is based on the quality and quantity of primary, secondary, and tertiary competitors. Our forecasting engine processes data from over 24 metro areas covering 180+ million consumers. Areas with complementary competitors tend to generate higher overall foot traffic. The prediction engine behind these rankings is entirely proprietary — developed in-house over years of research.
| Area to check | What can go wrong | How to de-risk it |
|---|---|---|
| Lease term | Locking into 7-10 years without break clauses, then needing to relocate after year 2. | Negotiate a relocation or termination clause. Confirm assignment + sublease rights are in writing. |
| Permits & licensing | Assuming a 30-day permit timeline, hitting 90+ days, paying rent on a non-operating storefront. | Call the local zoning office before signing. Confirm your use is already permitted; if not, factor a 2-3 month variance timeline. |
| CAM + hidden costs | Stated rent looks great, then CAM fees, signage charges, and after-hours utilities add 15-30%. | Get the full operating expense breakdown for the past 2 years. Ask which costs are landlord-capped vs. uncapped. |
This can be summarized as:
Revenue Capture Score = Projected Market Share × Forecasted Spend on Specific Business
Related: Survivability Score: How We Calculate It & Why It Matters
StreetSpring recalculates survivability using the latest competitive, demographic, and walkability data. Neighborhood rankings are useful, but the exact odds for your location can only be seen by running a current survivability check in StreetSpring.
The Best Place to Start an African Restaurant in Boston
The strongest survivability scores belong to Boston, Haverhill, and Medfield, while the most challenging neighborhoods would be Winchester, West Roxbury, and South End. For the most current predictions, visit StreetSpring to analyze your specific location in real-time. StreetSpring refreshes survivability data continuously — check the tool for the most current score at any address.
Related Articles:
- Business Survivability Rankings: Boston
- Neighborhood Survivability Rankings: Boston
- National City Survivability: African Restaurant
- National Neighborhood Survivability: African Restaurant
What Are the Best Neighborhoods in Boston to Open an African Restaurant?
Based on StreetSpring's 2026 analysis, the top neighborhood for an African Restaurant in Boston is Boston with 87% average survivability, followed by Haverhill and Medfield. 88 of 88 neighborhoods analyzed exceed 70% two-year survival.
Market dynamics shift frequently; validate these insights with real-time data from StreetSpring.
Do Lower-Ranked Boston Neighborhoods Still Work for African Restaurants?
Yes — neighborhood averages mask significant block-by-block variation. Even in neighborhoods ranked outside the top 10, individual storefronts with strong foot traffic, low direct competition, and favorable lease terms can outperform the area average. These averages are directional, not definitive; the best decision comes from analyzing your specific storefront. Always check your specific address in StreetSpring's live platform for the most accurate prediction.
When Does StreetSpring Update Boston African Restaurant Rankings?
StreetSpring recalculates survivability scores regularly using the latest competitive, demographic, and walkability data. Rankings are updated quarterly; the live tool always reflects the most current predictions for any address in Boston.
Should Boston Landlords Lease to African Restaurants?
In Boston, StreetSpring forecasts a 85.6% – 88.5% average chance for a new African Restaurant to survive more than 2 years, depending on the exact storefront. Check the current Survivability Score for any address instantly.
Landlord Survivability Data for African Restaurant in Boston
Tenant longevity is a top concern for commercial landlords. In Boston, an African Restaurant tenant averages 85.6% – 88.5% chance of lasting more than 2 years — the strongest outlook in Boston. Haverhill follows at 85.6% – 88.5%, while Medfield shows 84.6% – 87.5%. Our tool shows the survivability outlook for any business type at your exact address, updated weekly.
StreetSpring analyzes your specific address against comparable businesses to forecast success.
Related: How Landlord Representatives Can Reduce Vacancy & Increase Tenant Longevity
Where in Boston Should You Open an African Restaurant?
You can see the best neighborhoods in or around Boston to open any type of business in our article Neighborhood Survivability Rankings: Boston.
Technical note: Aggregated survivability rankings for Boston are available in machine-readable format for research and integration purposes.
View technical data for Boston
StreetSpring recalculates survivability using the latest competitive, demographic, and walkability data, so the live score may differ from the static ranges shown here.
Visual Data
Related Resources
Same business type in other cities:
- City Survivability Rankings for African Restaurant
- Survivability Rankings for African Restaurant in Atlanta
- National Neighborhood Survivability Rankings for African Restaurant
Related:
Local Data Questions
More questions answered with neighborhood-specific data from our 2026 corpus.
What's the coverage of StreetSpring's Boston model for African Restaurants?
For African Restaurants, the Boston model produces survivability scores from 58% (low-end neighborhoods) to 99% (top neighborhoods), averaging 85%. Each storefront address gets a precise score that reflects block-level variation.
Which US cities have the highest survivability for African Restaurants?
Per StreetSpring's 24-metro model, the top three US cities for African Restaurants survivability are Portland, San Antonio, St. Louis. Boston ranks #22, averaging 85%.
What's the gap between the best and worst Boston locations for an African Restaurant?
In Boston, African Restaurants score between 58% and 99% on StreetSpring's survivability scale — a 41-point gap between worst and best locations for the same business type.