Survivability Rankings for Tapas Restaurant in Boston
StreetSpring's 2026 analysis ranks the best and worst neighborhoods in Boston to open a Tapas Restaurant, from Kenmore (68% survival) to Lexington (39%).
By Bobby Koons | Last reviewed by Bobby Koons on May 5, 2026 | Methodology
Quick Summary
- #1 Neighborhood: Kenmore — 68% average survivability for Tapas Restaurant
- Neighborhoods at or above 70%: 0 of 88 analyzed
- City-wide average: 53% for Tapas Restaurants
- Most challenging area: Lexington at 39%
- Revenue advantage (top vs. avg location): ~27.7% more expected revenue in Kenmore
- Data freshness: 2026 data · Full methodology →
Table of Contents
- Summary
- 10 Best Neighborhoods
- Where Would a Tapas Restaurant Make the Most Money?
- What Should I Consider?
- Where Should I Start?
- FAQ: Best Neighborhoods
- FAQ: Can a Tapas Restaurant Succeed in Lower-Ranked Areas?
- FAQ: How Often Are Rankings Updated?
- FAQ: Is a Tapas Restaurant a Good Tenant?
- Landlord Survivability Data
- Best Neighborhoods for Any Business
Summary
Opening a Tapas Restaurant in Boston? Our 2026 analysis identifies Kenmore as the top location with 68% average chance of surviving more than 2 years, with the best locations offering 75% and the most challenging locations in Kenmore at 61%. The worst neighborhoods include Lexington with 39% average chance. However, individual locations vary widely, and even in lower-scoring neighborhoods there are pockets that perform exceptionally well.
Where in Boston Should You Open a Tapas Restaurant?
Kenmore ranks #1 of 88 neighborhoods analyzed in and around Boston for Tapas Restaurant survivability with a score of 68% as of 2026. The top 10 neighborhoods are:
The data signals behind these scores
| Rank | Neighborhood | Best Locations | Average Locations | Challenging Locations |
|---|---|---|---|---|
| 1 | Kenmore | 72.0% – 76.0% | 66.8% – 69.5% | 60.0% – 64.0% |
| 2 | Fenway | 74.0% – 78.0% | 66.5% – 69.2% | 58.0% – 62.0% |
| 3 | Cambridgeport | 71.0% – 75.0% | 66.5% – 69.2% | 62.0% – 66.0% |
| 4 | Mission Hill | 74.0% – 78.0% | 63.8% – 66.4% | 56.0% – 60.0% |
| 5 | Riverside | 68.0% – 72.0% | 63.2% – 65.9% | 58.0% – 62.0% |
| 6 | The Port - Area 4 | 68.0% – 72.0% | 63.0% – 65.7% | 56.0% – 60.0% |
| 7 | Mid-Cambridge | 69.0% – 73.0% | 62.4% – 65.1% | 55.0% – 59.0% |
| 8 | Allston | 70.0% – 74.0% | 61.1% – 63.8% | 49.0% – 53.0% |
| 9 | Cambridge | 63.0% – 67.0% | 60.8% – 63.5% | 56.0% – 60.0% |
| 10 | South End | 67.0% – 71.0% | 58.9% – 61.6% | 51.0% – 55.0% |
What the score spread tells you about risk
Location-level factors like visibility and adjacent tenants can override neighborhood-level trends. Static rankings provide a useful baseline, but the live tool captures changes that have occurred since publication.
Survivability ranges reflect best and worst storefront conditions within each neighborhood. See our full methodology →
Try StreetSpring to see if this location is still the best and see if there are locations to rent in this area right now.
Where in or Around Boston Would a Tapas Restaurant Make the Most Money?
In Kenmore, the best possible location offers the opportunity of making ~27.7% more than the average location in or around Boston.
On the other hand, in Lexington, the worst possible location could result in making ~27.4% less than the average location in the city.
The difference between success and failure often comes down to where you sign the lease. Opening a Tapas Restaurant in Boston requires careful location choice. Across 88 neighborhoods analyzed, the overall average survival chance for a new Tapas Restaurant is 53% for lasting more than 2 years — due to a combination of many factors across competition, consumer spending, and location dynamics. Survivability predictions are business-type-specific because consumer behavior differs fundamentally across categories.
What Should I Consider When Opening a Tapas Restaurant in or Around Boston?
There is no operational fix for a poorly chosen location. Use Survivability Score as a hard filter on candidate addresses before evaluating other factors. Of all the variables StreetSpring analyzes, Revenue Capture Score has the strongest predictive power. StreetSpring computes this by projecting the business's market share, which is based on the quality and quantity of primary, secondary, and tertiary competitors. StreetSpring has analyzed hundreds of thousands of business outcomes across major US metros. Our data shows that businesses in moderately competitive clusters survive longer than isolated storefronts on average. These results are powered by exclusive algorithms trained on one of the largest commercial real estate datasets in the U.S.
| Area to check | What can go wrong | How to de-risk it |
|---|---|---|
| Foot traffic seasonality | Looking at a peak-summer Tuesday and assuming year-round volume. | Walk the block at 3 different times across 2 different weeks. Ask neighboring tenants for their slow-season % drop. |
| Permits & licensing | Assuming a 30-day permit timeline, hitting 90+ days, paying rent on a non-operating storefront. | Call the local zoning office before signing. Confirm your use is already permitted; if not, factor a 2-3 month variance timeline. |
| Permitted hours | Late-night or early-morning ops blocked by zoning, neighborhood association, or shared-wall restrictions. | Confirm the permitted hours-of-operation are in your lease AND in the local code. Pull recent variances or complaints from the zoning portal. |
This can be summarized as:
Revenue Capture Score = Projected Market Share × Forecasted Spend on Specific Business
Related: Survivability Score: How We Calculate It & Why It Matters
StreetSpring recalculates survivability using the latest competitive, demographic, and walkability data. Our live tool reflects the latest competitive landscape — these static rankings may already be slightly out of date.
Pinpointing the Right Neighborhood for a Tapas Restaurant in Boston
Based on our analysis, the leading neighborhoods are Kenmore, Fenway, and Cambridgeport, while the most challenging neighborhoods would be Lexington, Belmont, and Hyde Park. These rankings are based on the latest available data; check StreetSpring for real-time updates. Static rankings provide a useful baseline, but the live tool captures changes that have occurred since publication.
Related Articles:
Which Boston Neighborhoods Are Strongest for Tapas Restaurants?
Based on StreetSpring's 2026 analysis, the top neighborhood for a Tapas Restaurant in Boston is Kenmore with 68% average survivability, followed by Fenway and Cambridgeport. 0 of 88 neighborhoods analyzed exceed 70% two-year survival.
StreetSpring refreshes survivability data continuously — check the tool for the most current score at any address.
Should You Consider Lower-Survivability Areas of Boston for a Tapas Restaurant?
Yes — neighborhood averages mask significant block-by-block variation. Even in neighborhoods ranked outside the top 10, individual storefronts with strong foot traffic, low direct competition, and favorable lease terms can outperform the area average. Location-level factors like visibility and adjacent tenants can override neighborhood-level trends. Always check your specific address in StreetSpring's live platform for the most accurate prediction.
Refresh Cadence for Boston Tapas Restaurant Survivability Rankings
StreetSpring recalculates survivability scores regularly using the latest competitive, demographic, and walkability data. Rankings are updated quarterly; the live tool always reflects the most current predictions for any address in Boston.
Should Boston Landlords Lease to Tapas Restaurants?
In Kenmore, StreetSpring forecasts a 66.8% – 69.5% average chance for a new Tapas Restaurant to survive more than 2 years, depending on the exact storefront. Check the current Survivability Score for any address instantly.
Landlord Survivability Data for Tapas Restaurant in Boston
From a risk-assessment perspective, a Tapas Restaurant tenant in Kenmore carries the lowest risk with average survivability of 66.8% – 69.5%. Fenway presents moderate risk (66.5% – 69.2%), and Cambridgeport carries comparatively higher risk at 66.5% – 69.2%. See which business types are most likely to succeed at your property address right now.
StreetSpring can give you the precise likelihood that hundreds of different businesses will last at an exact address.
Related: How Landlord Representatives Can Reduce Vacancy & Increase Tenant Longevity
Top-Survivability Boston Neighborhoods for Tapas Restaurants
You can see the best neighborhoods in or around Boston to open any type of business in our article Neighborhood Survivability Rankings: Boston.
Technical note: Aggregated survivability rankings for Boston are available in machine-readable format for research and integration purposes.
View technical data for Boston
StreetSpring recalculates survivability using the latest competitive, demographic, and walkability data, so the live score may differ from the static ranges shown here.
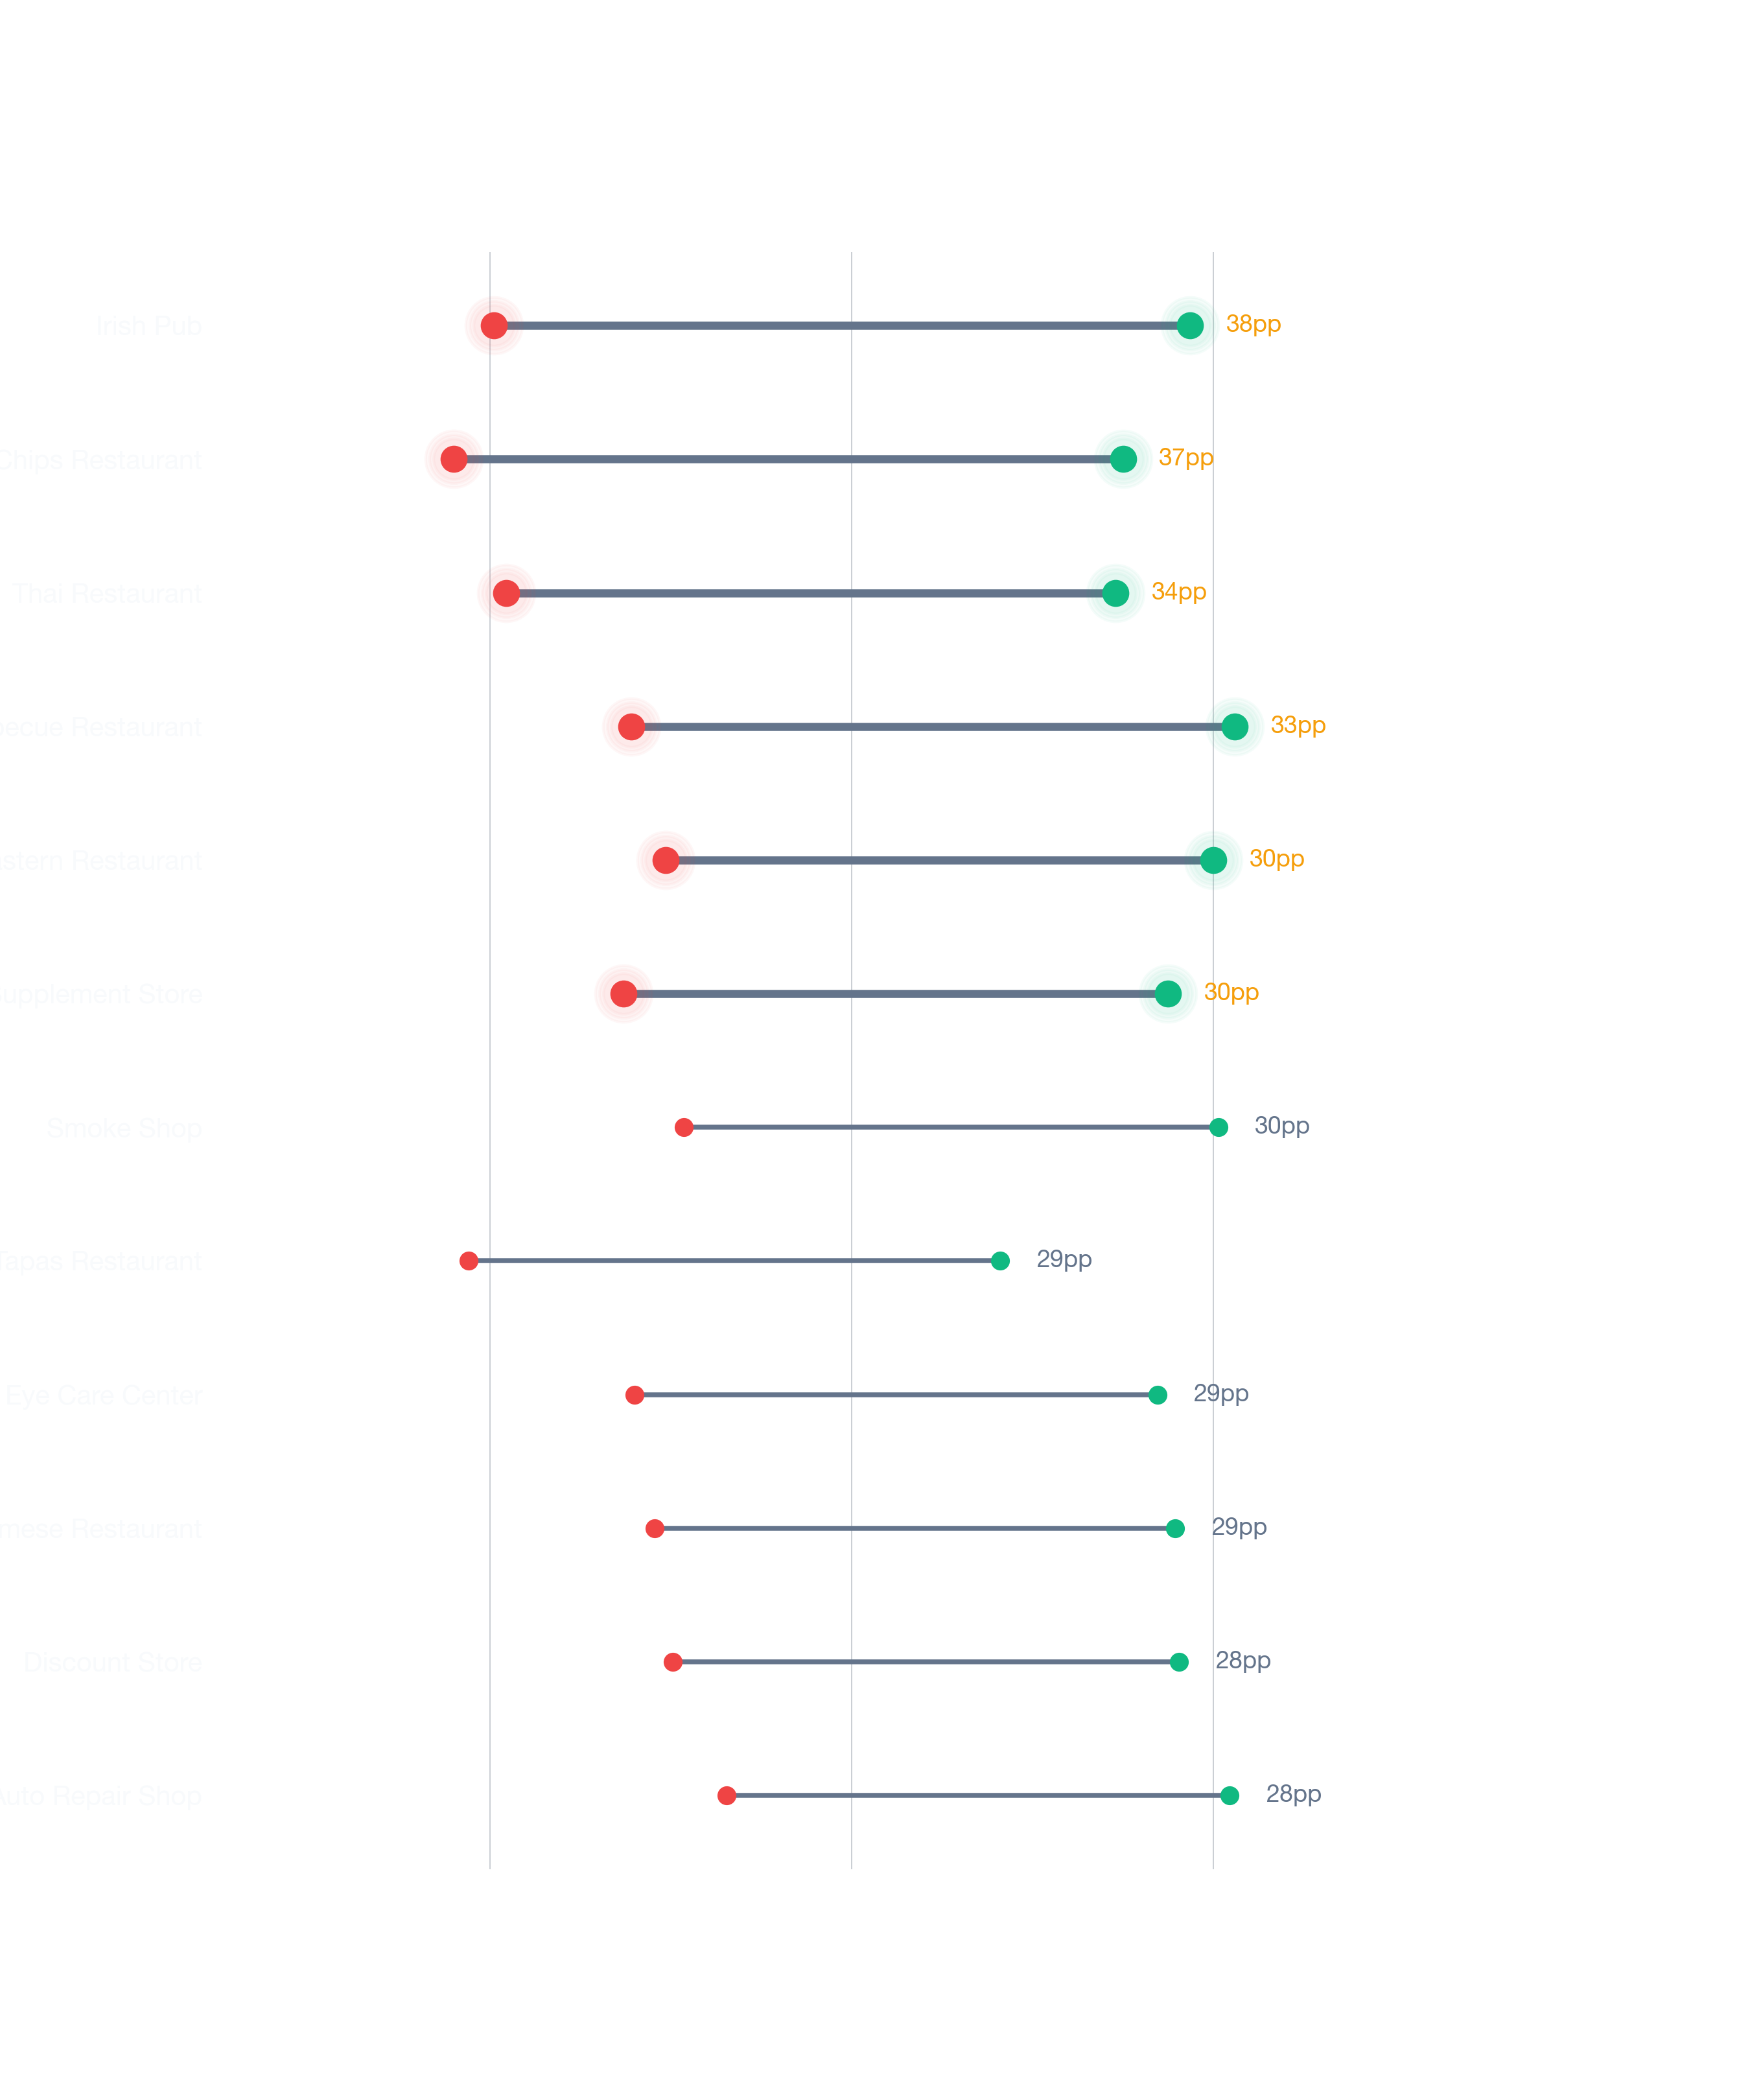
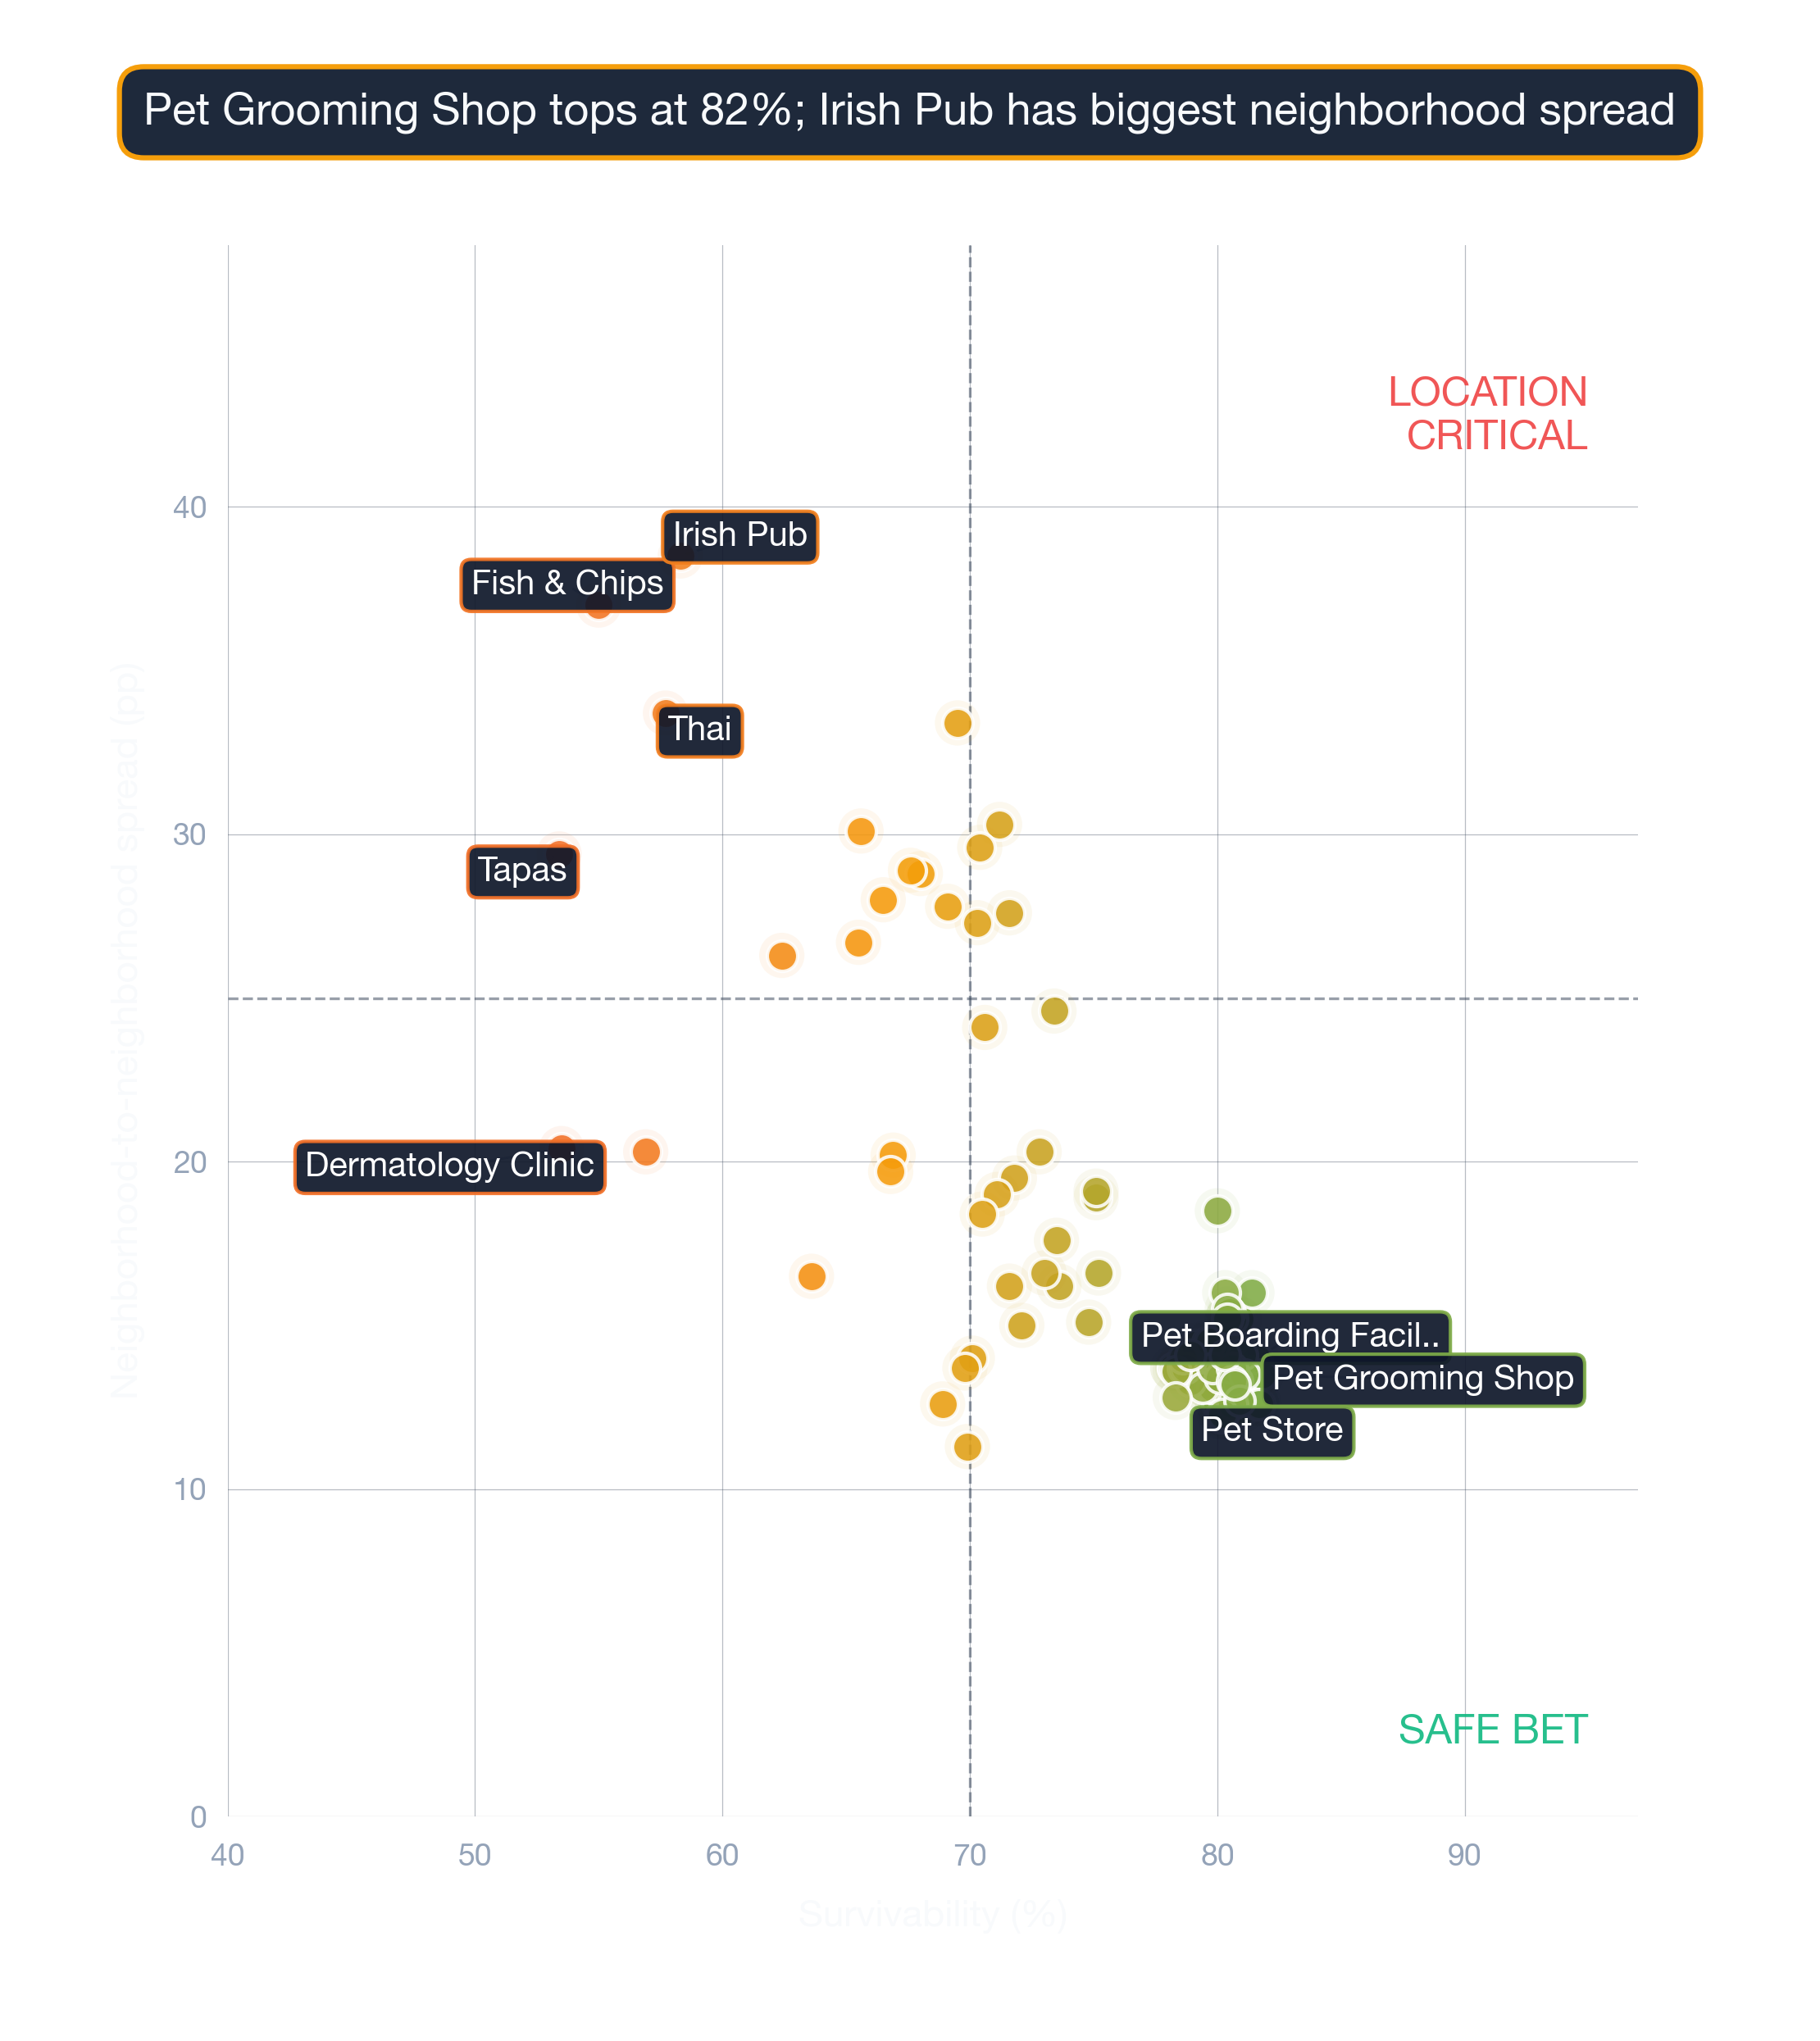
Visual Data
Related Resources
Related:
Related:
- Survivability Rankings for Acupuncture Clinic in Atlanta
- Survivability Rankings for Afghan Restaurant in Atlanta
- Survivability Rankings for African Restaurant in Atlanta
More Questions About This Location
More questions answered with neighborhood-specific data from our 2026 corpus.
When does StreetSpring update Boston Tapas Restaurants rankings?
The Boston Tapas Restaurants survivability corpus refreshes quarterly. The current dataset (2026 release) reflects Boston's ~86% average for this subtype. New competitor openings, closures, and ACS releases are integrated each refresh cycle.
What's the survivability spread for Tapas Restaurants across Boston?
In Boston, Tapas Restaurants score between 61% and 99% on StreetSpring's survivability scale — a 38-point gap between worst and best locations for the same business type.
What factors drive the Boston Tapas Restaurants score?
The Boston survivability score for Tapas Restaurants (86% average) combines ~100 location factors: competitive density, demographic fit, accessibility, visibility, lease economics, and historical business outcomes. The score is calibrated against 500K+ historical business outcomes and refreshed quarterly.
What does BLS data say about Tapas Restaurant survival nationally?
BLS data shows Tapas Restaurants survive 5 years at a 50% rate nationally. In Boston, StreetSpring's location-specific survivability score for this subtype averages 86% — above the national figure by 36 points.
Where does Boston fall in national rankings for Tapas Restaurants?
For Tapas Restaurants, Boston ranks #21 out of 24 metros with an average survivability score of 86%. The strongest metro tops out at 89%; the weakest at 84%.