Business Survivability in Needham, Boston
StreetSpring's 2026 analysis finds that the best business to open in Needham is an Indonesian Restaurant with a ~87% chance of surviving at least 2 years across the neighborhood on average.
Quick Summary
- Best business: an Indonesian Restaurant in Needham (~87% average survival rate, ~89% at best locations)
- Neighborhood rank: #35 across all neighborhoods in and around Boston
- Neighborhood average: ~77% two-year survival across all business types
- Rankings updated quarterly with latest market data
- Detailed methodology
Reviewed and updated: May 11, 2026 — Bobby Koons, Founder & CEO, StreetSpring
In this article:
- Summary
- Is Needham a good place to start a business?
- How to find the best location
- Best businesses to open
- How much money could a business make?
- What businesses should open next?
- Frequently Asked Questions
Summary
StreetSpring's 2026 analysis finds that the best business to open in Needham is an Indonesian Restaurant with a ~87% chance of surviving at least 2 years across the neighborhood on average, with the best locations offering a ~89% chance; next is a Pet Boarding Facility with a ~87% chance, followed by a Singaporean Restaurant with a ~86% chance.
Is Needham a good place to start a business?
Among all neighborhoods in and around Boston, Needham ranks #35 for business survivability, with an average score of ~77%.
- At the strongest addresses in Needham, the most viable business types score ~2% higher than the average survivability rate across all locations.
- Still, those same business types at weaker addresses in Needham can score well below the neighborhood mean. Even the most viable concept here requires the right address to reach its potential.
- Needham's employment rate of 95.6% and commercial vacancy of 2.9% are two of the inputs StreetSpring's model uses to differentiate survivability within this neighborhood.
Employment and vacancy figures sourced from the U.S. Census Bureau American Community Survey.
How can you find the best location to open a business in Needham?
The right address in Needham can mean a 20-point survivability difference from an average one — StreetSpring identifies exactly which addresses are worth pursuing. Of all available storefronts analyzed in Needham, StreetSpring ranks this area highest for an Indonesian Restaurant in 2026:
Why the right block matters more than the right neighborhood
The 2026 model from StreetSpring places the strongest storefronts inside this circle for an Indonesian Restaurant in Needham. Even the best-ranked neighborhoods contain locations that underperform — and the worst-ranked ones have hidden gems. StreetSpring's prediction model analyzes 100 factors across competition, spending on the specific potential business, projected revenue, projected market share, Revenue Capture Score, mobility patterns, and many more.
Check if this location is still available →
Which business types have the highest survivability in Needham?
#1-5: Highest Survivability in Needham
- Indonesian Restaurant — ~85%–~89% survivability range, with an average of ~87% across Needham.
- Opening a Pet Boarding Facility in Needham shows ~87% average survivability. Top locations reach ~89%; lower-end sites show ~85%.
- Singaporean Restaurant (Ranked #3): ~86% average in Needham. Best-case storefronts: ~89%. Challenging locations: ~85%.
- Deli is ranked #4 for top businesses to open in Needham: ~86% chance on average, best at ~87%, challenging at ~84%.
- Ukrainian Restaurant — ~84%–~88% survivability range, with an average of ~86% across Needham.
#6-10: Strong Performers in Needham
- Opening a Kosher Restaurant in Needham shows ~86% average survivability. Top locations reach ~88%; lower-end sites show ~84%.
- Italian Restaurant (Ranked #7): ~86% average in Needham. Best-case storefronts: ~87%. Challenging locations: ~84%.
- American Restaurant is ranked #8 for top businesses to open in Needham: ~86% chance on average, best at ~87%, challenging at ~84%.
- Bangladeshi Restaurant — ~84%–~88% survivability range, with an average of ~85% across Needham.
- Opening a South American Restaurant in Needham shows ~85% average survivability. Top locations reach ~87%; lower-end sites show ~84%.
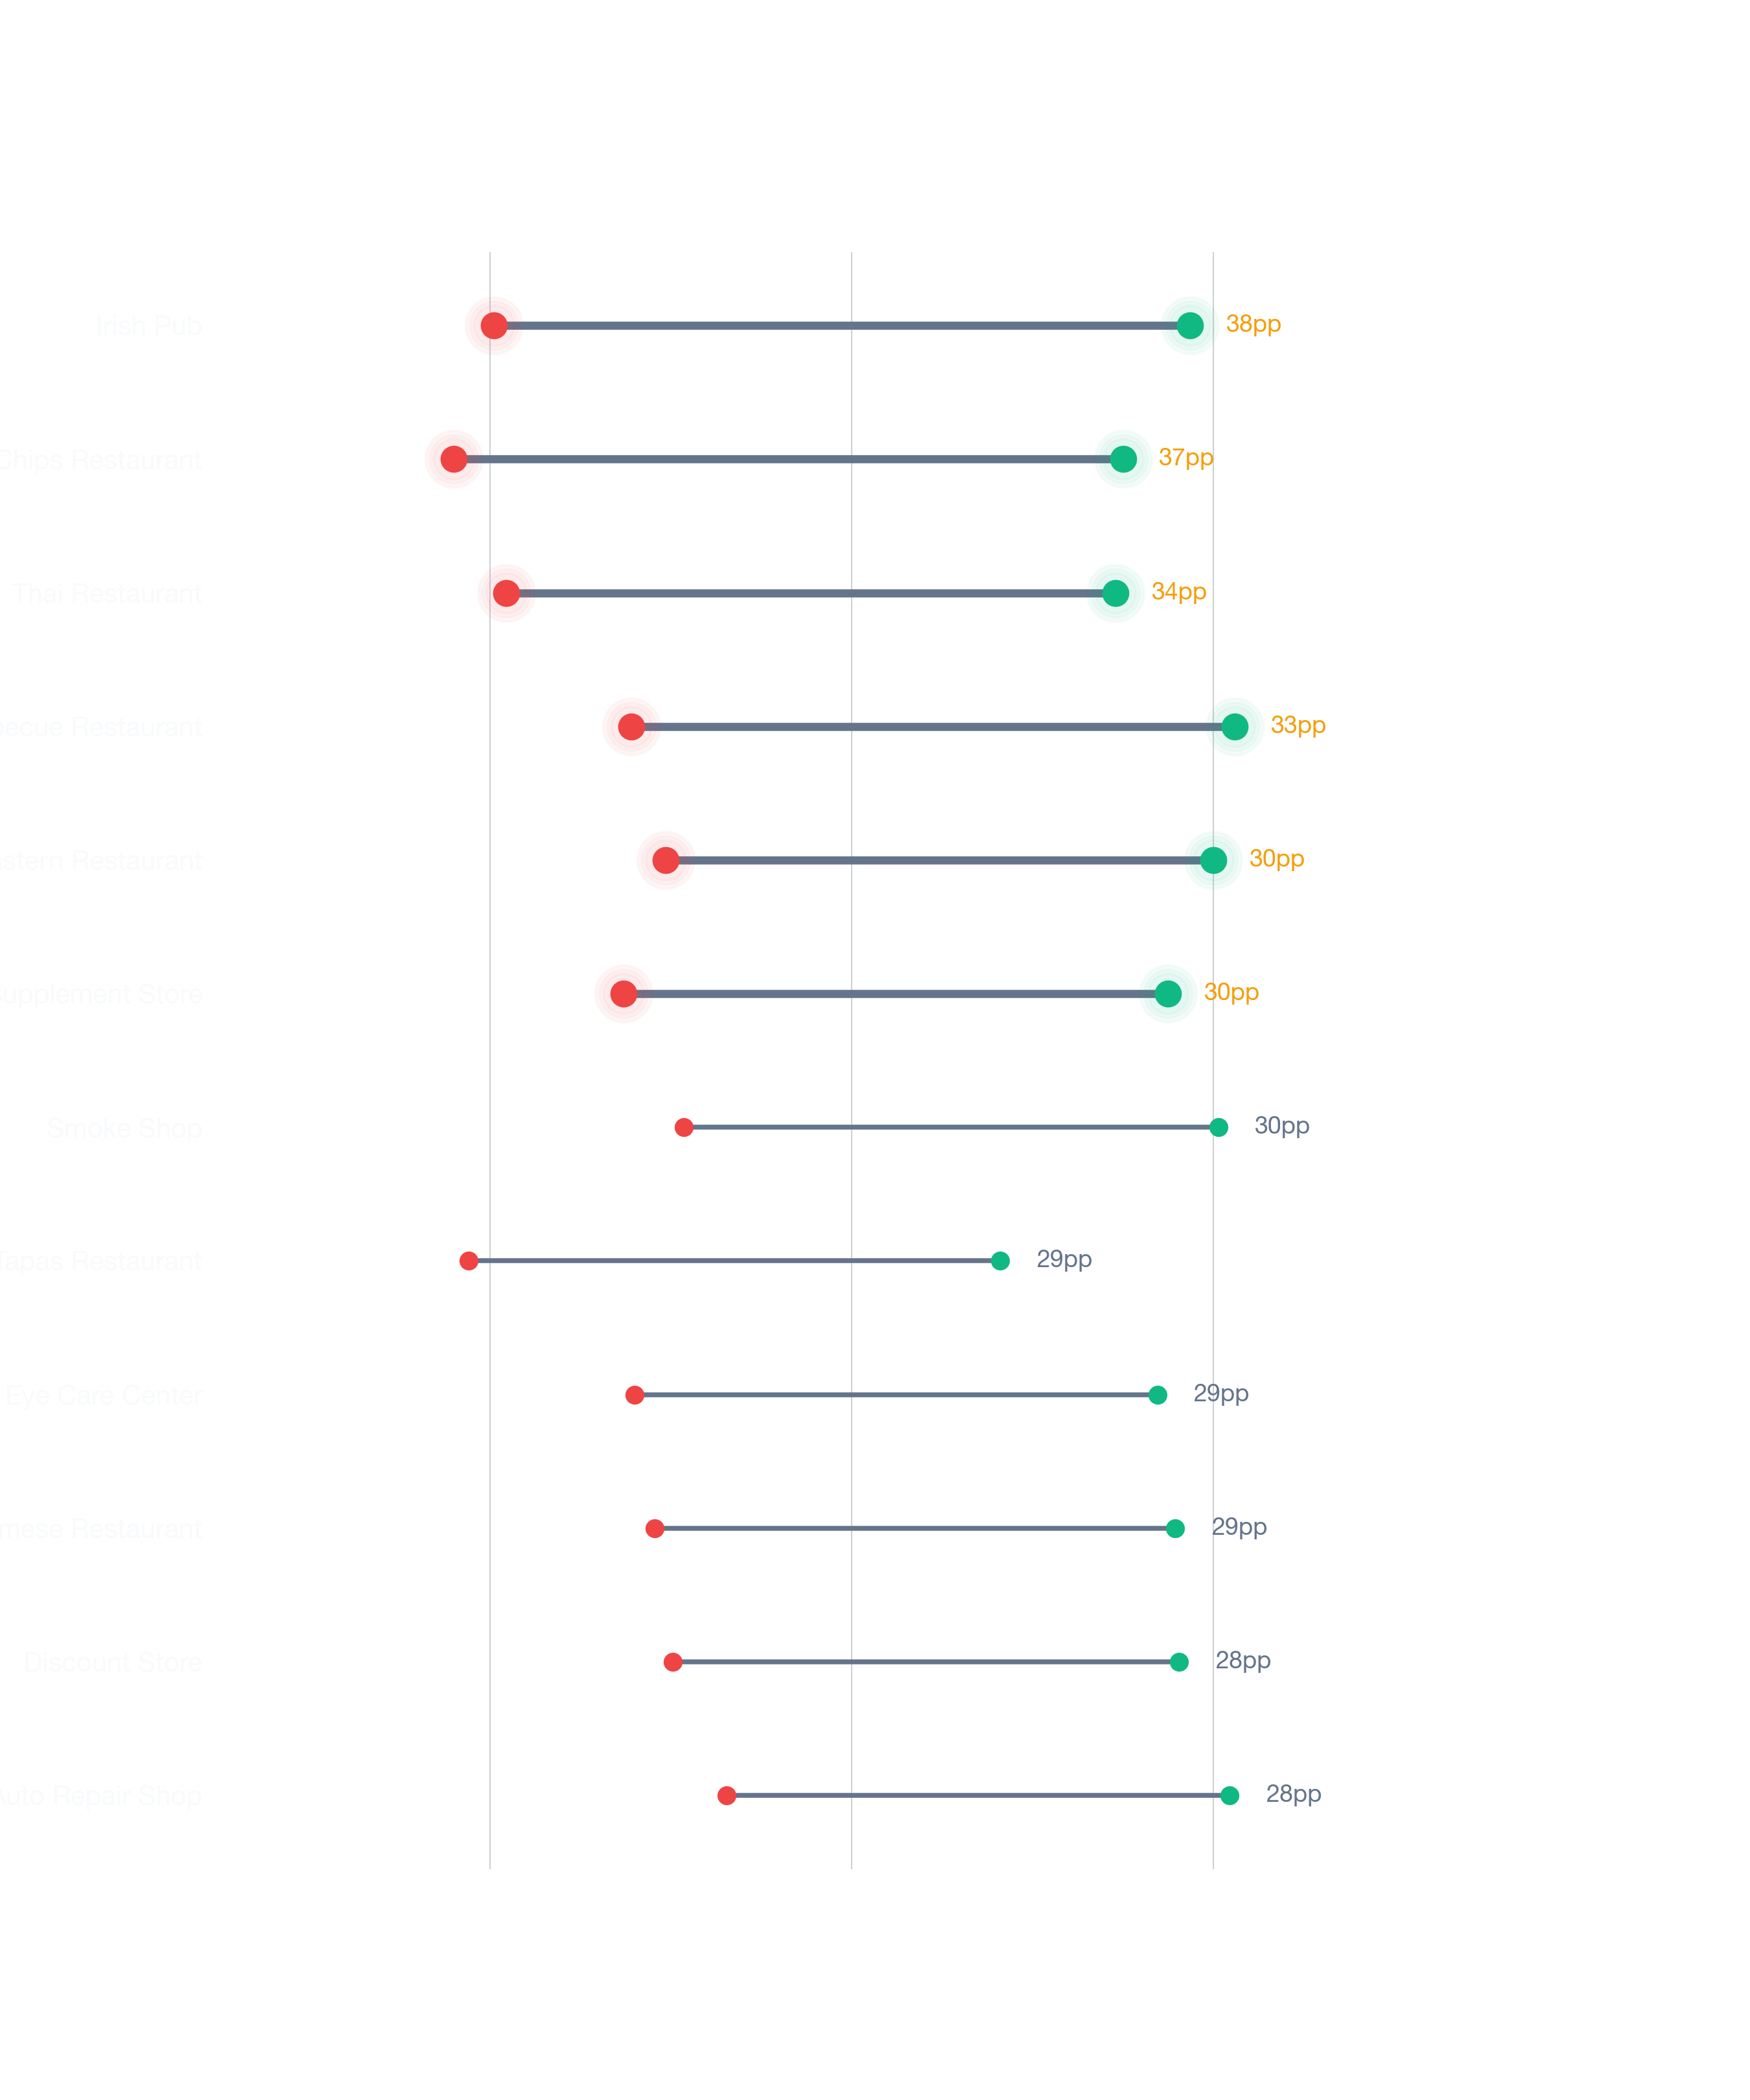
Top 3 Compared Nationally
What revenue can a Needham business expect?
Best location vs. average location
Based on StreetSpring's 2026 analysis, choosing an address that maximizes your Revenue Capture Score in Needham could lead to you making ~2% more than if you selected an average location, and ~4% more than if you selected one of the worst locations.
How StreetSpring calculates location value
- Different business models thrive in different micro-locations.
- The address you choose determines your competitive exposure, customer flow, and spending potential simultaneously.
- Maximizing your Survivability Score is the most reliable path to profitability.
- Every survivability score StreetSpring produces is specific to the exact address and business type — not averaged across a zip code or neighborhood.
The biggest opportunity gaps in Needham
The top businesses to open next in Needham:
- Indonesian Restaurants — ~87% average survival rate, up to ~89% at best locations
- Pet Boarding Facilities — ~87% average survival rate
- Singaporean Restaurants — ~86% average survival rate
Even the best-ranked neighborhoods contain locations that underperform — and the worst-ranked ones have hidden gems. Our platform incorporates data from thousands of neighborhoods nationwide. A 2.9% vacancy rate in Needham reflects the current commercial environment; StreetSpring weights this directly in every survivability score for addresses in this neighborhood. Survivability scores are recalculated weekly as new competitors open and spending patterns shift — visit StreetSpring to see the current score for any open location in Needham right now.
See the Survivability Score for your new business
Related Articles:
Frequently Asked Questions
Here are the most common questions about opening a business in Needham.
What type of business should you rent your Needham storefront to?
Based on 2026 survivability scores across all business types in Needham, the top three tenant categories for landlords are Indonesian Restaurants, Pet Boarding Facilities, and Singaporean Restaurants.
- The address you choose determines your competitive exposure, customer flow, and spending potential simultaneously.
- Every survivability score StreetSpring produces is specific to the exact address and business type — not averaged across a zip code or neighborhood. Landlords can use StreetSpring to match their exact address to the tenant types most likely to stay open and paying rent for 2+ years.
Related: See How Landlord Representatives in Boston Can Reduce Vacancy & Increase Tenant Longevity
Should you rent your Needham storefront to an Indonesian Restaurant?
StreetSpring's data confirms an Indonesian Restaurant as the highest-survivability tenant type for Needham. The best addresses show a ~89% chance of lasting more than 2 years; less optimal addresses score around ~85%.
- Every survivability score StreetSpring produces is specific to the exact address and business type — not averaged across a zip code or neighborhood.
What should I consider when opening a business in Needham?
Survivability Score is the North Star metric for any location decision in Needham: it aggregates 100+ factors so you don't have to evaluate each one individually.
- StreetSpring's analysis consistently shows Revenue Capture Score predicts survival odds more accurately than demographic data or foot traffic estimates alone.
- StreetSpring's custom-built forecasting infrastructure powers every survivability score, combining data science with commercial real estate intelligence.
- The most current survivability data for Needham is free to access on StreetSpring — no account required to check your specific address.
See the best place for your business at StreetSpring.
StreetSpring combines proprietary data with advanced analytics to predict which businesses will succeed. Aggregated survivability rankings for Boston are available in machine-readable format for research and integration purposes.
The hidden costs of operating in this neighborhood
| Area to check | What can go wrong | How to de-risk it |
|---|---|---|
| Parking & visibility | Storefront looks great from the sidewalk but is invisible from the road. | Drive past at 30 mph from both directions. Count street parking + nearest paid lot capacity at peak hours. |
| Foot traffic seasonality | Looking at a peak-summer Tuesday and assuming year-round volume. | Walk the block at 3 different times across 2 different weeks. Ask neighboring tenants for their slow-season % drop. |
| Outdoor seating / sidewalk use | Signing assuming you can add patio seating, then learning the city requires a separate sidewalk-cafe permit with long lead times. | Check the city's sidewalk-cafe permit process up front. Confirm landlord allows outdoor build-out in the lease language. |
Full dataset for Boston: /resources/data/boston-survivability-scores-2026.csv — includes all business subtypes, all neighborhoods, survivability scores, and tier assignments. Licensed under CC BY 4.0.
Visual Data
Related Resources
Related:
Related:
- Business Survivability in Adair Park, Atlanta
- Business Survivability in Ansley Park, Atlanta
- Business Survivability in Ardmore, Atlanta
More Questions About This Location
Further questions, with answers anchored on this neighborhood's actual data.
What's the home ownership rate in Needham, and why does it matter?
83% of Needham households own their home, against 56% across the Boston metro. High ownership usually signals longer resident tenure and steadier local spending — favorable for sticky service-oriented businesses.
What survival rates does the federal government track for small businesses?
BLS Business Employment Dynamics data (March 2025 release) shows 5-year survival rates spanning 47.8% (Active Life) to 61.8% (Health & Medical) across the 11 sectors StreetSpring tracks. Restaurants — the most studied category — survive at 50% nationally, well above the often-cited "80% fail" myth.
How does income in Needham compare to the rest of Boston?
Needham's median household income ($175K) is above the Boston metro median ($135K) by approximately $40K. Higher median income supports premium retail, upscale dining, and discretionary services.
Is Needham's population younger or older than the Boston average?
Needham's median age is 43 versus a Boston metro median of 41 — older by 3 years. This shapes which business types tend to survive: The demographic profile is close to the metro average, so business-type fit is driven by other factors like income and competition.
Is Needham a high-employment or high-unemployment area?
ACS labor-force data shows an employment rate of about 96% in Needham, versus 96% across Boston. Employment is close to the metro median, suggesting stable underlying demand.