Business Survivability in Haverhill, Boston
StreetSpring's 2026 analysis finds that the best business to open in Haverhill is an Ukrainian Restaurant with a ~88% chance of surviving at least 2 years across the neighborhood on average.
Quick Summary
- Best business: an Ukrainian Restaurant in Haverhill (~88% average survival rate, ~91% at best locations)
- Neighborhood rank: #2 across all neighborhoods in and around Boston
- Neighborhood average: ~80% two-year survival across all business types
- Rankings updated quarterly with latest market data
- Detailed methodology
Last reviewed by Bobby Koons, Founder & CEO, StreetSpring — May 2, 2026
In this article:
- Summary
- Is Haverhill a good place to start a business?
- How to find the best location
- Best businesses to open
- How much money could a business make?
- What businesses should open next?
- Frequently Asked Questions
Summary
StreetSpring's 2026 analysis finds that the best business to open in Haverhill is an Ukrainian Restaurant with a ~88% chance of surviving at least 2 years across the neighborhood on average, with the best locations offering a ~91% chance; next is an Italian Restaurant with a ~88% chance, followed by an Indonesian Restaurant with a ~88% chance.
Is Haverhill the right neighborhood for a new business?
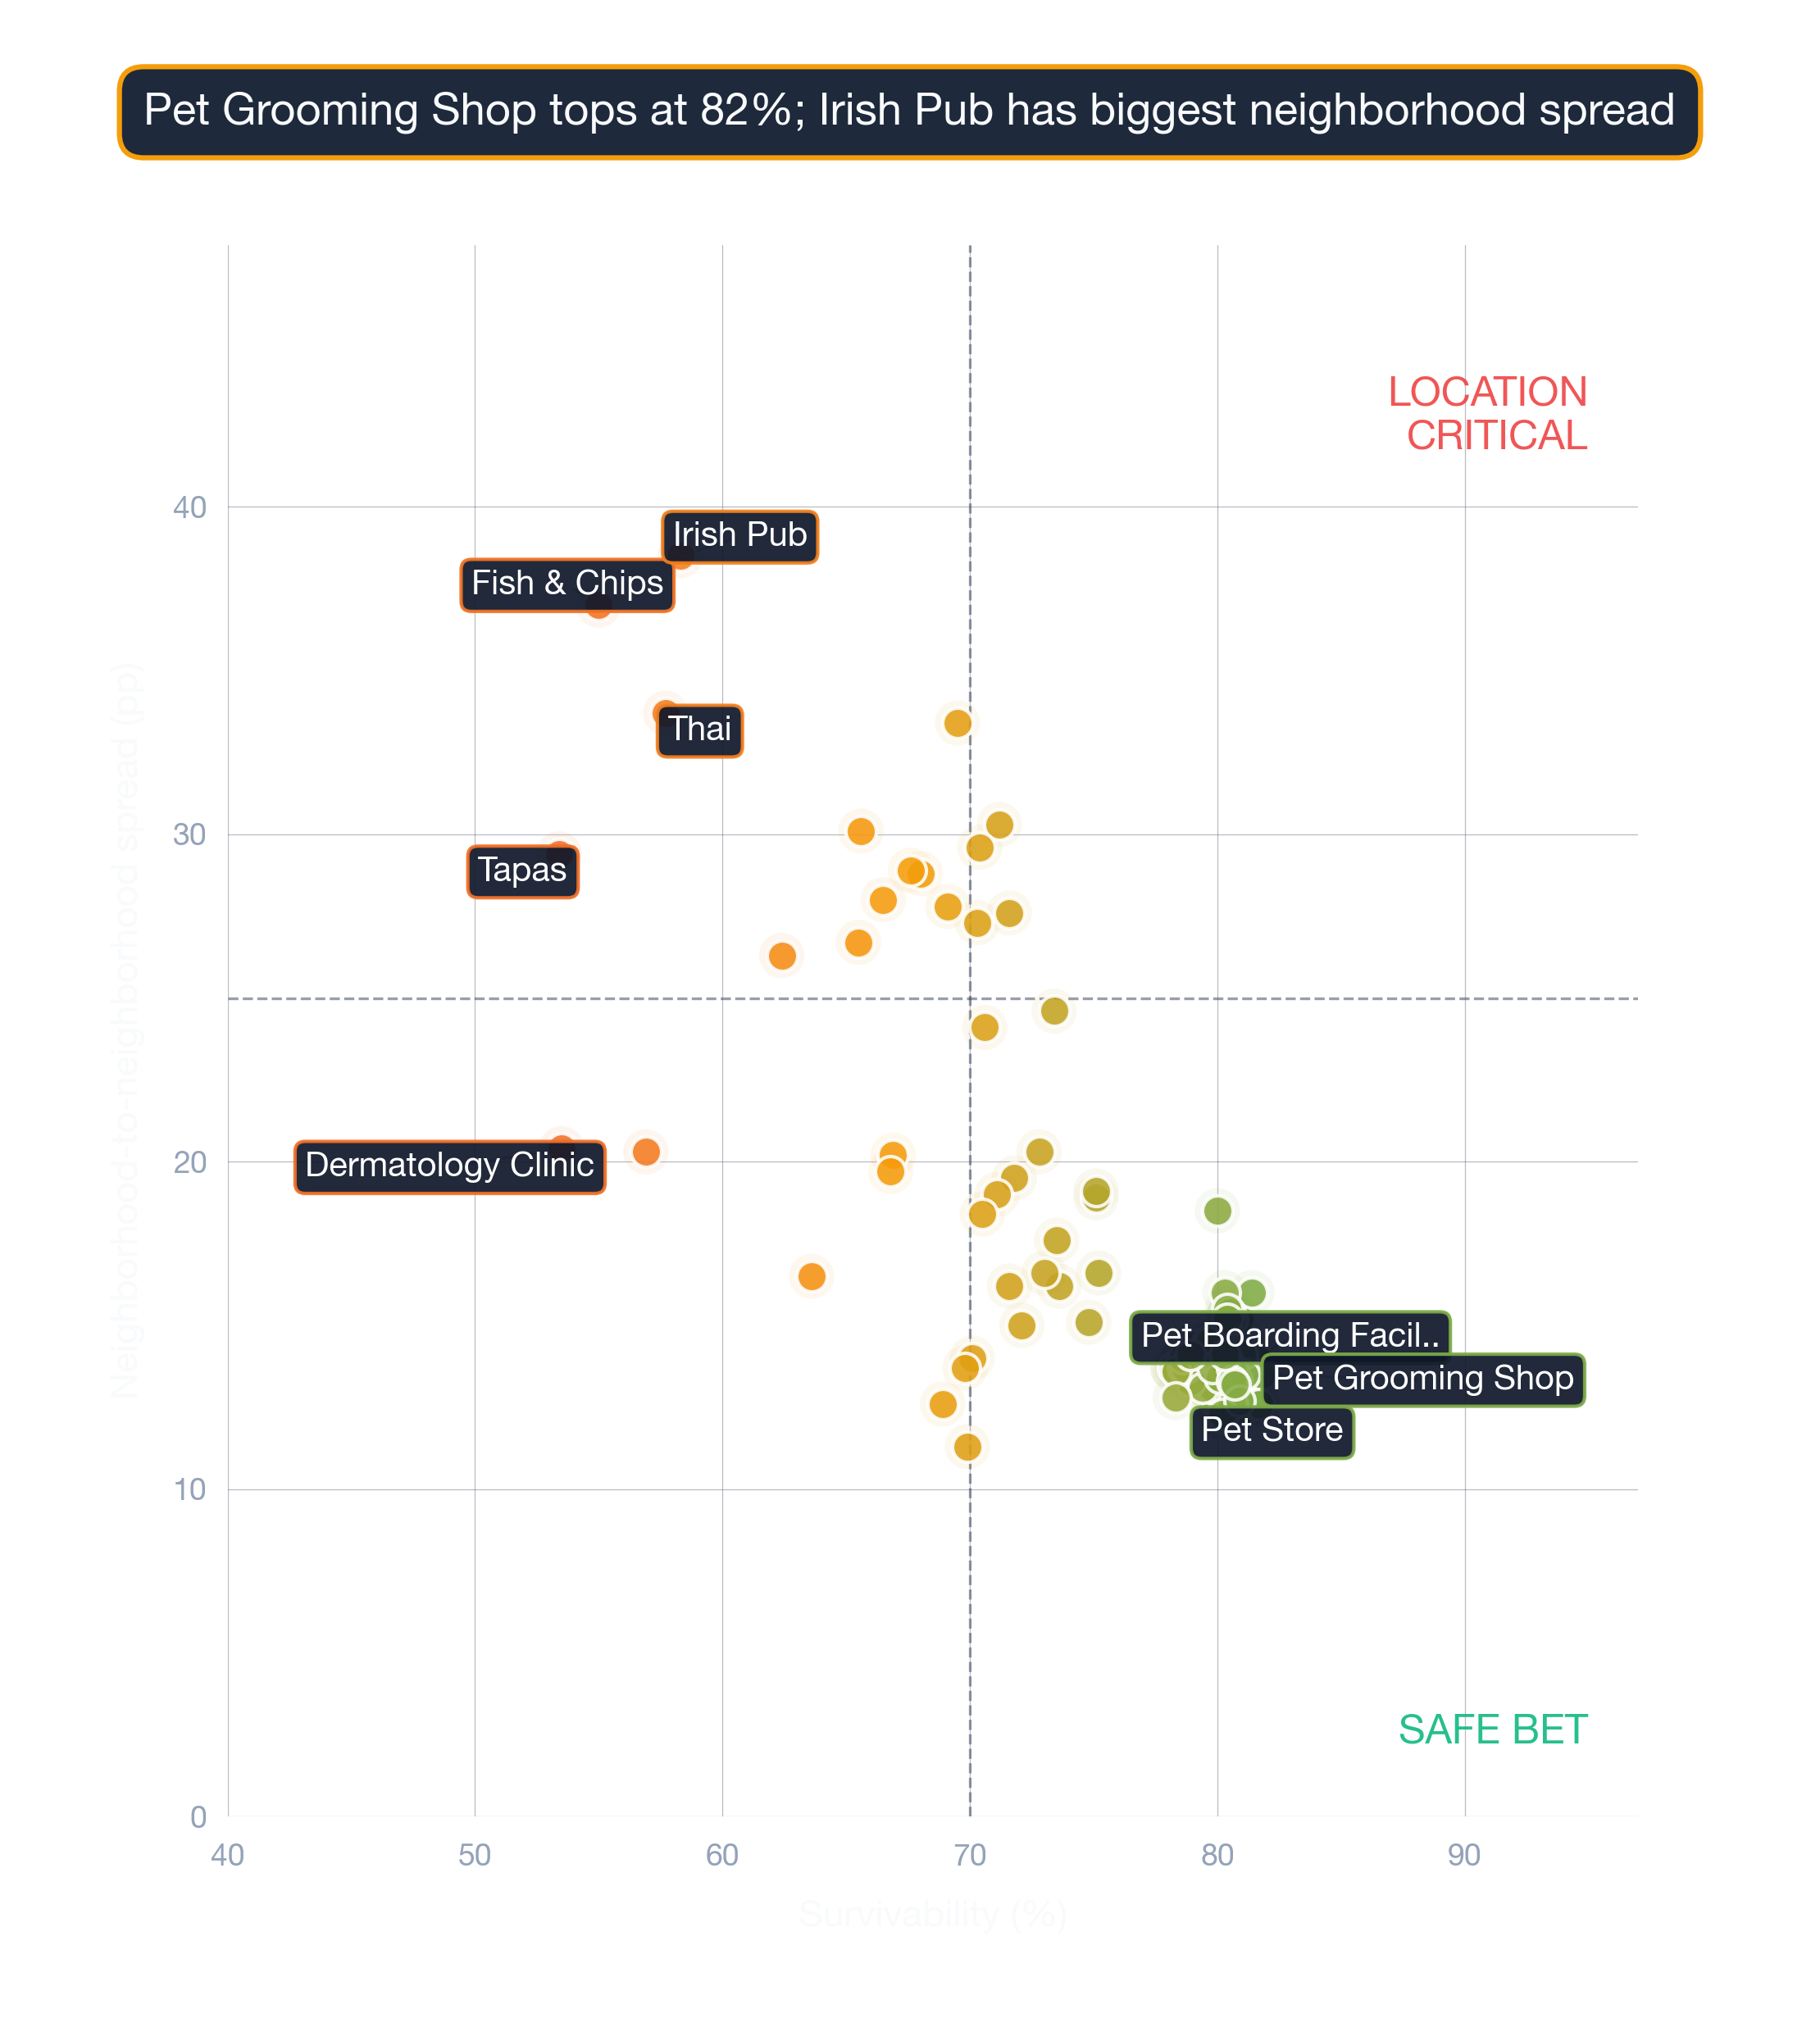
Across all neighborhoods in and around Boston, StreetSpring's data places Haverhill at #2 with a ~80% average Survivability Score.
- Best-case locations for the top business types in Haverhill produce survivability scores ~2% above the neighborhood-wide average.
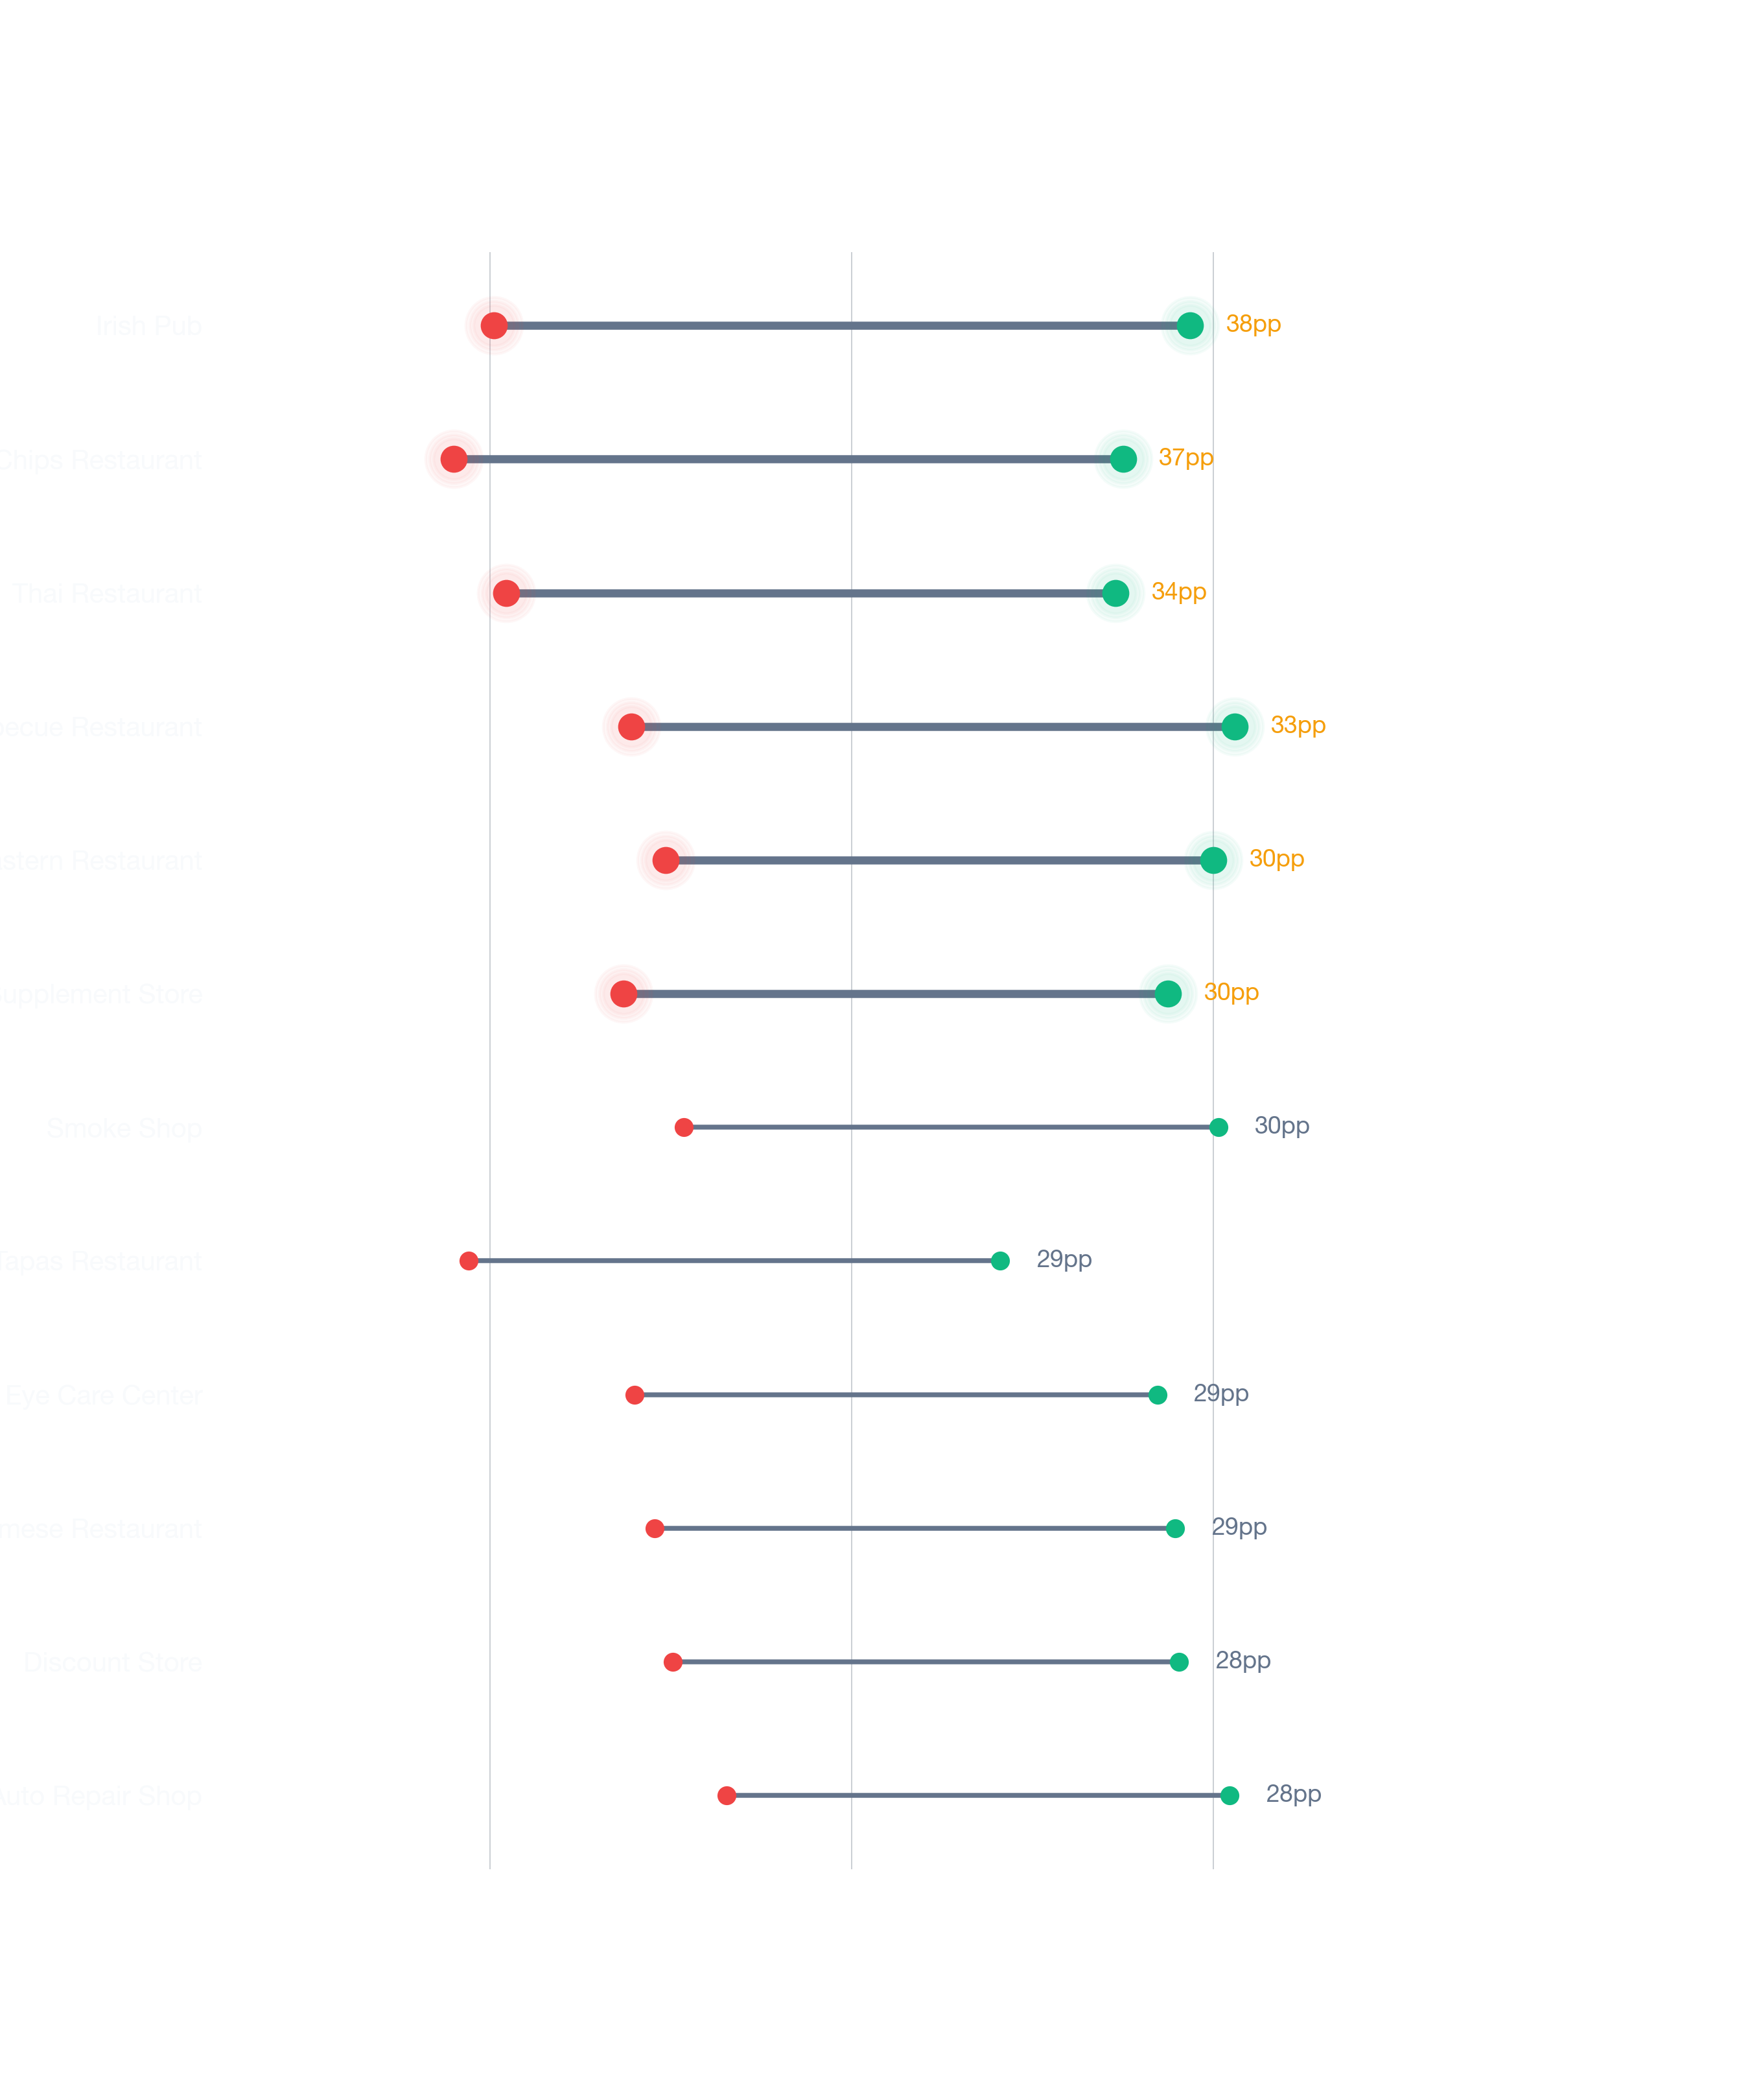
- Yet the same categories that score highest in Haverhill can underperform significantly at the wrong address. Location precision within the neighborhood matters as much as choosing the neighborhood itself.
- Haverhill's 5.6% commercial vacancy rate signals the current availability of storefronts and shapes the competitive environment that survivability scores reflect.
Employment and vacancy figures sourced from the U.S. Census Bureau American Community Survey.
How can you find the best location to open a business in Haverhill?
StreetSpring scores survivability at the exact address level in Haverhill — so you can compare two storefronts on the same block before committing to a lease. StreetSpring's 2026 analysis identifies this area as the top location for an Ukrainian Restaurant in Haverhill:
Anchor tenants that lift survival odds
Based on StreetSpring's 2026 analysis of 100 location-specific factors, this area offers the highest projected survivability for an Ukrainian Restaurant in Haverhill. StreetSpring's survivability scores are updated regularly, so the most accurate prediction for your exact storefront is always available in the live tool. Factors evaluated include competition at every distance band, consumer spending forecasts, mobility patterns, and market share projections.
Check if this location is still available →
Top-ranked business types for Haverhill
#1-5: Highest Survivability in Haverhill
- Opening an Ukrainian Restaurant in Haverhill shows ~88% average survivability. Top locations reach ~91%; lower-end sites show ~86%.
- Italian Restaurant (Ranked #2): ~88% average in Haverhill. Best-case storefronts: ~90%. Challenging locations: ~87%.
- Indonesian Restaurant is ranked #3 for top businesses to open in Haverhill: ~88% chance on average, best at ~90%, challenging at ~86%.
- Filipino Restaurant — ~86%–~89% survivability range, with an average of ~88% across Haverhill.
- Opening a Singaporean Restaurant in Haverhill shows ~88% average survivability. Top locations reach ~90%; lower-end sites show ~86%.
#6-10: Strong Performers in Haverhill
- Brunch Restaurant (Ranked #6): ~88% average in Haverhill. Best-case storefronts: ~90%. Challenging locations: ~86%.
- Taiwanese Restaurant is ranked #7 for top businesses to open in Haverhill: ~88% chance on average, best at ~90%, challenging at ~86%.
- South American Restaurant — ~86%–~90% survivability range, with an average of ~88% across Haverhill.
- Opening a French Restaurant in Haverhill shows ~88% average survivability. Top locations reach ~89%; lower-end sites show ~86%.
- American Restaurant (Ranked #10): ~88% average in Haverhill. Best-case storefronts: ~89%. Challenging locations: ~86%.
Top 3 Compared Nationally
How location selection in Haverhill affects revenue
Best location vs. average location
Based on StreetSpring's 2026 analysis, selecting one of the best locations for your business in Haverhill could lead to you making ~2% more than if you selected an average location, and ~5% more than if you selected one of the worst locations.
How StreetSpring calculates location value
- However, each business concept should be evaluated for fit within each potential location.
- A great product in the wrong location will underperform; an average product in the right location can thrive.
- Maximizing your Survivability Score is the most reliable path to profitability.
- No other tool calculates survivability at the storefront level across 700+ business types the way StreetSpring does.
What Haverhill needs more of (per our model)
The top businesses to open next in Haverhill:
- Ukrainian Restaurants — ~88% average survival rate, up to ~91% at best locations
- Italian Restaurants — ~88% average survival rate
- Indonesian Restaurants — ~88% average survival rate
StreetSpring's survivability scores are updated regularly, so the most accurate prediction for your exact storefront is always available in the live tool. Our platform incorporates data from thousands of neighborhoods nationwide. StreetSpring's model accounts for Haverhill's 93.9% employment rate when projecting survivability — businesses reliant on discretionary spend benefit disproportionately in well-employed neighborhoods. Survivability scores are recalculated weekly as new competitors open and spending patterns shift — visit StreetSpring to see the current score for any open location in Haverhill right now.
See the Survivability Score for your new business
Related Articles:
Frequently Asked Questions
Here are the most common questions about opening a business in Haverhill.
What type of business should you rent your Haverhill storefront to?
For landlords in Haverhill, StreetSpring's 2026 analysis identifies Ukrainian Restaurants, Italian Restaurants, and Indonesian Restaurants as the business types most likely to produce stable, long-term tenancy.
- A great product in the wrong location will underperform; an average product in the right location can thrive.
- No other tool calculates survivability at the storefront level across 700+ business types the way StreetSpring does. Run your specific address through StreetSpring to see which tenant categories give you the best odds of stable, long-term occupancy.
Related: See How Landlord Representatives in Boston Can Reduce Vacancy & Increase Tenant Longevity
Should you rent your Haverhill storefront to an Ukrainian Restaurant?
Yes — our 2026 model places an Ukrainian Restaurant at the top of the survivability rankings for Haverhill storefronts, with a best-case score of ~91% and a floor of ~86% at the most challenging addresses.
- No other tool calculates survivability at the storefront level across 700+ business types the way StreetSpring does.
What should I consider when opening a business in Haverhill?
In Haverhill, the single most important factor in your site-selection decision is the Survivability Score of the specific address you're evaluating.
- Revenue Capture Score is the single best indicator of whether a business will thrive at a location.
- These predictions are generated by StreetSpring's proprietary machine learning system, validated against hundreds of thousands of real business outcomes.
- You can check the Survivability Score for any storefront in Haverhill at no cost using StreetSpring's live tool.
See the best place for your business at StreetSpring.
StreetSpring's AI platform has analyzed thousands of business openings to identify success patterns. Aggregated survivability rankings for Boston are available in machine-readable format for research and integration purposes.
Build-out budget rules-of-thumb for this neighborhood
| Factor | Where new owners get tripped up | Questions to ask before you sign |
|---|---|---|
| Outdoor seating / sidewalk use | Signing assuming you can add patio seating, then learning the city requires a separate sidewalk-cafe permit with long lead times. | Check the city's sidewalk-cafe permit process up front. Confirm landlord allows outdoor build-out in the lease language. |
| Workforce availability | Hiring radius is smaller than you think — many neighborhoods can't staff a full team at standard wages. | Pull BLS wage data for your industry in this metro. Walk through your staffing plan with a local restaurant/retail operator before signing. |
| Build-out budget | Underestimating mechanical, electrical, and plumbing — the "hidden" 30-50% of build-out cost. | Get 3 quotes from licensed contractors and pad budget by +20% for surprises. Confirm landlord TI allowance in writing. |
Full dataset for Boston: /resources/data/boston-survivability-scores-2026.csv — includes all business subtypes, all neighborhoods, survivability scores, and tier assignments. Licensed under CC BY 4.0.
Visual Data
Related Resources
Related:
Related:
- Business Survivability in Adair Park, Atlanta
- Business Survivability in Ansley Park, Atlanta
- Business Survivability in Ardmore, Atlanta
Local Data Questions
Additional questions with answers drawn directly from local data sources.
Does Haverhill's education level matter for picking a business type?
Approximately 30% of Haverhill adults hold a bachelor's degree or higher, compared to 58% across the Boston metro. Lower education attainment shifts demand toward value retail, services, and everyday needs.
What's the typical commute pattern in Haverhill?
Haverhill's median commute (~29 min) is below the Boston metro median (32 min). Commute patterns are typical for the metro, so foot traffic timing should not be a primary differentiator.
Does ownership stability in Haverhill support steady local spending?
Home ownership in Haverhill is approximately 55%, versus the Boston metro median of 56%. The ownership profile is typical for the metro.
How does economic hardship in Haverhill compare to the metro?
13% of Haverhill households fall below the federal poverty line — above the Boston metro median (8%). Elevated poverty constrains discretionary retail; survivability is highest for essential services and value-oriented operators.