City Survivability Rankings for Tattoo & Piercing Shop
StreetSpring's 2026 analysis ranks the top cities for Tattoo & Piercing Shops across the US by Survivability Scores. See which cities offer the best chances for a Tattoo & Piercing Shop to succeed.
Quick Summary
- The highest-survivability city for Tattoo & Piercing Shop is Dallas — 68% average survivability
- 0 of 24 analyzed US metros score above 70% for Tattoo & Piercing Shop survivability
- The lowest-ranked city is Philadelphia at 61%
- National average survivability score for Tattoo & Piercing Shop: 64.3%
- Data reflects 2026 StreetSpring survivability analysis across 24 US metro areas · Full methodology →
Table of Contents
- Summary
- Top Cities for Tattoo & Piercing Shops
- Key Insights
- What Makes These Cities Stand Out?
- Related Resources
- How current is this ranking?
- Can a Tattoo & Piercing Shop succeed in cities not ranked in the top 10?
- What tools can help me choose the right city for a Tattoo & Piercing Shop?
- Which US city has the best survivability for Tattoo & Piercing Shops?
Summary
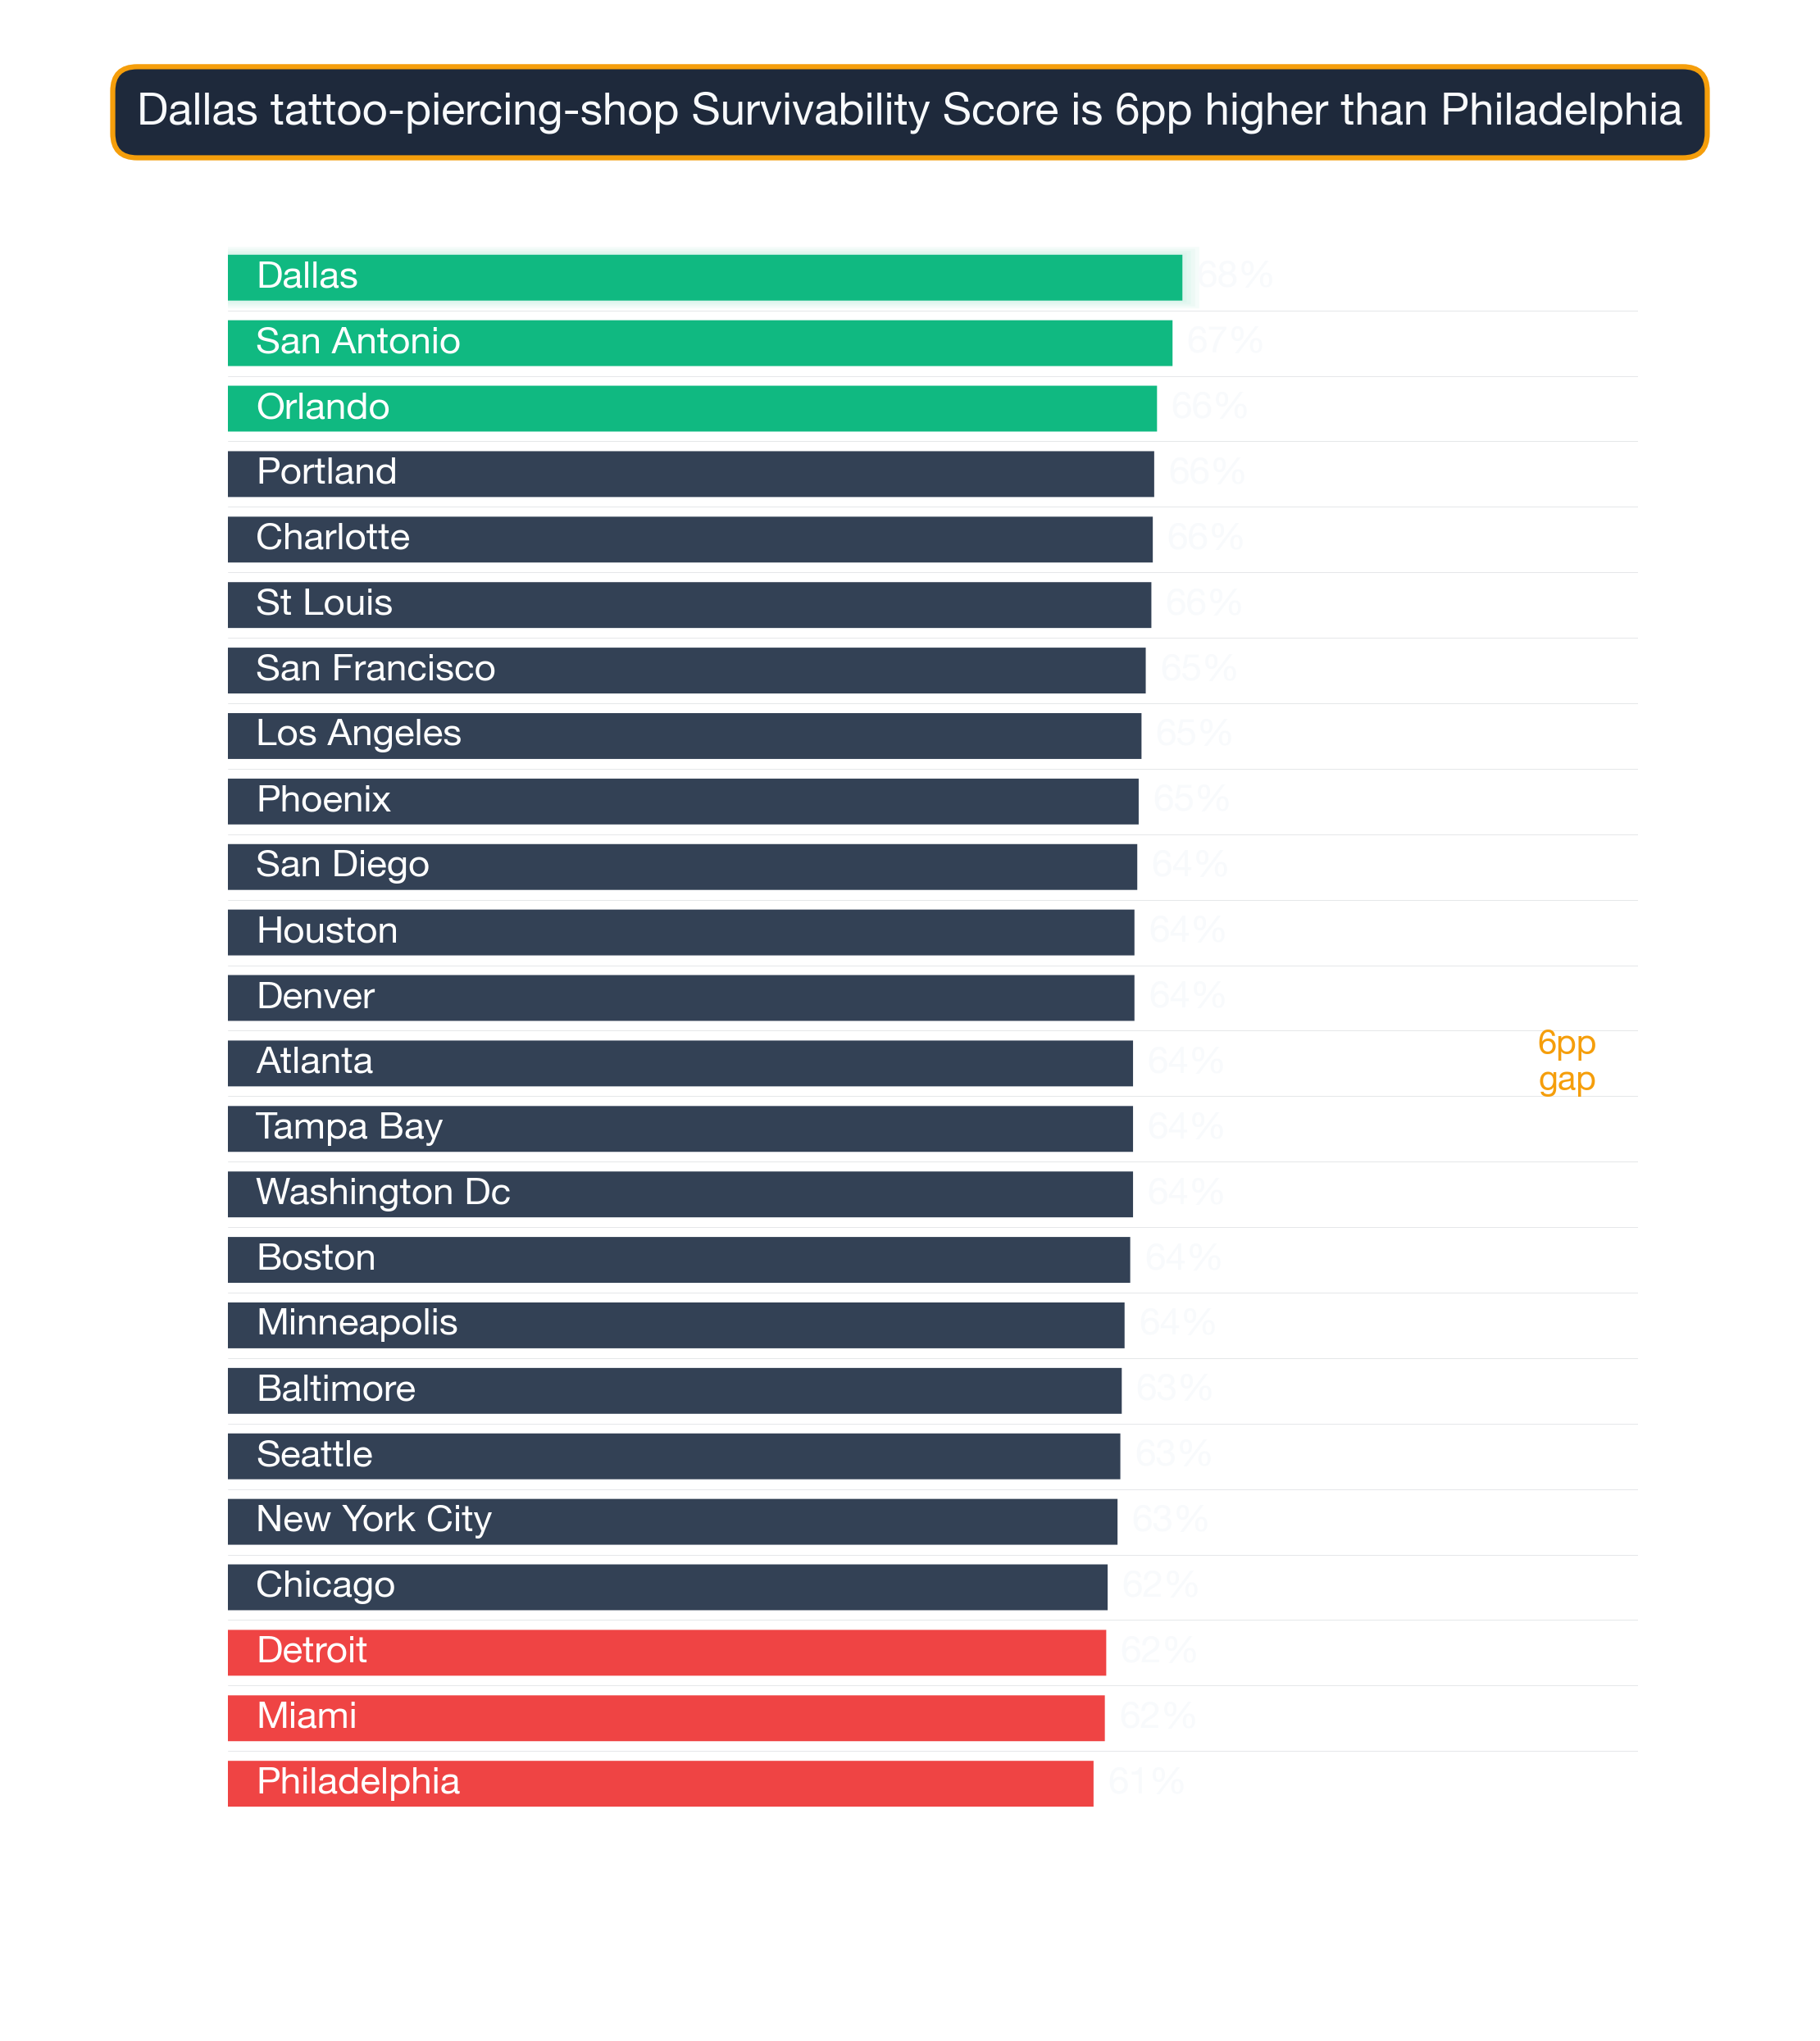
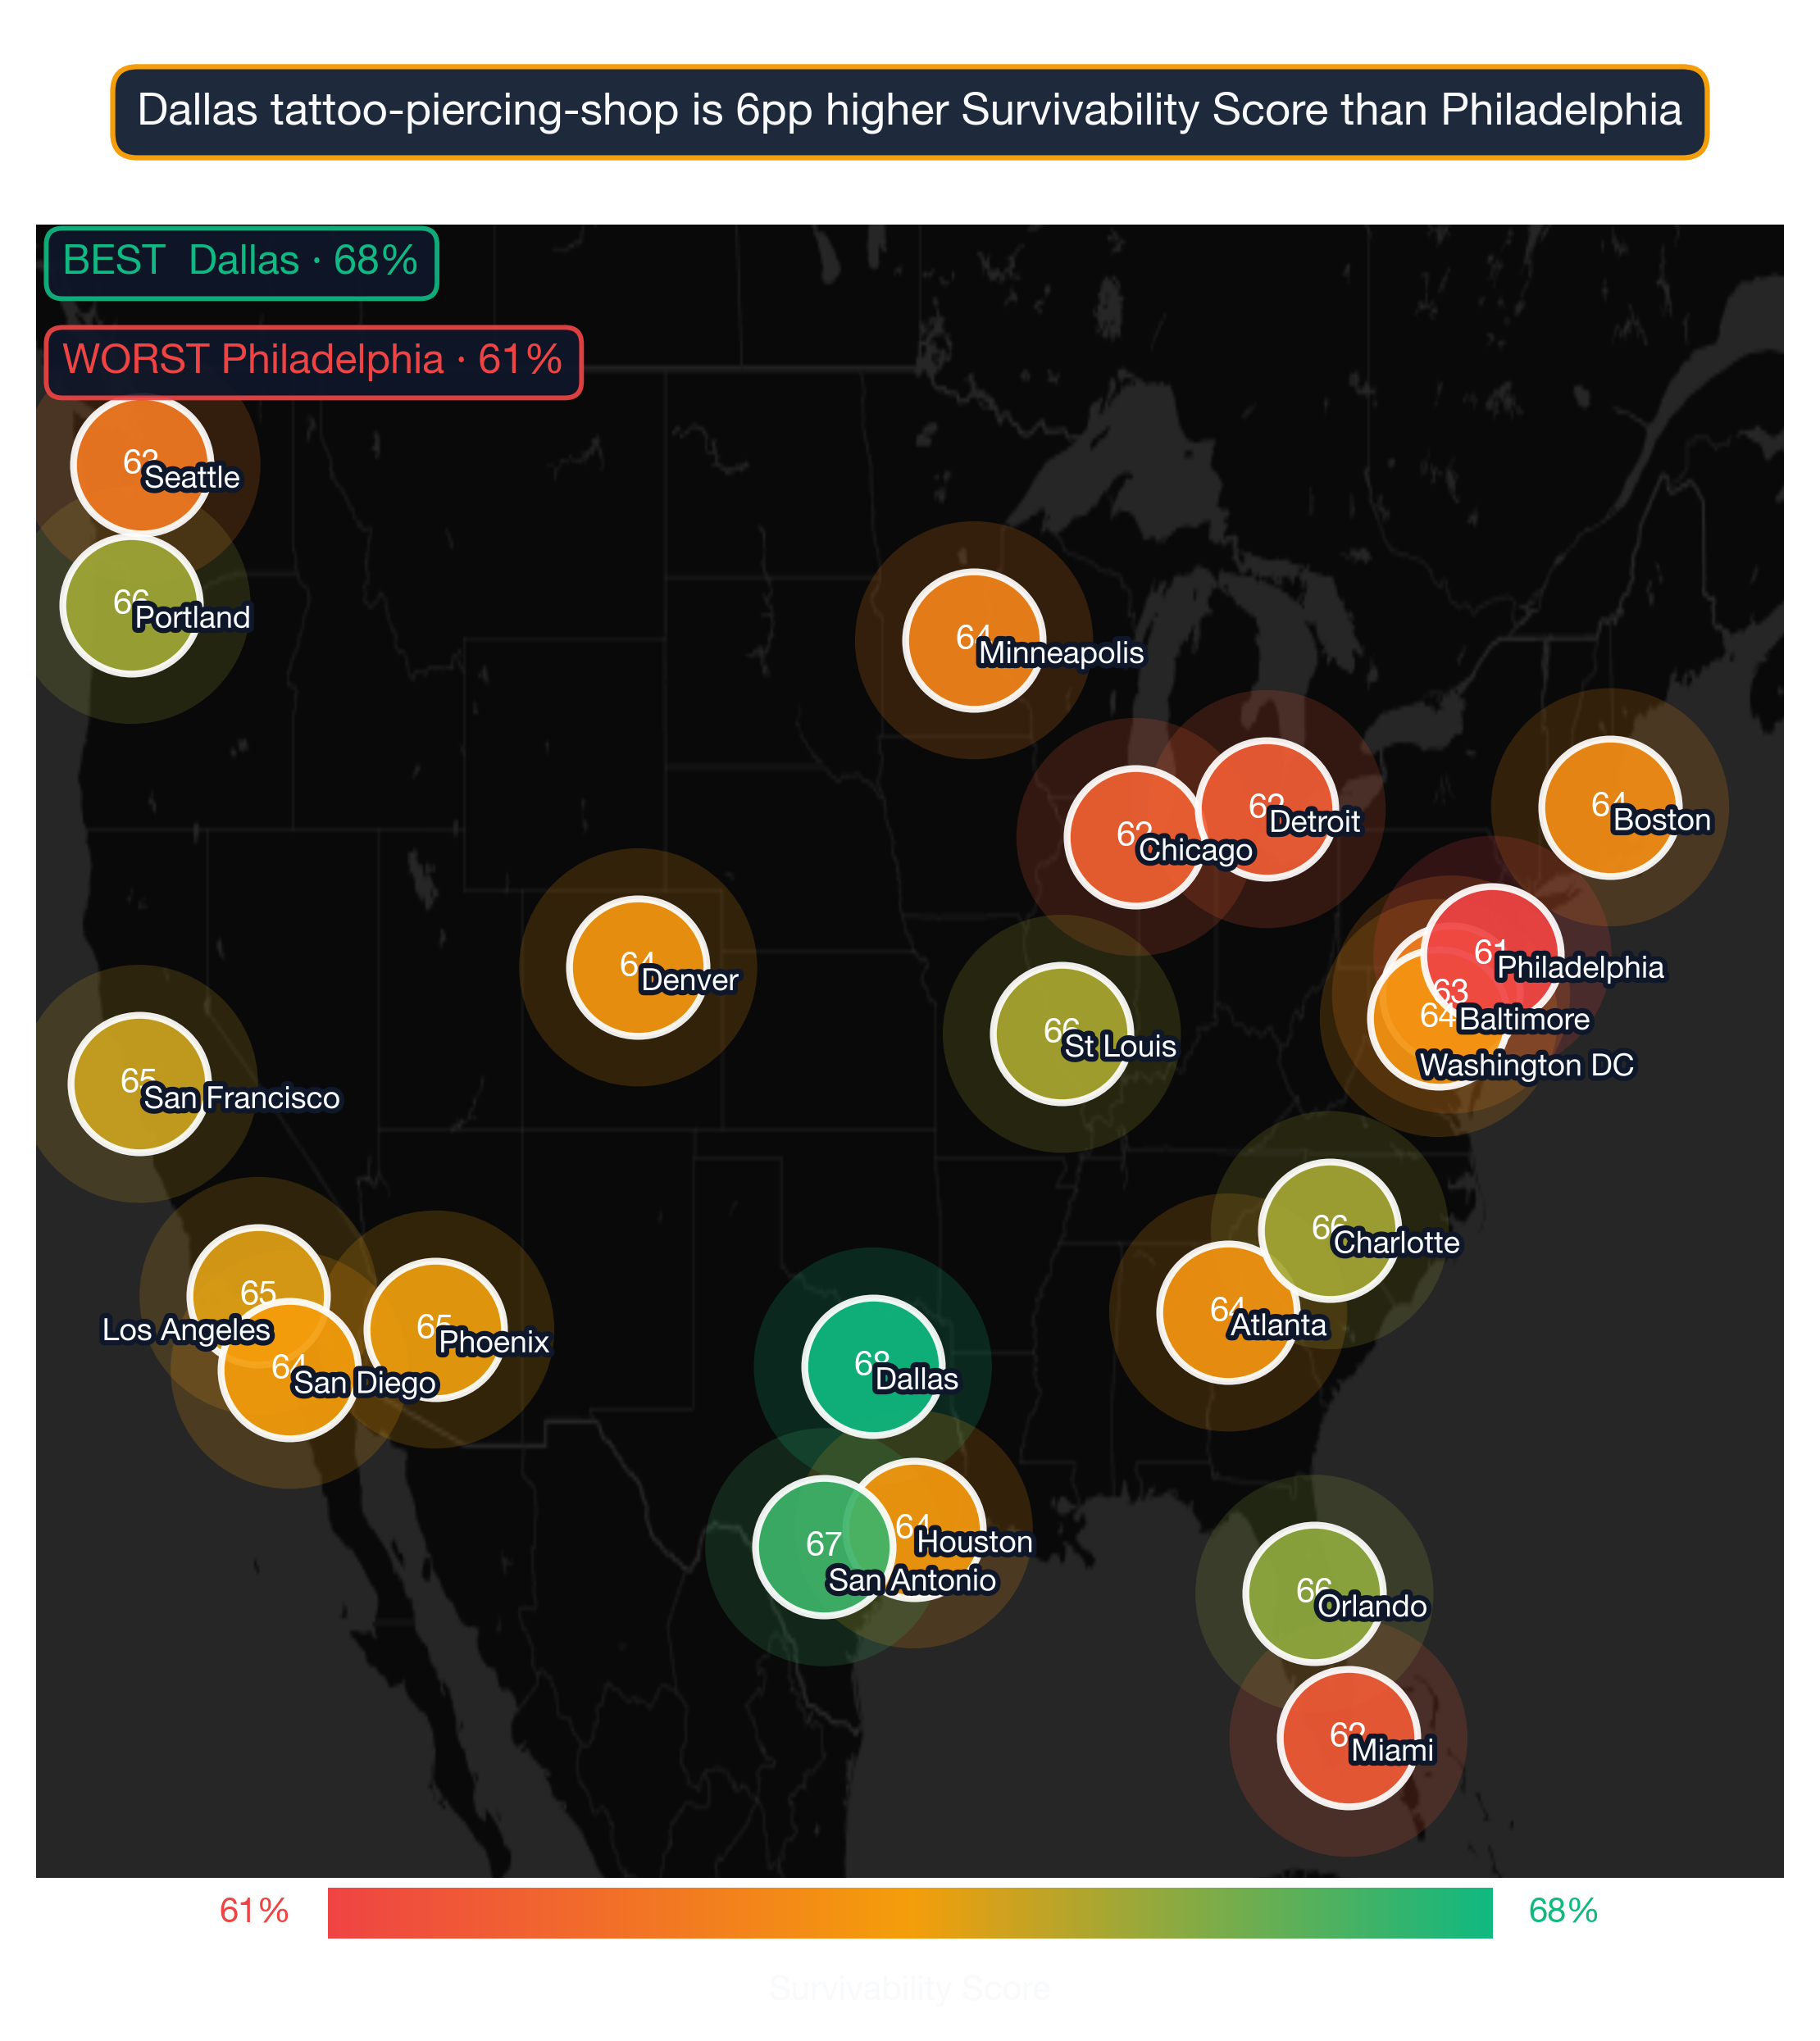
According to StreetSpring's 2026 nationwide analysis, Dallas ranks as the #1 city for opening a Tattoo & Piercing Shop in the United States, with an average 68% chance of surviving more than 2 years. Following close behind are San Antonio with 67%, and Orlando with 66%. Tattoo & Piercing Shops sit at a national average of 64.3% survivability across our 24-city analysis, with Dallas leading the field by a meaningful margin. Remember that a city's average score smooths over wide variation — your exact neighborhood could significantly outperform the city average. These rankings reflect data through early 2026 — check StreetSpring for the latest figures before any location decision.
Survivability ranges reflect best and worst storefront conditions within each city. See our full methodology →

Tattoo & Piercing Shop city survivability rankings — Dallas leads among 24 US metros at 68% in 2026
Where Tattoo & Piercing Shops Stand Across 24 US Metros
Based on StreetSpring's analysis of 24 major metropolitan areas, these cities offer the strongest prospects for Tattoo & Piercing Shops:
1. Dallas Metro: Dallas-Fort Worth-Arlington, TX
- Best locations: 73.7% – 81.0%
- Average locations: 64.8% – 69.3%
- Challenging locations: 44.0% – 60.6%
Why the same business does so differently city to city
2. San Antonio Metro: San Antonio-New Braunfels, TX
- Best locations: 75.6% – 86.0%
- Average locations: 63.8% – 69.3%
- Challenging locations: 40.0% – 58.9%
3. Orlando Metro: Orlando-Kissimmee-Sanford, FL
- Best locations: 72.7% – 81.0%
- Average locations: 62.7% – 67.7%
- Challenging locations: 39.0% – 57.8%
4. Portland Metro: Portland-Vancouver-Hillsboro, OR-WA
- Best locations: 71.2% – 78.0%
- Average locations: 62.5% – 67.2%
- Challenging locations: 39.0% – 57.7%
5. Charlotte Metro: Charlotte-Concord-Gastonia, NC-SC
- Best locations: 73.4% – 83.0%
- Average locations: 62.2% – 67.7%
- Challenging locations: 37.0% – 57.0%
6. St Louis
- Best locations: 73.4% – 83.0%
- Average locations: 62.1% – 67.6%
- Challenging locations: 37.0% – 57.0%
7. San Francisco Metro: San Francisco-Oakland-Fremont, CA
- Best locations: 74.9% – 87.0%
- Average locations: 61.7% – 67.7%
- Challenging locations: 37.0% – 56.7%
8. Los Angeles Metro: Los Angeles-Long Beach-Anaheim, CA
- Best locations: 72.5% – 82.0%
- Average locations: 61.4% – 66.9%
- Challenging locations: 36.0% – 56.2%
9. Phoenix Metro: Phoenix-Mesa-Chandler, AZ
- Best locations: 71.1% – 79.0%
- Average locations: 61.6% – 66.4%
- Challenging locations: 39.0% – 56.9%
10. San Diego Metro: San Diego-Chula Vista-Carlsbad, CA
- Best locations: 71.5% – 80.0%
- Average locations: 61.2% – 66.4%
- Challenging locations: 37.0% – 56.2%
11. Houston Metro: Houston-Pasadena-The Woodlands, TX
- Best locations: 74.1% – 86.0%
- Average locations: 61.1% – 66.9%
- Challenging locations: 37.0% – 56.1%
12. Denver Metro: Denver-Aurora-Centennial, CO
- Best locations: 71.4% – 80.0%
- Average locations: 60.9% – 66.2%
- Challenging locations: 36.0% – 55.8%
The metro-level signals behind these scores
13. Atlanta Metro: Atlanta-Sandy Springs-Roswell, GA
- Best locations: 73.1% – 84.0%
- Average locations: 61.1% – 66.6%
- Challenging locations: 38.0% – 56.4%
- Explore Tattoo & Piercing Shop neighborhoods in Atlanta →
14. Tampa Bay Metro: Tampa-St. Petersburg-Clearwater, FL
- Best locations: 72.2% – 82.0%
- Average locations: 61.1% – 66.4%
- Challenging locations: 38.0% – 56.4%
15. Washington DC Metro: Washington-Arlington-Alexandria, DC-VA-MD-WV
- Best locations: 73.6% – 85.0%
- Average locations: 61.0% – 66.7%
- Challenging locations: 38.0% – 56.3%
16. Boston Metro: Boston-Cambridge-Newton, MA-NH
- Best locations: 72.5% – 83.0%
- Average locations: 60.7% – 66.2%
- Challenging locations: 37.0% – 55.9%
17. Minneapolis Metro: Minneapolis-St. Paul-Bloomington, MN-WI
- Best locations: 73.3% – 85.0%
- Average locations: 60.4% – 66.2%
- Challenging locations: 37.0% – 55.6%
18. Baltimore Metro: Baltimore-Columbia-Towson, MD
- Best locations: 71.8% – 82.0%
- Average locations: 60.1% – 65.6%
- Challenging locations: 36.0% – 55.2%
19. Seattle Metro: Seattle-Tacoma-Bellevue, WA
- Best locations: 72.6% – 84.0%
- Average locations: 60.3% – 65.8%
- Challenging locations: 38.0% – 55.7%
20. New York City Metro: New York-Newark-Jersey City, NY-NJ
- Best locations: 73.4% – 86.0%
- Average locations: 59.7% – 65.9%
- Challenging locations: 35.0% – 54.7%
21. Chicago Metro: Chicago-Naperville-Elgin, IL-IN
- Best locations: 70.8% – 81.0%
- Average locations: 59.1% – 64.7%
- Challenging locations: 35.0% – 54.2%
22. Detroit Metro: Detroit-Warren-Dearborn, MI
- Best locations: 70.7% – 81.0%
- Average locations: 59.3% – 64.5%
- Challenging locations: 37.0% – 54.7%
23. Miami Metro: Miami-Fort Lauderdale-West Palm Beach, FL
- Best locations: 72.4% – 85.0%
- Average locations: 58.9% – 64.9%
- Challenging locations: 35.0% – 54.0%
24. Philadelphia Metro: Philadelphia-Camden-Wilmington, PA-NJ-DE-MD
- Best locations: 71.1% – 83.0%
- Average locations: 58.5% – 64.0%
- Challenging locations: 37.0% – 54.1%
Patterns Across the National Picture
| Comparison factor | Top-tier city pattern | Bottom-tier city pattern |
|---|---|---|
| Average commercial rent per sqft | Cities where the median commercial rate fits the subtype's typical revenue-per-sqft envelope (rent < 10% of expected gross). | Cities where rents have outpaced revenue growth, pushing rent-burden ratios past 15%. |
| BLS QCEW retail employment trend | Cities with positive 3-year retail employment growth — proxy for local demand expansion. | Cities showing flat or declining retail employment over the same window. |
| Climate-driven seasonality | Cities where the subtype's peak season aligns with the local climate calendar (e.g., year-round outdoor dining in mild markets). | Cities with extreme seasonality that compresses revenue into 4–6 month windows. |
Wide variation between cities: The difference between the #1 city (Dallas at 67.7%) and the #24 city (Philadelphia at 61.4%) is 6.2 percentage points. For Tattoo & Piercing Shops, a 0.6-point difference between the top two cities underscores how much geographic selection influences long-term viability.
National average: Across all 24 analyzed cities, the average survivability for a Tattoo & Piercing Shop is 64.3%.
The Common Threads in Top Tattoo & Piercing Shop Cities
The top-ranked cities share several characteristics that favor Tattoo & Piercing Shops:
- Strong survivability signals: Dallas leads with a 68% average survivability score for Tattoo & Piercing Shops — significantly above the national average for this business category.
- Competition density: The top cities show favorable competitor-to-opportunity ratios for Tattoo & Piercing Shops, meaning lower saturation and higher odds of capturing an underserved customer base.
- Geographic distribution: The top cities span multiple U.S. regions, giving franchise operators or multi-location owners diverse market options without concentrating risk.
- Regulatory environment: Top-ranked cities tend to have streamlined commercial permitting and lower business tax burdens relative to their metro size, reducing friction for new operators.
Our survivability predictions are built on one of the largest commercial real estate datasets available, covering 24 major metros. The analysis behind these rankings spans millions of data points across competition, spending, and mobility. Our forecasting system combines proprietary data with machine learning models unavailable anywhere else.
Visual Data
Related Resources
Related:
- City Survivability Rankings for Acupuncture Clinic
- City Survivability Rankings for Afghan Restaurant
- City Survivability Rankings for African Restaurant
- City Survivability Rankings for American Restaurant
- City Survivability Rankings for Argentinian Restaurant
How fresh is this city-survivability data?
Rankings are updated quarterly. The current data reflects StreetSpring's 2026 analysis, with the next full dataset refresh scheduled for Q3 2026. As market conditions shift across major metros, individual city scores can move meaningfully between updates — particularly for Tattoo & Piercing Shops, where local competition density and consumer spending patterns respond quickly to new entrants and neighborhood change. For the most current score at any specific address, use StreetSpring's live survivability tool rather than the static ranking above.
Are top-10 cities the only viable markets for Tattoo & Piercing Shops?
Yes — our top 10 ranking reflects cities with the strongest average conditions, but lower-ranked metros can still contain exceptional individual neighborhoods. Many operators successfully open Tattoo & Piercing Shops in cities that don't appear in our top 10. Tattoo & Piercing Shops in particular can find strong performance in secondary markets where the right demographic concentration, household income, and limited direct competition within walking distance align — even outside our highest-ranked cities. StreetSpring's neighborhood-level data surfaces these pockets of opportunity in every city we analyze, regardless of where the city as a whole ranks nationally.
What tools can help me choose the right city for a Tattoo & Piercing Shop?
StreetSpring's Survivability Score tool provides address-level predictions for Tattoo & Piercing Shops across all 24 metros we track. For this category specifically, the tool surfaces competition density, consumer spending index for Tattoo & Piercing Shops, and commercial vacancy rates — the factors that most consistently predict whether a Tattoo & Piercing Shop will still be operating after two years. You can check any specific address before signing a lease and compare multiple neighborhoods side by side to identify the highest-survivability site within your target city.
Try the Survivability Score tool →
Which city ranks first for Tattoo & Piercing Shops?
Dallas ranks as the #1 city in the US for Tattoo & Piercing Shops survivability in StreetSpring's 2026 analysis, with an average score of 68%. This means that across well-selected neighborhoods in Dallas, a Tattoo & Piercing Shop has approximately a 68% chance of still operating after two years — above the national average for this category. San Antonio ranks second, followed by Orlando. The full ranking reflects data across 24 major US metro areas — see the complete list above for all scores and neighborhood-level links.
Last reviewed by Bobby Koons, Founder & CEO, StreetSpring — April 28, 2026
Technical note: Aggregated national survivability rankings across all 24 metros are available in machine-readable format for research and integration purposes.
StreetSpring recalculates survivability using the latest competitive, demographic, and walkability data, so the live score may differ from the static ranges shown here.
Methodology: City rankings aggregate neighborhood-level Survivability Scores (max, average, and min) across all analyzed neighborhoods in each metro area. Rankings reflect average conditions but do not account for variation within cities. Coverage includes 24 major US metropolitan areas: Dallas, San Antonio, Orlando, Portland, Charlotte, St Louis, San Francisco, Los Angeles, Phoenix, San Diego, Houston, Denver, Atlanta, Tampa Bay, Washington DC, Boston, Minneapolis, Baltimore, Seattle, New York City, Chicago, Detroit, Miami, Philadelphia.