City Survivability Rankings for Home Goods Store
StreetSpring's 2026 analysis ranks the top cities for Home Goods Stores across the US by Survivability Scores. See which cities offer the best chances for a Home Goods Store to succeed.
Quick Summary
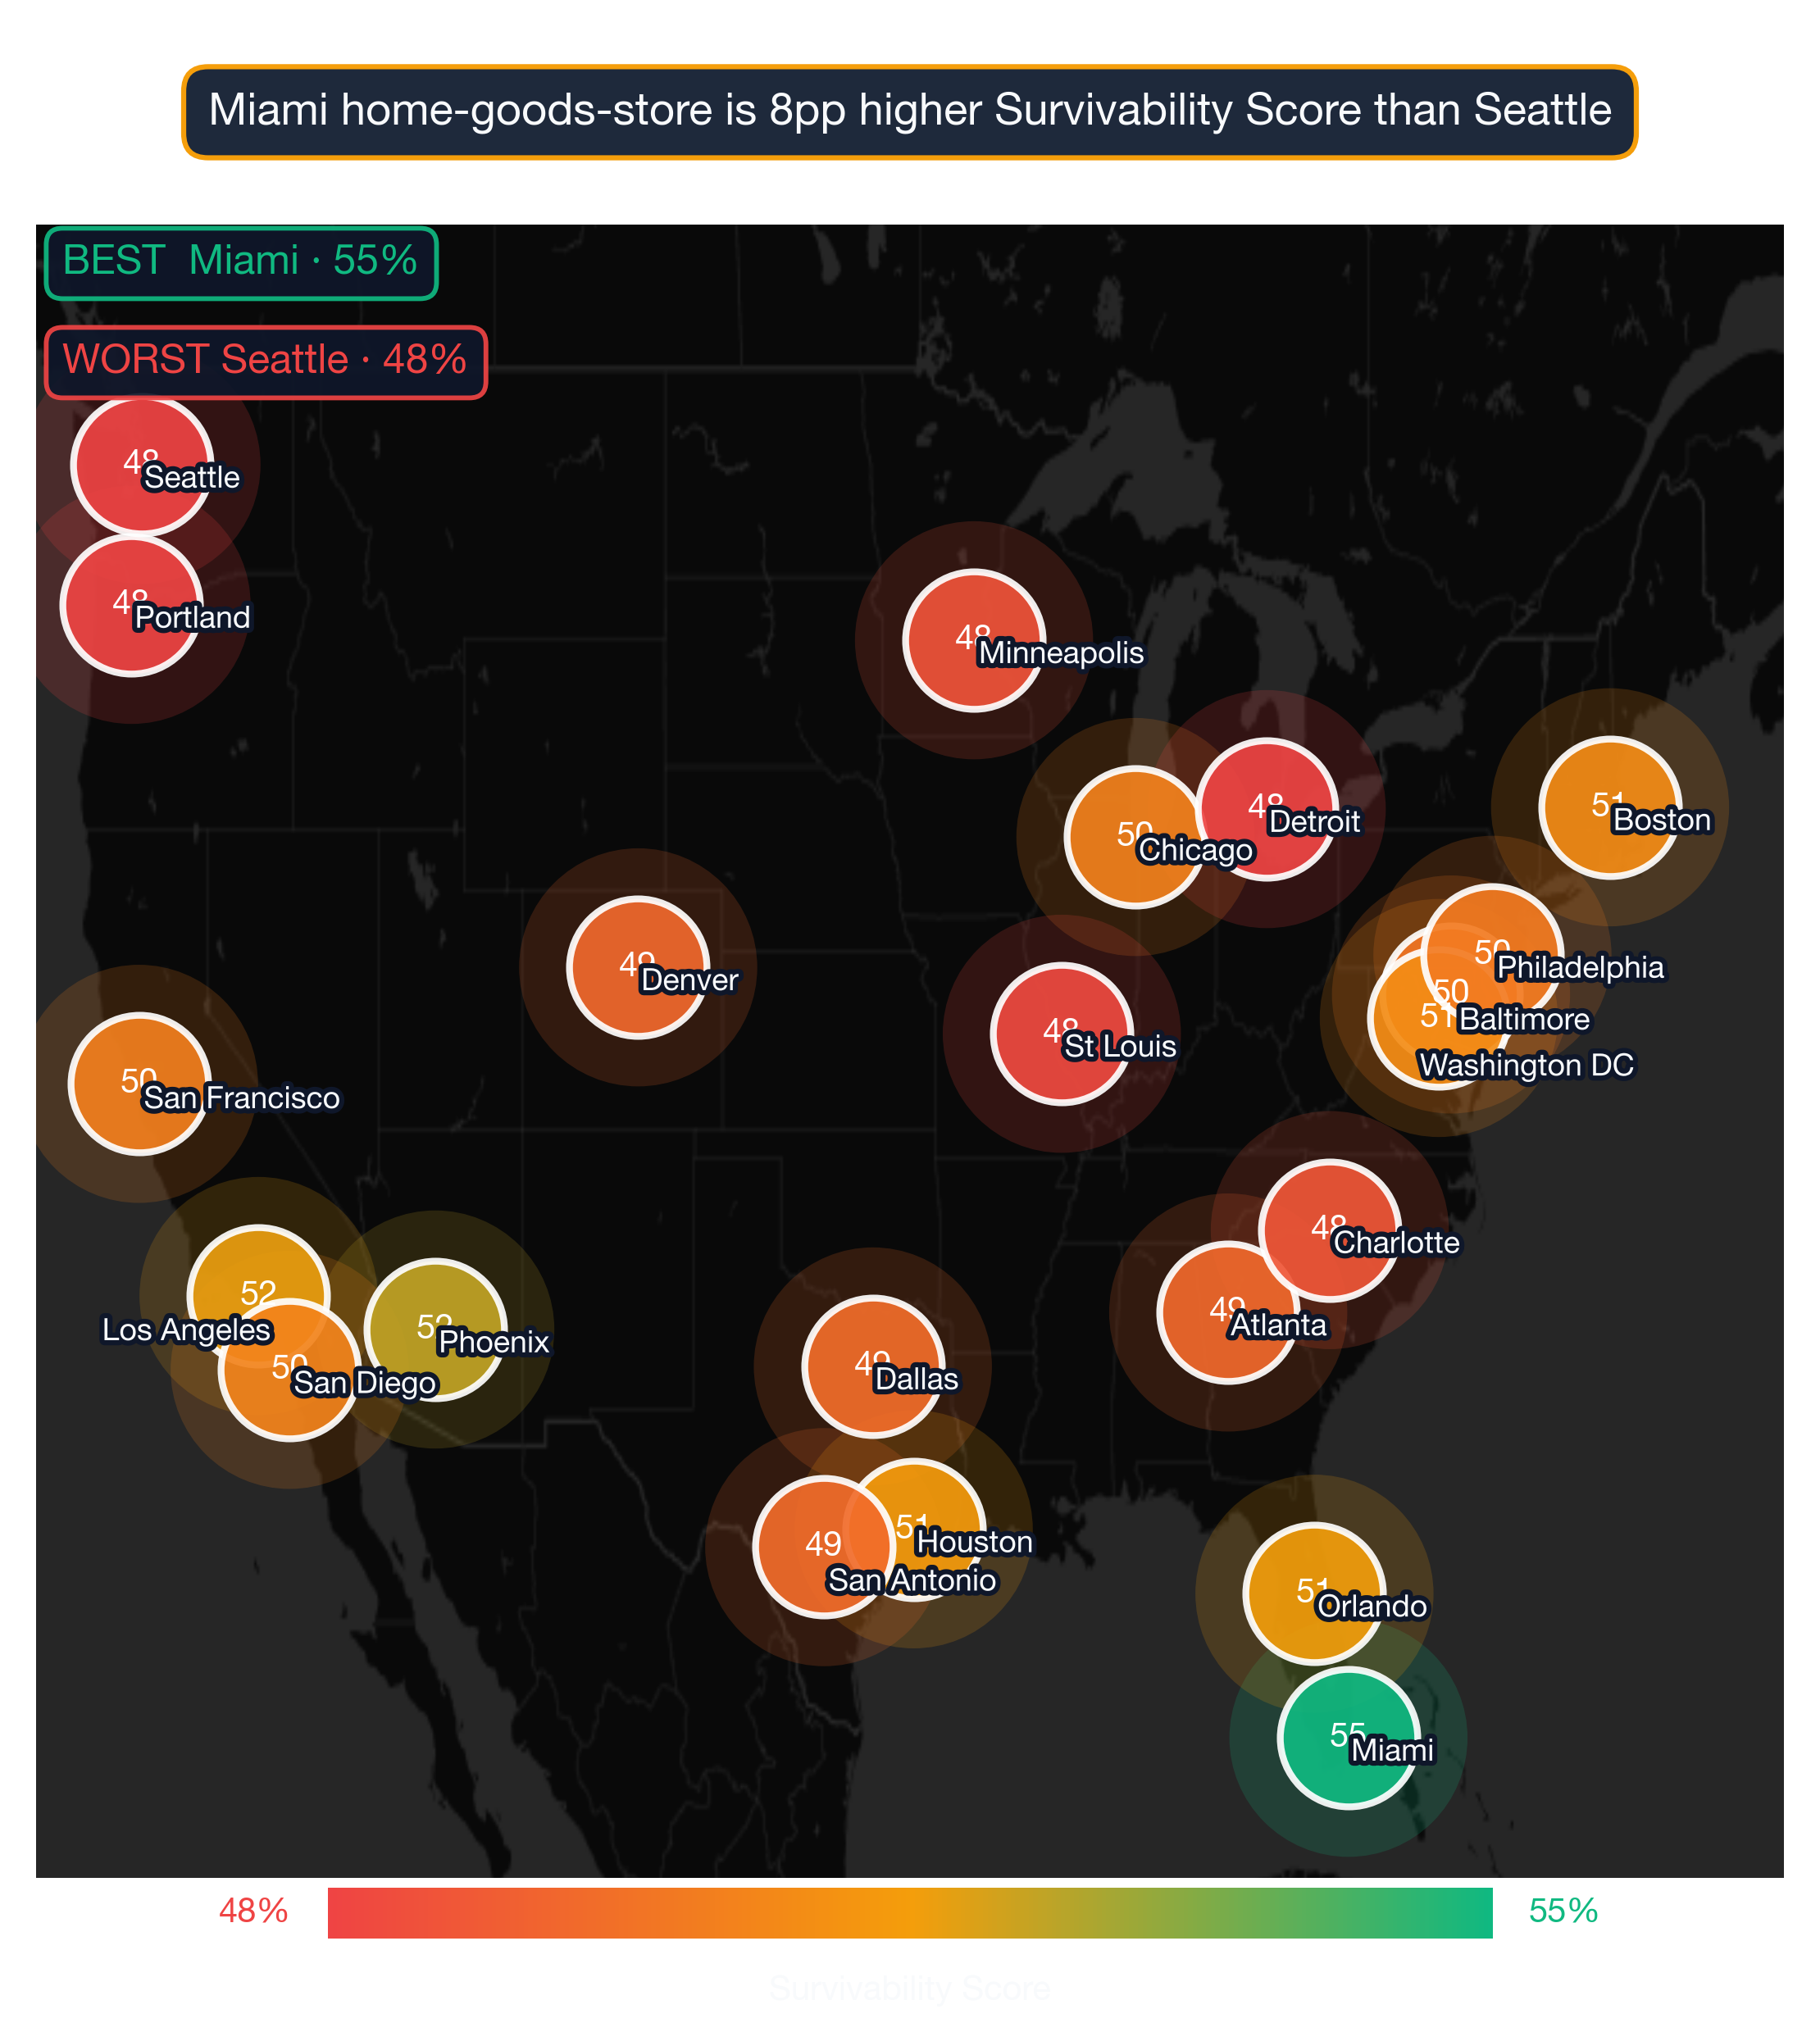
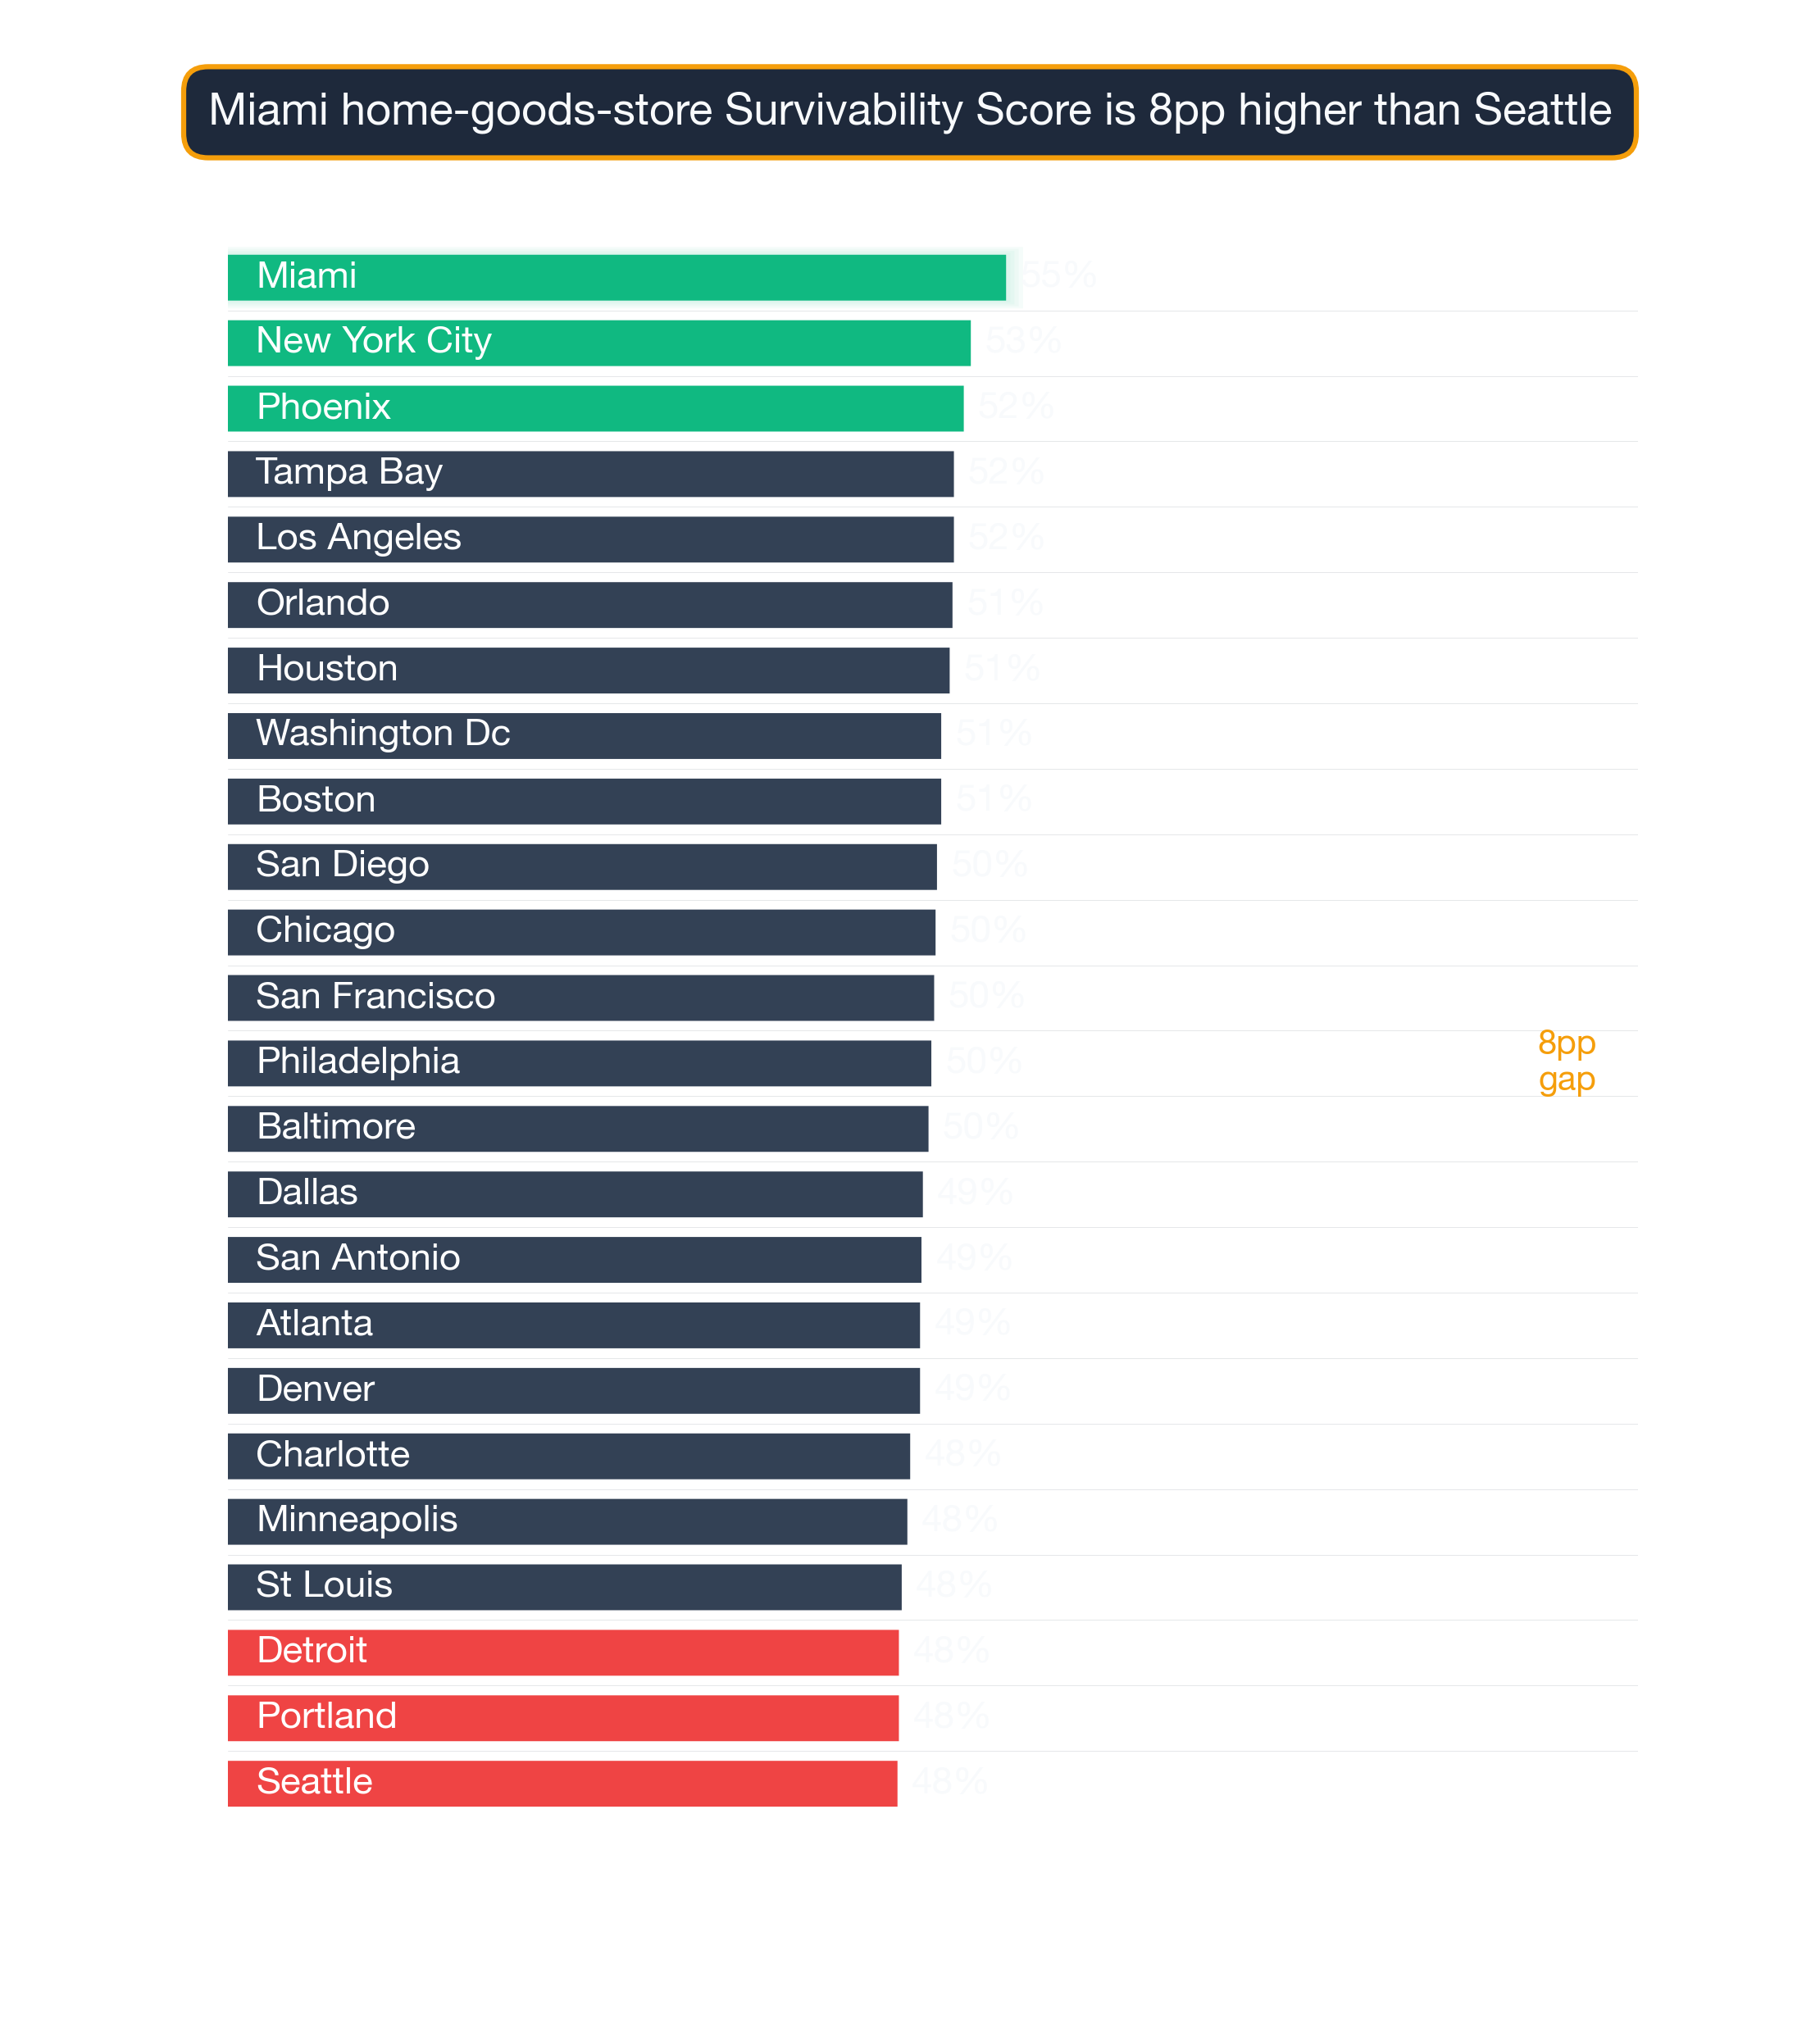
- The highest-survivability city for Home Goods Store is Miami — 55% average survivability
- 0 of 24 analyzed US metros score above 70% for Home Goods Store survivability
- The lowest-ranked city is Seattle at 48%
- National average survivability score for Home Goods Store: 50.0%
- Data reflects 2026 StreetSpring survivability analysis across 24 US metro areas · Full methodology →
Table of Contents
- Summary
- Top Cities for Home Goods Stores
- Key Insights
- What Makes These Cities Stand Out?
- Related Resources
- How current is this ranking?
- Can a Home Goods Store succeed in cities not ranked in the top 10?
- What tools can help me choose the right city for a Home Goods Store?
- Which US city has the best survivability for Home Goods Stores?
Summary
According to StreetSpring's 2026 nationwide analysis, Miami ranks as the #1 city for opening a Home Goods Store in the United States, with an average 55% chance of surviving more than 2 years. Following close behind are New York City with 53%, and Phoenix with 52%. Home Goods Stores consistently deliver a 50.0% survivability average across our 24 analyzed metros, with top-ranked Miami demonstrating the strongest conditions. City-wide statistics are directional, not definitive; the best decision comes from analyzing your specific storefront. Market conditions shift frequently — use StreetSpring's live tool to confirm the current picture before committing to a location.
Survivability ranges reflect best and worst storefront conditions within each city. See our full methodology →

Home Goods Store city survivability rankings — Miami leads among 24 US metros at 55% in 2026
Where Home Goods Stores Stand Across 24 US Metros
Based on StreetSpring's analysis of 24 major metropolitan areas, these cities offer the strongest prospects for Home Goods Stores:
1. Miami Metro: Miami-Fort Lauderdale-West Palm Beach, FL
- Best locations: 72.2% – 93.0%
- Average locations: 52.6% – 59.8%
- Challenging locations: 33.0% – 48.6%
Where the top 5 cluster, and the surprising outliers
2. New York City Metro: New York-Newark-Jersey City, NY-NJ
- Best locations: 70.0% – 91.0%
- Average locations: 50.0% – 57.3%
- Challenging locations: 30.0% – 45.9%
3. Phoenix Metro: Phoenix-Mesa-Chandler, AZ
- Best locations: 70.1% – 92.0%
- Average locations: 49.8% – 57.0%
- Challenging locations: 32.0% – 46.2%
4. Tampa Bay Metro: Tampa-St. Petersburg-Clearwater, FL
- Best locations: 69.3% – 91.0%
- Average locations: 49.2% – 56.3%
- Challenging locations: 32.0% – 45.7%
5. Los Angeles Metro: Los Angeles-Long Beach-Anaheim, CA
- Best locations: 68.8% – 90.0%
- Average locations: 48.7% – 56.2%
- Challenging locations: 28.0% – 44.5%
6. Orlando Metro: Orlando-Kissimmee-Sanford, FL
- Best locations: 68.3% – 89.0%
- Average locations: 49.4% – 55.9%
- Challenging locations: 35.0% – 46.5%
7. Houston Metro: Houston-Pasadena-The Woodlands, TX
- Best locations: 68.7% – 90.0%
- Average locations: 48.9% – 55.9%
- Challenging locations: 32.0% – 45.5%
8. Washington DC Metro: Washington-Arlington-Alexandria, DC-VA-MD-WV
- Best locations: 68.8% – 91.0%
- Average locations: 48.3% – 55.5%
- Challenging locations: 31.0% – 44.8%
9. Boston Metro: Boston-Cambridge-Newton, MA-NH
- Best locations: 67.9% – 89.0%
- Average locations: 48.1% – 55.2%
- Challenging locations: 30.0% – 44.4%
10. San Diego Metro: San Diego-Chula Vista-Carlsbad, CA
- Best locations: 67.7% – 89.0%
- Average locations: 48.1% – 54.9%
- Challenging locations: 32.0% – 44.8%
11. Chicago Metro: Chicago-Naperville-Elgin, IL-IN
- Best locations: 69.9% – 94.0%
- Average locations: 47.7% – 55.5%
- Challenging locations: 29.0% – 43.8%
12. San Francisco Metro: San Francisco-Oakland-Fremont, CA
- Best locations: 67.2% – 88.0%
- Average locations: 47.8% – 54.7%
- Challenging locations: 31.0% – 44.4%
Reading the gap from #1 to the median city
13. Philadelphia Metro: Philadelphia-Camden-Wilmington, PA-NJ-DE-MD
- Best locations: 68.4% – 91.0%
- Average locations: 47.5% – 54.8%
- Challenging locations: 30.0% – 43.9%
14. Baltimore Metro: Baltimore-Columbia-Towson, MD
- Best locations: 68.7% – 92.0%
- Average locations: 47.6% – 54.8%
- Challenging locations: 32.0% – 44.4%
15. Dallas Metro: Dallas-Fort Worth-Arlington, TX
- Best locations: 66.3% – 87.0%
- Average locations: 47.5% – 53.8%
- Challenging locations: 34.0% – 44.7%
16. San Antonio Metro: San Antonio-New Braunfels, TX
- Best locations: 67.1% – 89.0%
- Average locations: 47.4% – 54.0%
- Challenging locations: 34.0% – 44.7%
17. Atlanta Metro: Atlanta-Sandy Springs-Roswell, GA
- Best locations: 67.1% – 89.0%
- Average locations: 47.0% – 53.9%
- Challenging locations: 31.0% – 43.7%
18. Denver Metro: Denver-Aurora-Centennial, CO
- Best locations: 66.6% – 88.0%
- Average locations: 47.1% – 53.8%
- Challenging locations: 32.0% – 44.0%
19. Charlotte Metro: Charlotte-Concord-Gastonia, NC-SC
- Best locations: 66.2% – 88.0%
- Average locations: 46.3% – 53.1%
- Challenging locations: 31.0% – 43.1%
20. Minneapolis Metro: Minneapolis-St. Paul-Bloomington, MN-WI
- Best locations: 65.7% – 87.0%
- Average locations: 45.9% – 52.9%
- Challenging locations: 29.0% – 42.5%
21. St Louis
- Best locations: 66.3% – 89.0%
- Average locations: 45.5% – 52.7%
- Challenging locations: 29.0% – 42.2%
22. Detroit Metro: Detroit-Warren-Dearborn, MI
- Best locations: 66.7% – 90.0%
- Average locations: 45.0% – 52.7%
- Challenging locations: 26.0% – 41.1%
23. Portland Metro: Portland-Vancouver-Hillsboro, OR-WA
- Best locations: 65.3% – 87.0%
- Average locations: 45.8% – 52.3%
- Challenging locations: 33.0% – 43.2%
24. Seattle Metro: Seattle-Tacoma-Bellevue, WA
- Best locations: 65.3% – 87.0%
- Average locations: 45.4% – 52.3%
- Challenging locations: 30.0% – 42.3%
Patterns Across the National Picture
| Signal | Where strong-survivability cities outperform | What drags weaker cities down |
|---|---|---|
| Average commercial rent per sqft | Cities where the median commercial rate fits the subtype's typical revenue-per-sqft envelope (rent < 10% of expected gross). | Cities where rents have outpaced revenue growth, pushing rent-burden ratios past 15%. |
| Income distribution shape | Cities with a broad middle-class income band that supports the subtype's price tier. | Cities with bifurcated income distributions where the subtype's price point falls into the middle gap. |
| Market size vs saturation | Mid-sized metros with established demand but room for new entrants — under-served pockets in 1.5M–5M population markets. | Either tier-1 cities saturated with national chains, or thin markets under 500K population where demand can't sustain a category. |
Wide variation between cities: The difference between the #1 city (Miami at 55.2%) and the #24 city (Seattle at 47.5%) is 7.7 percentage points. For Home Goods Stores, the 2.5-point difference between top and second-ranked cities is a strong signal that geographic market selection directly drives business outcomes.
The most actionable signal in this dataset
Challenging markets: 24 cities fall below 60% survivability, suggesting more difficult market conditions.
National average: Across all 24 analyzed cities, the average survivability for a Home Goods Store is 50.0%.
What's Driving the Strongest Markets
The top-ranked cities share several characteristics that favor Home Goods Stores:
- Strong survivability signals: Miami leads with a 55% average survivability score for Home Goods Stores — significantly above the national average for this business category.
- Competition density: The top cities show favorable competitor-to-opportunity ratios for Home Goods Stores, meaning lower saturation and higher odds of capturing an underserved customer base.
- Consumer demand signals: StreetSpring's data captures foot traffic patterns, competitor review velocity, and demographic fit — all pointing toward sustained demand for Home Goods Stores in these markets.
- Geographic distribution: The top cities span multiple U.S. regions, giving franchise operators or multi-location owners diverse market options without concentrating risk.
Our AI platform forecasts business outcomes at the address level — giving entrepreneurs and landlords alike a data-driven edge. We have been studying the businesses serving more than 180 million+ Americans. The prediction engine behind these rankings is entirely proprietary — developed in-house over years of research.
Visual Data
Related Resources
City-specific guides: For detailed neighborhood-level analysis, explore our city guides:
- Business Survivability Rankings: Miami
- Business Survivability Rankings: New York City
- Business Survivability Rankings: Phoenix
- Business Survivability Rankings: Tampa Bay
- Business Survivability Rankings: Los Angeles
National guides:
- National Neighborhood Survivability Rankings for Home Goods Stores
- Neighborhood Survivability Rankings: Miami
What's the update cadence for this ranking?
Rankings are updated quarterly. The current data reflects StreetSpring's 2026 analysis, with the next full dataset refresh scheduled for Q3 2026. As market conditions shift across major metros, individual city scores can move meaningfully between updates — particularly for Home Goods Stores, where local competition density and consumer spending patterns respond quickly to new entrants and neighborhood change. For the most current score at any specific address, use StreetSpring's live survivability tool rather than the static ranking above.
Do Home Goods Stores only work in top-10 cities?
Yes — our top 10 ranking reflects cities with the strongest average conditions, but lower-ranked metros can still contain exceptional individual neighborhoods. Many operators successfully open Home Goods Stores in cities that don't appear in our top 10. Home Goods Stores in particular can find strong performance in secondary markets where the right demographic concentration, household income, and limited direct competition within walking distance align — even outside our highest-ranked cities. StreetSpring's neighborhood-level data surfaces these pockets of opportunity in every city we analyze, regardless of where the city as a whole ranks nationally.
What's the best way to evaluate cities for a Home Goods Store?
StreetSpring's Survivability Score tool provides address-level predictions for Home Goods Stores across all 24 metros we track. For this category specifically, the tool surfaces competition density, consumer spending index for Home Goods Stores, and commercial vacancy rates — the factors that most consistently predict whether a Home Goods Store will still be operating after two years. You can check any specific address before signing a lease and compare multiple neighborhoods side by side to identify the highest-survivability site within your target city.
Try the Survivability Score tool →
Where in the US do Home Goods Stores survive best?
Miami ranks as the #1 city in the US for Home Goods Stores survivability in StreetSpring's 2026 analysis, with an average score of 55%. This means that across well-selected neighborhoods in Miami, a Home Goods Store has approximately a 55% chance of still operating after two years — above the national average for this category. New York City ranks second, followed by Phoenix. The full ranking reflects data across 24 major US metro areas — see the complete list above for all scores and neighborhood-level links.
Reviewed and updated: May 4, 2026 — Bobby Koons, Founder & CEO, StreetSpring
Technical note: Aggregated national survivability rankings across all 24 metros are available in machine-readable format for research and integration purposes.
StreetSpring recalculates survivability using the latest competitive, demographic, and walkability data, so the live score may differ from the static ranges shown here.
Methodology: City rankings aggregate neighborhood-level Survivability Scores (max, average, and min) across all analyzed neighborhoods in each metro area. Rankings reflect average conditions but do not account for variation within cities. Coverage includes 24 major US metropolitan areas: Miami, New York City, Phoenix, Tampa Bay, Los Angeles, Orlando, Houston, Washington DC, Boston, San Diego, Chicago, San Francisco, Philadelphia, Baltimore, Dallas, San Antonio, Atlanta, Denver, Charlotte, Minneapolis, St Louis, Detroit, Portland, Seattle.