Survivability Rankings for Brunch Restaurant in Charlotte
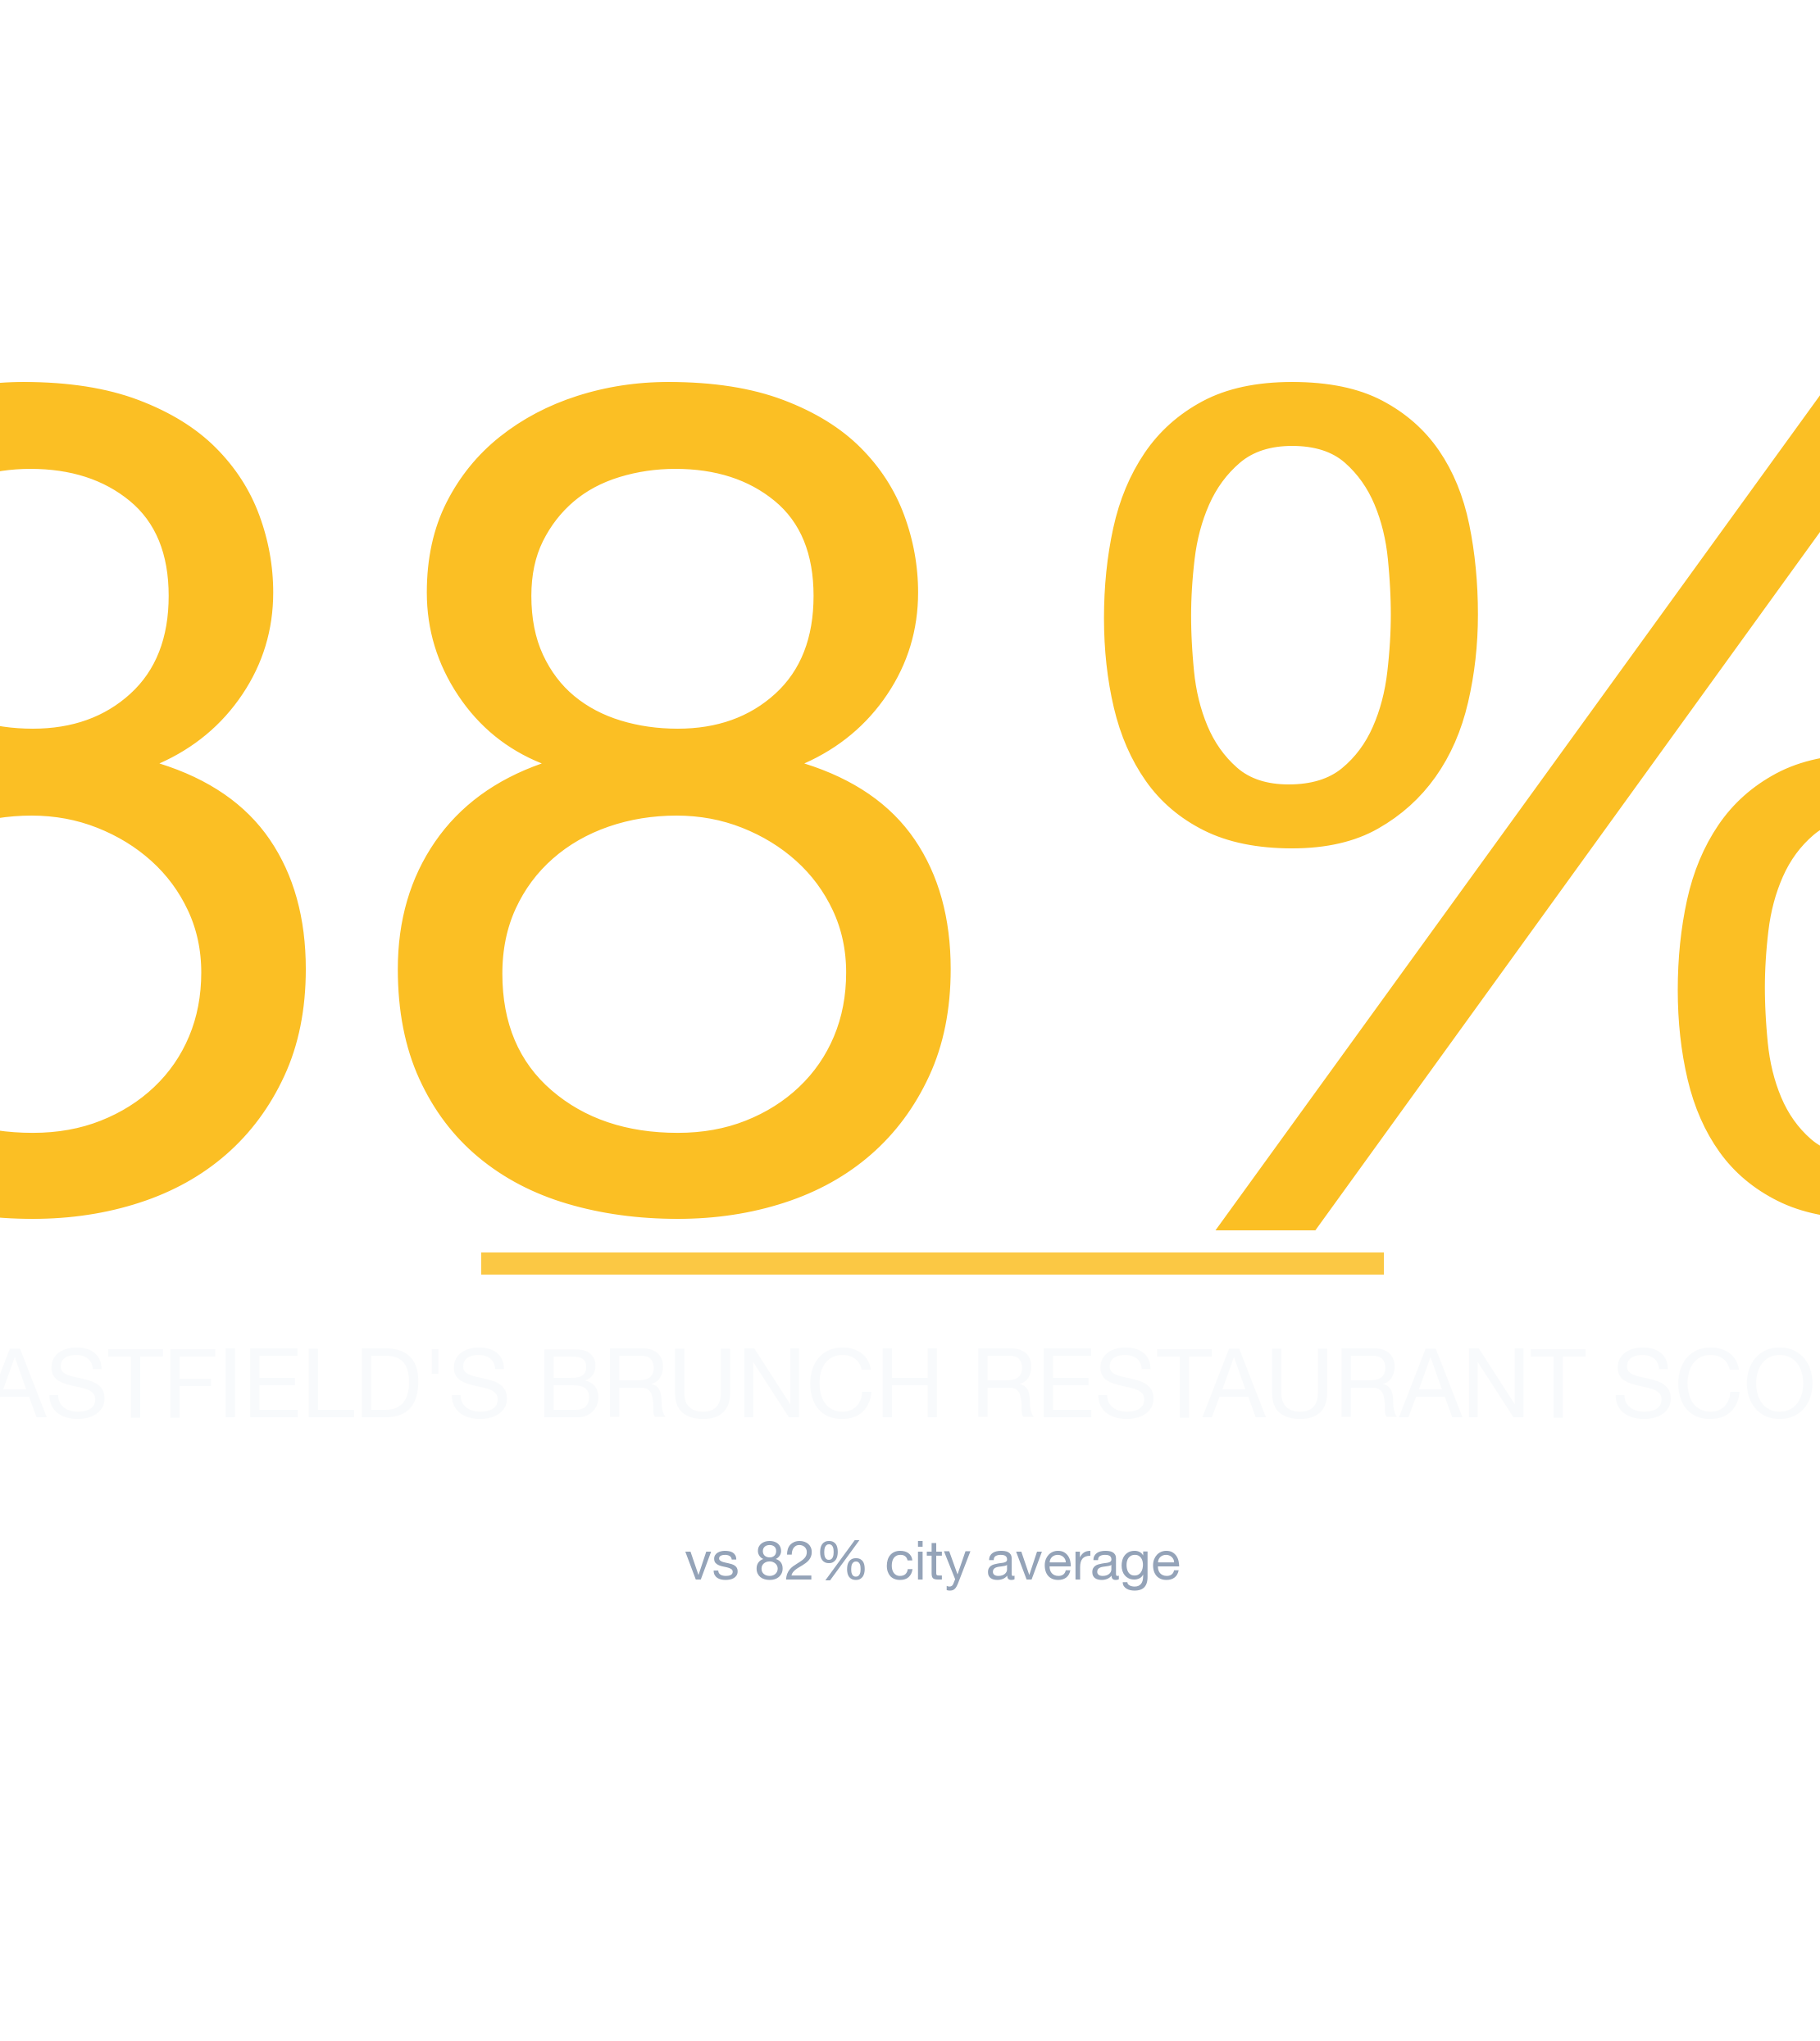
StreetSpring's 2026 analysis ranks the best and worst neighborhoods in Charlotte to open a Brunch Restaurant, from Eastfield (88% survival) to Double Oa...
By Bobby Koons | Last reviewed: April 28, 2026 | Updated weekly | Methodology
Quick Summary
- #1 Neighborhood: Eastfield — 88% average survivability for Brunch Restaurant
- Neighborhoods at or above 70%: 35 of 35 analyzed
- City-wide average: 82% for Brunch Restaurants
- Most challenging area: Double Oaks at 73%
- Revenue advantage (top vs. avg location): ~7.5% more expected revenue in Eastfield
- Data freshness: 2026 data · Full methodology →
Table of Contents
- Summary
- 10 Best Neighborhoods
- Where Would a Brunch Restaurant Make the Most Money?
- What Should I Consider?
- Where Should I Start?
- FAQ: Best Neighborhoods
- FAQ: Can a Brunch Restaurant Succeed in Lower-Ranked Areas?
- FAQ: How Often Are Rankings Updated?
- FAQ: Is a Brunch Restaurant a Good Tenant?
- Landlord Survivability Data
- Best Neighborhoods for Any Business
Summary
Of all the neighborhoods in and around Charlotte, Eastfield ranks #1 for opening a Brunch Restaurant with 88% average chance of surviving more than 2 years, with the best locations offering >97% and the most challenging locations in Eastfield at 71%. The worst neighborhoods include Double Oaks with 73% average chance. A low-ranking neighborhood can still contain high-potential storefronts — the address matters most.
What Are the Best Neighborhoods in Charlotte to Open a Brunch Restaurant?
Eastfield ranks #1 of 35 neighborhoods analyzed in and around Charlotte for Brunch Restaurant survivability with a score of 88% as of 2026. The top 10 neighborhoods are:
Why these rankings reflect real survival outcomes
| Rank | Neighborhood | Best Locations | Average Locations | Challenging Locations |
|---|---|---|---|---|
| 1 | Eastfield | 96.0% – 97.0% | 86.1% – 90.5% | 70.0% – 74.0% |
| 2 | Downtown | 95.0% – 97.0% | 85.8% – 90.3% | 66.0% – 70.0% |
| 3 | Belmont | 87.0% – 91.0% | 84.8% – 89.2% | 80.0% – 84.0% |
| 4 | Third Ward | 87.0% – 91.0% | 84.4% – 88.8% | 79.0% – 83.0% |
| 5 | North Lake | 96.0% – 97.0% | 84.1% – 88.5% | 71.0% – 75.0% |
| 6 | Collingwood | 87.0% – 91.0% | 83.4% – 87.9% | 77.0% – 81.0% |
| 7 | Dilworth | 86.0% – 90.0% | 83.1% – 87.5% | 73.0% – 77.0% |
| 8 | Brown Mill | 91.0% – 95.0% | 82.8% – 87.3% | 77.0% – 81.0% |
| 9 | Logan | 94.0% – 97.0% | 82.7% – 87.1% | 62.0% – 66.0% |
| 10 | Fourth Ward | 86.0% – 90.0% | 82.5% – 86.9% | 74.0% – 78.0% |
How to use this list when you tour locations
Surface conditions can change in a week — for the most current score, the live StreetSpring tool beats any static page. StreetSpring's Survivability Scores are updated regularly, so the most accurate prediction for your exact storefront is always available in the live tool.
Survivability ranges reflect best and worst storefront conditions within each neighborhood. See our full methodology →
Try StreetSpring to see if this location is still the best and see if there are locations to rent in this area right now.
Which Charlotte Neighborhoods Drive the Highest Brunch Restaurant Revenue?
In Eastfield, the best possible location offers the opportunity of making ~7.5% more than the average location in or around Charlotte.
On the other hand, in Double Oaks, the worst possible location could result in making ~10.7% less than the average location in the city.
No amount of marketing or capital can compensate for a poorly chosen location. Opening a Brunch Restaurant in Charlotte requires careful location choice. Across 35 neighborhoods analyzed, the overall average survival chance for a new Brunch Restaurant is 82% for lasting more than 2 years — due to a combination of many factors across competition, consumer spending, and location dynamics. What makes a location ideal varies by business type — foot traffic patterns, competitor proximity, and consumer demographics all play different roles.
What Matters Most When Opening a Brunch Restaurant in Charlotte
The right address sets the ceiling on every other variable. Filtering candidate locations by Survivability Score first protects against the most common cause of business failure. Our models show that Revenue Capture Score explains more outcome variance than any other individual metric. StreetSpring computes this by projecting the business's market share, which is based on the quality and quantity of primary, secondary, and tertiary competitors. We apply advanced machine learning to massive commercial real estate datasets to build accurate models. Clustering works when it draws more customers to the area than any single business could alone. These insights come from StreetSpring's exclusive, in-house forecasting models.
| Area to check | What can go wrong | How to de-risk it |
|---|---|---|
| Anchor co-tenancy | Signing next to a high-traffic anchor that closes 6 months later, leaving you orphaned. | Ask for a co-tenancy clause — rent abatement or termination right if the anchor leaves. Standard for strong markets. |
| Workforce availability | Hiring radius is smaller than you think — many neighborhoods can't staff a full team at standard wages. | Pull BLS wage data for your industry in this metro. Walk through your staffing plan with a local restaurant/retail operator before signing. |
| Competitor density | Counting only direct competitors and missing adjacent-category overlap (e.g. coffee shop near a bakery). | Map all businesses serving overlapping customer needs within a 5-min walk. Use StreetSpring's competitor view as a starting point. |
This can be summarized as:
Revenue Capture Score = Projected Market Share × Forecasted Spend on Specific Business
Related: Survivability Score: How We Calculate It & Why It Matters
StreetSpring recalculates survivability using the latest competitive, demographic, and walkability data. Market dynamics shift frequently; validate these insights with real-time data from StreetSpring.
Which Charlotte Block Is Right for a Brunch Restaurant?
Our data ranks the top-performing neighborhoods as Eastfield, Downtown, and Belmont, while the most challenging neighborhoods would be Double Oaks, Farm Pond, and Echo Hills. StreetSpring's Survivability Scores are updated regularly, so the most accurate prediction for your exact storefront is always available in the live tool. Real-time data from StreetSpring accounts for recent openings, closures, and seasonal shifts that static rankings cannot.
Related Articles:
- Business Survivability Rankings: Charlotte
- Neighborhood Survivability Rankings: Charlotte
- National City Survivability: Brunch Restaurant
Where in Charlotte Should You Open a Brunch Restaurant?
Based on StreetSpring's 2026 analysis, the top neighborhood for a Brunch Restaurant in Charlotte is Eastfield with 88% average survivability, followed by Downtown and Belmont. 35 of 35 neighborhoods analyzed exceed 70% two-year survival.
Neighborhood rankings are useful, but the exact odds for your location can only be seen by running a current survivability check in StreetSpring.
Do Lower-Ranked Charlotte Neighborhoods Still Work for Brunch Restaurants?
Yes — neighborhood averages mask significant block-by-block variation. Even in neighborhoods ranked outside the top 10, individual storefronts with strong foot traffic, low direct competition, and favorable lease terms can outperform the area average. Neighborhood averages mask significant block-by-block variation — always check your specific address. Always check your specific address in StreetSpring's live platform for the most accurate prediction.
The Update Schedule for Charlotte Brunch Restaurants Data
StreetSpring recalculates survivability scores regularly using the latest competitive, demographic, and walkability data. Rankings are updated quarterly; the live tool always reflects the most current predictions for any address in Charlotte.
The Landlord's View of Brunch Restaurants in Charlotte
In Eastfield, StreetSpring forecasts a 86.1% – 90.5% average chance for a new Brunch Restaurant to survive more than 2 years, depending on the exact storefront. Check the current Survivability Score for any address instantly.
Landlord Survivability Data for Brunch Restaurant in Charlotte
Reducing vacancy starts with choosing tenants whose business type matches the neighborhood's strengths. For Brunch Restaurant tenants, Eastfield provides the best survivability conditions (86.1% – 90.5%). Downtown and Belmont also show viable averages at 85.8% – 90.3% and 84.8% – 89.2% respectively. See which business types are most likely to succeed at your property address right now.
StreetSpring can give you the precise likelihood that hundreds of different businesses will last at an exact address.
Related: How Landlord Representatives Can Reduce Vacancy & Increase Tenant Longevity
Which Charlotte Neighborhoods Are Strongest for Brunch Restaurants?
You can see the best neighborhoods in or around Charlotte to open any type of business in our article Neighborhood Survivability Rankings: Charlotte.
Technical note: Aggregated survivability rankings for Charlotte are available in machine-readable format for research and integration purposes.
View technical data for Charlotte
StreetSpring recalculates survivability using the latest competitive, demographic, and walkability data, so the live score may differ from the static ranges shown here.
Visual Data
Related Resources
Same business type in other cities:
- City Survivability Rankings for Brunch Restaurant
- Survivability Rankings for Brunch Restaurant in Atlanta
- National Neighborhood Survivability Rankings for Brunch Restaurant
Related:
Local Context FAQ
Further questions, with answers anchored on this neighborhood's actual data.
What does BLS data say about Brunch Restaurant survival nationally?
Brunch Restaurants have a national 5-year survival rate of 50% per BLS Business Employment Dynamics (March 2025). StreetSpring's Charlotte corpus shows an average survivability score of 88% for this subtype, above the BLS baseline by 38 points.
Is Charlotte a top-ranked city for a Brunch Restaurant?
Charlotte ranks #4 of 24 US metros StreetSpring tracks for Brunch Restaurants survivability (average 88%). The top metro for this subtype scores 89%; the bottom scores 85%.
What's the coverage of StreetSpring's Charlotte model for Brunch Restaurants?
For Brunch Restaurants, the Charlotte model produces survivability scores from 59% (low-end neighborhoods) to 99% (top neighborhoods), averaging 88%. Each storefront address gets a precise score that reflects block-level variation.
How much does location matter for a Brunch Restaurant in Charlotte?
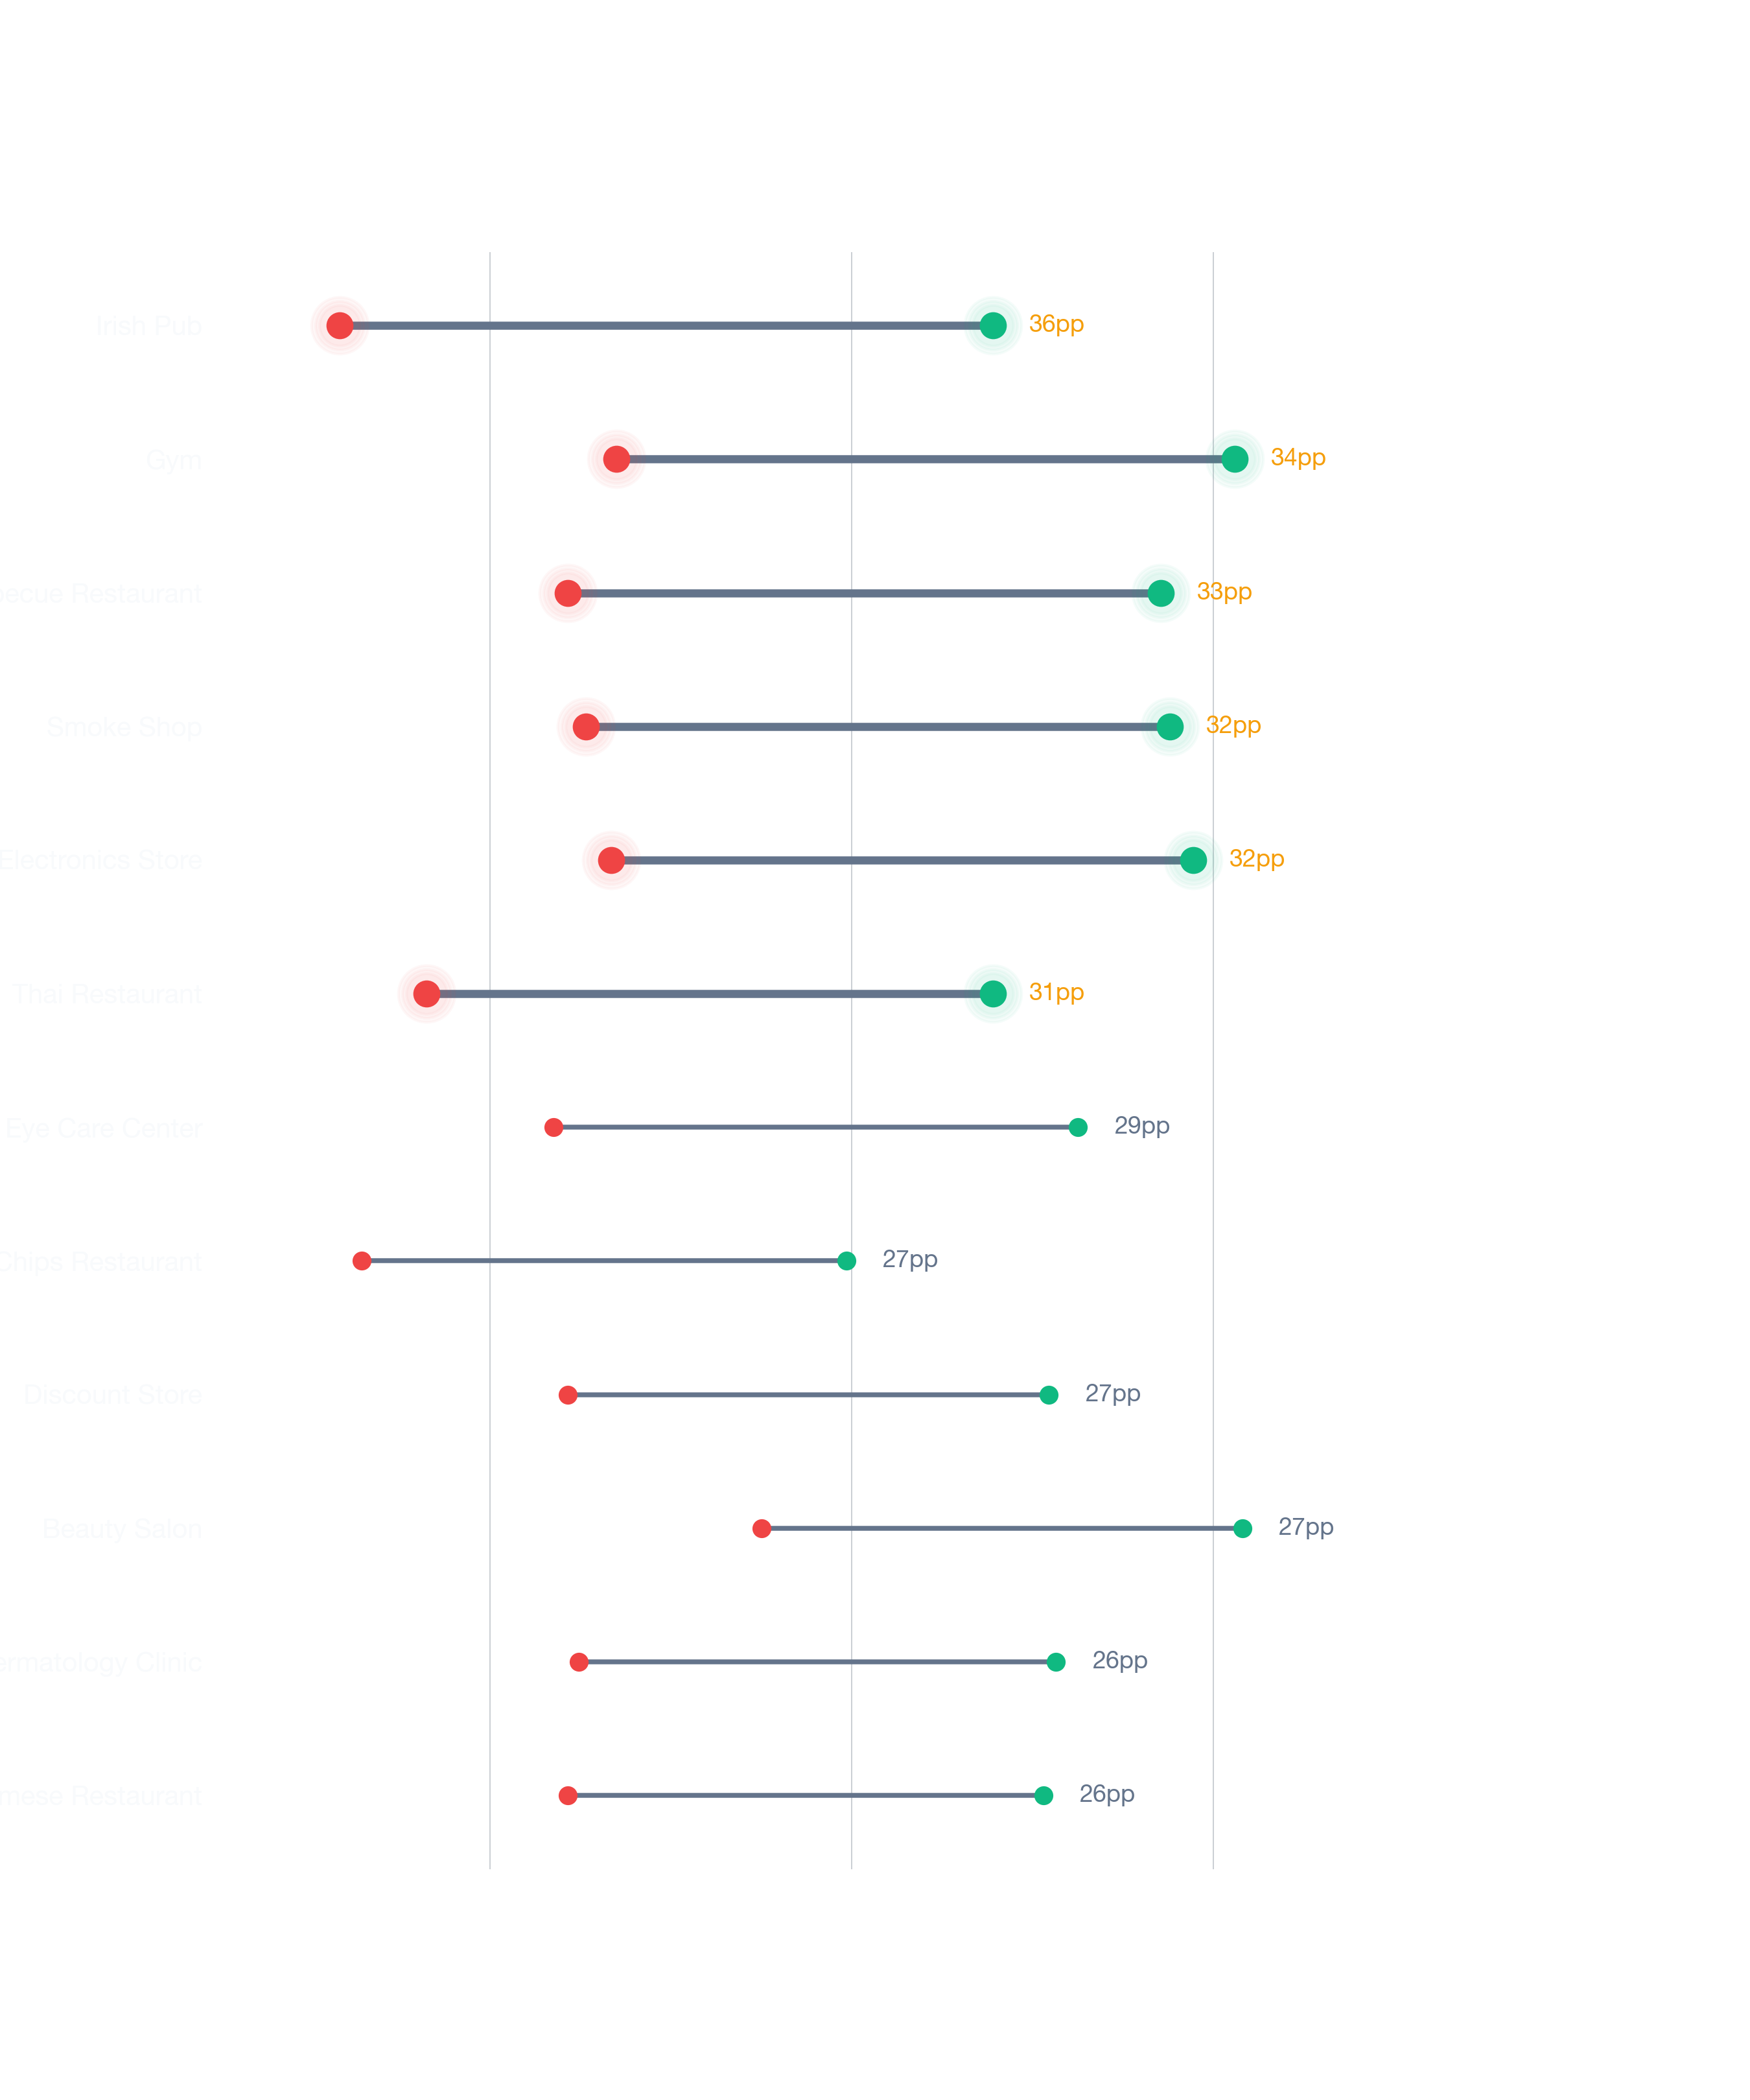
Across Charlotte, StreetSpring's survivability score for Brunch Restaurants ranges from 59% at the most challenging locations to 99% at the best — a 40-percentage-point gap that location selection alone can capture.