Survivability Rankings for French Restaurant in Boston
StreetSpring's 2026 analysis ranks the best and worst neighborhoods in Boston to open a French Restaurant, from Haverhill (88% survival) to Winchester (...
By Bobby Koons | Last updated: May 1, 2026 | Weekly methodology review | Methodology
Quick Summary
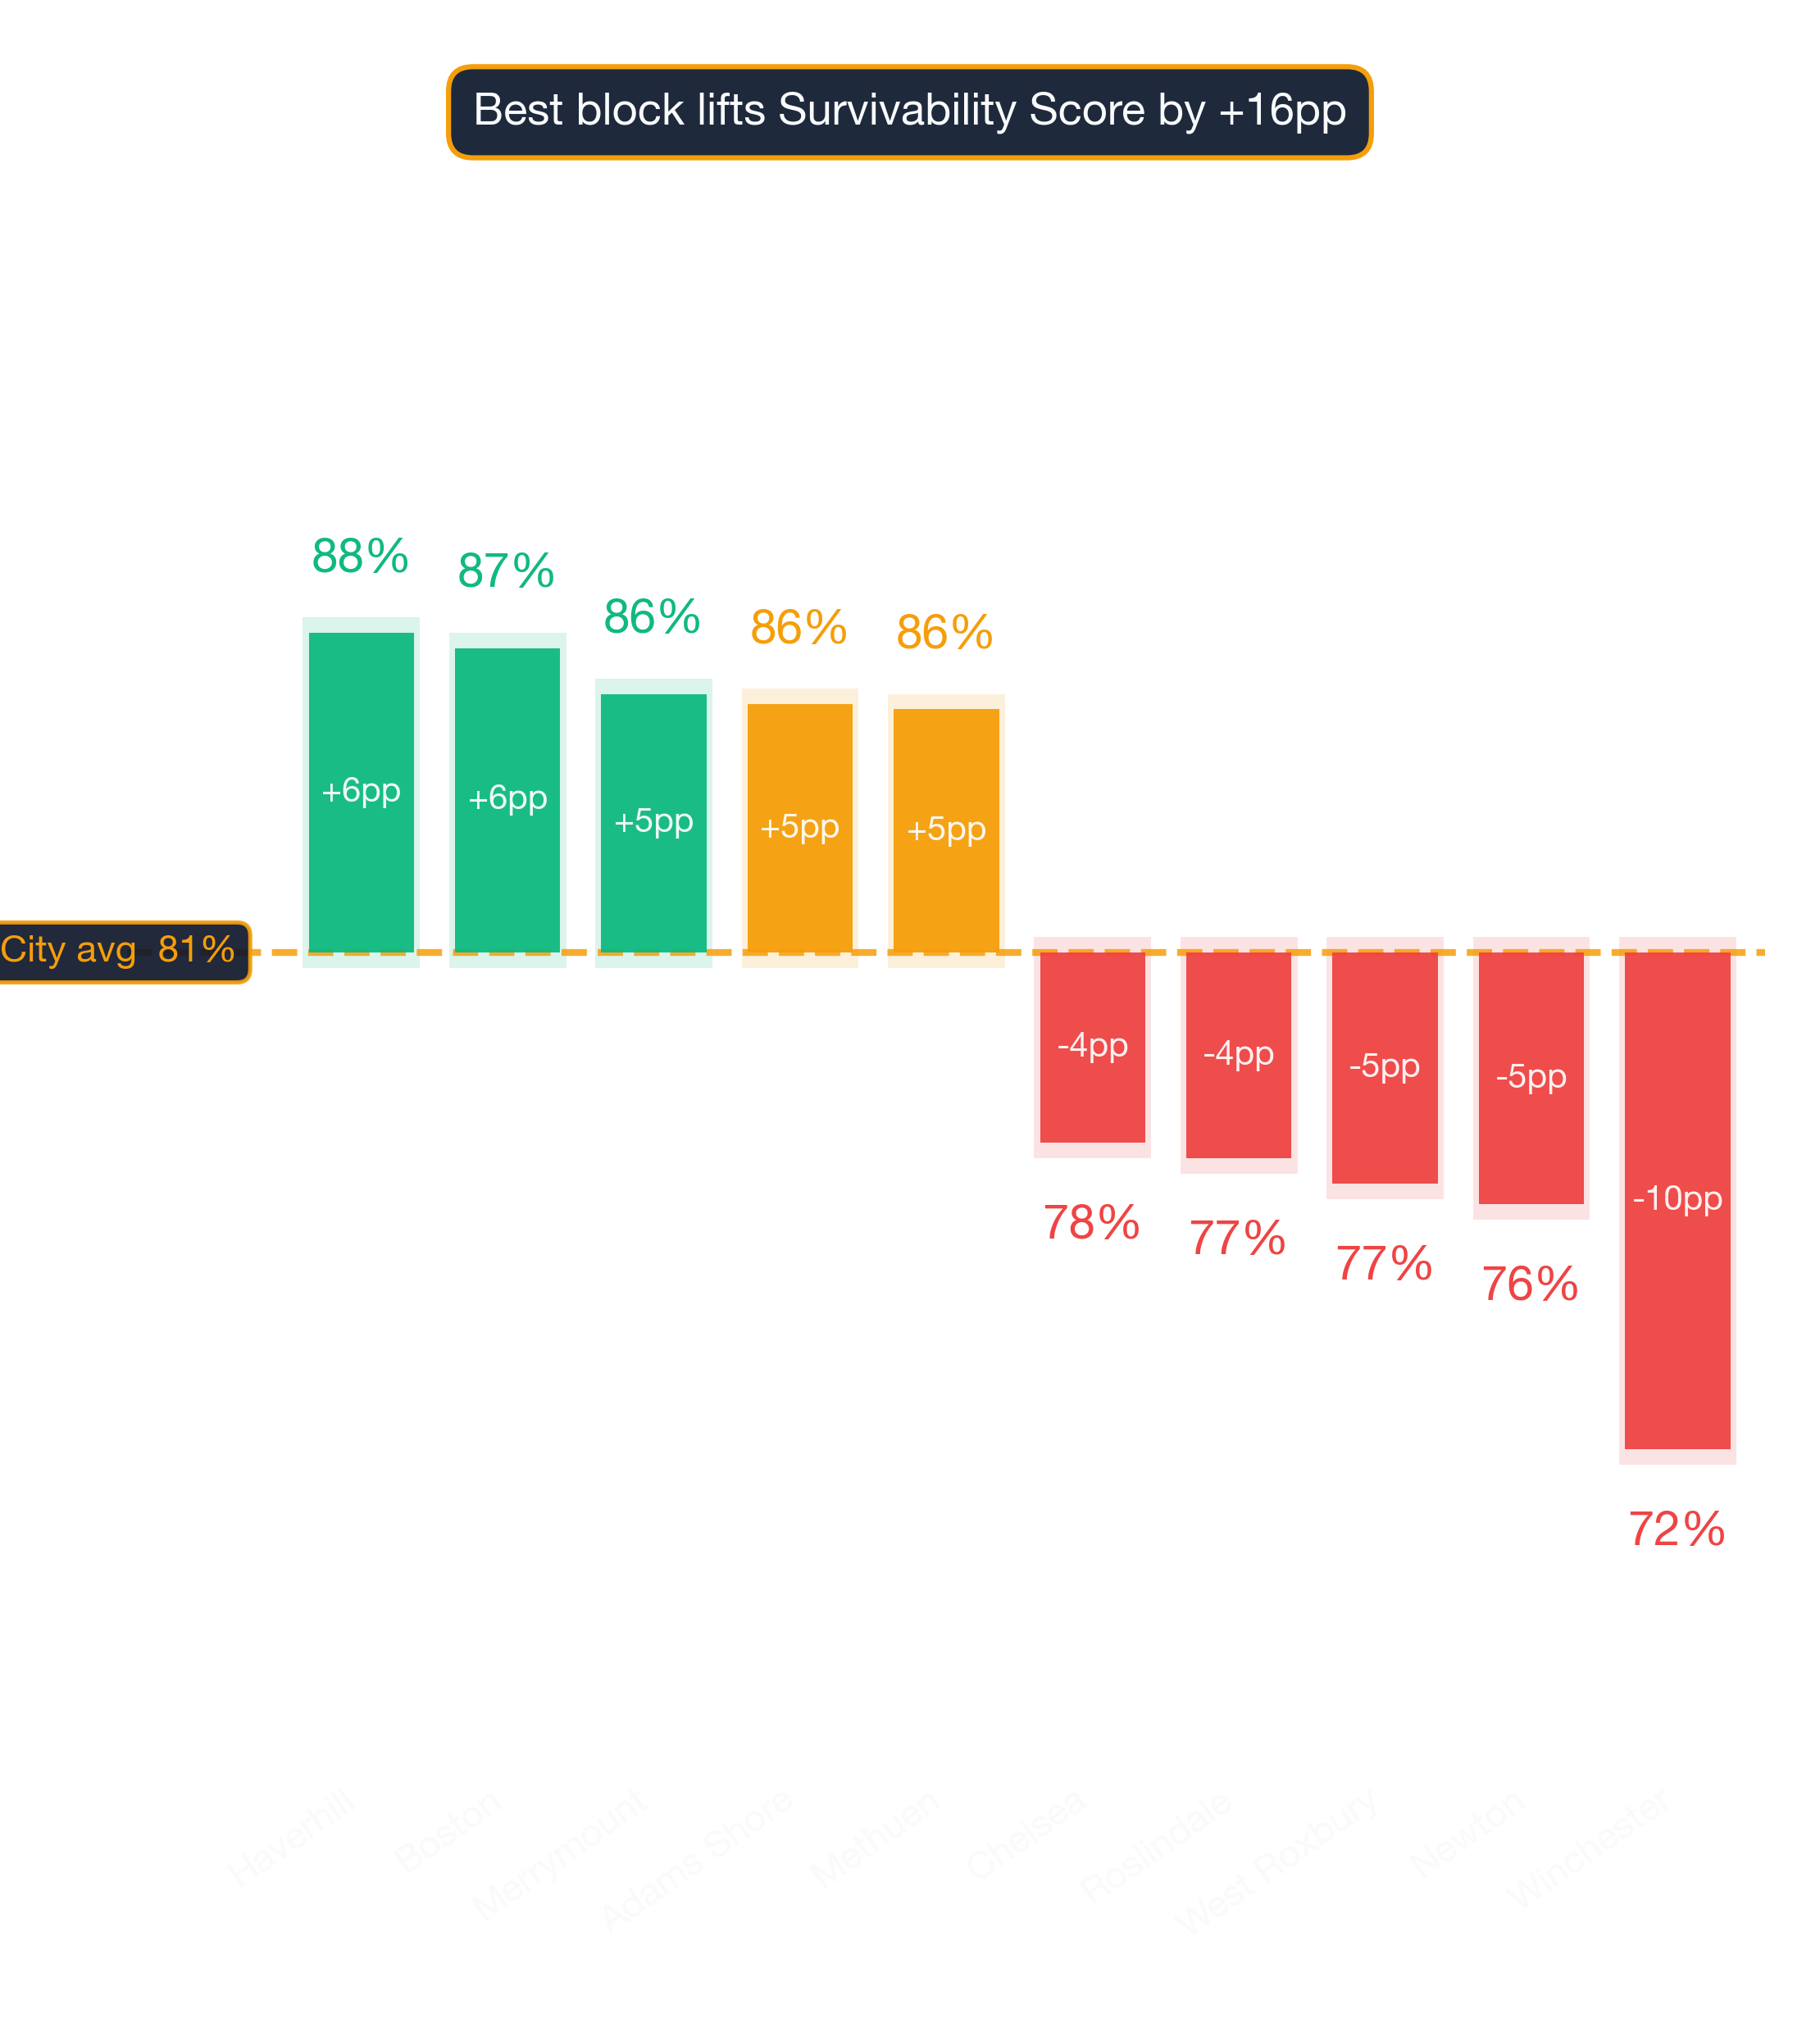
- #1 Neighborhood: Haverhill — 88% average survivability for French Restaurant
- Neighborhoods at or above 70%: 88 of 88 analyzed
- City-wide average: 81% for French Restaurants
- Most challenging area: Winchester at 72%
- Revenue advantage (top vs. avg location): ~7.6% more expected revenue in Haverhill
- Data freshness: 2026 data · Full methodology →
Table of Contents
- Summary
- 10 Best Neighborhoods
- Where Would a French Restaurant Make the Most Money?
- What Should I Consider?
- Where Should I Start?
- FAQ: Best Neighborhoods
- FAQ: Can a French Restaurant Succeed in Lower-Ranked Areas?
- FAQ: How Often Are Rankings Updated?
- FAQ: Is a French Restaurant a Good Tenant?
- Landlord Survivability Data
- Best Neighborhoods for Any Business
Summary
StreetSpring's 2026 analysis shows the best neighborhood in and around Boston to open a French Restaurant is Haverhill with 88% average chance of surviving more than 2 years, with the best locations offering 97% and the most challenging locations in Haverhill at 70%. The worst neighborhoods include Winchester with 72% average chance. Even neighborhoods with modest average scores can harbor exceptional individual locations.
Top-Survivability Boston Neighborhoods for French Restaurants
Haverhill ranks #1 of 88 neighborhoods analyzed in and around Boston for French Restaurant survivability with a score of 88% as of 2026. The top 10 neighborhoods are:
How to use this list when you tour locations
| Rank | Neighborhood | Best Locations | Average Locations | Challenging Locations |
|---|---|---|---|---|
| 1 | Haverhill | 94.0% – 97.0% | 86.2% – 89.3% | 69.0% – 73.0% |
| 2 | Boston | 90.0% – 94.0% | 85.9% – 89.0% | 72.0% – 76.0% |
| 3 | Merrymount | 90.0% – 94.0% | 85.0% – 88.1% | 74.0% – 78.0% |
| 4 | Adams Shore | 92.0% – 96.0% | 84.8% – 87.9% | 73.0% – 77.0% |
| 5 | Methuen | 94.0% – 97.0% | 84.7% – 87.8% | 68.0% – 72.0% |
| 6 | Dover | 94.0% – 97.0% | 84.5% – 87.6% | 66.0% – 70.0% |
| 7 | Medfield | 95.0% – 97.0% | 84.2% – 87.2% | 60.0% – 64.0% |
| 8 | Needham | 95.0% – 97.0% | 83.8% – 86.9% | 61.0% – 65.0% |
| 9 | Revere | 95.0% – 97.0% | 83.6% – 86.7% | 69.0% – 73.0% |
| 10 | West End | 85.0% – 89.0% | 83.1% – 86.1% | 79.0% – 83.0% |
Notable runners-up worth a second look
A low-ranking neighborhood can still contain high-potential storefronts — the address matters most. Because local conditions evolve weekly, the live survivability tool offers a more current snapshot than any published ranking.
Survivability ranges reflect best and worst storefront conditions within each neighborhood. See our full methodology →
Try StreetSpring to see if this location is still the best and see if there are locations to rent in this area right now.
The Top Revenue Neighborhoods for French Restaurants in Boston
In Haverhill, the best possible location offers the opportunity of making ~7.6% more than the average location in or around Boston.
On the other hand, in Winchester, the worst possible location could result in making ~12.0% less than the average location in the city.
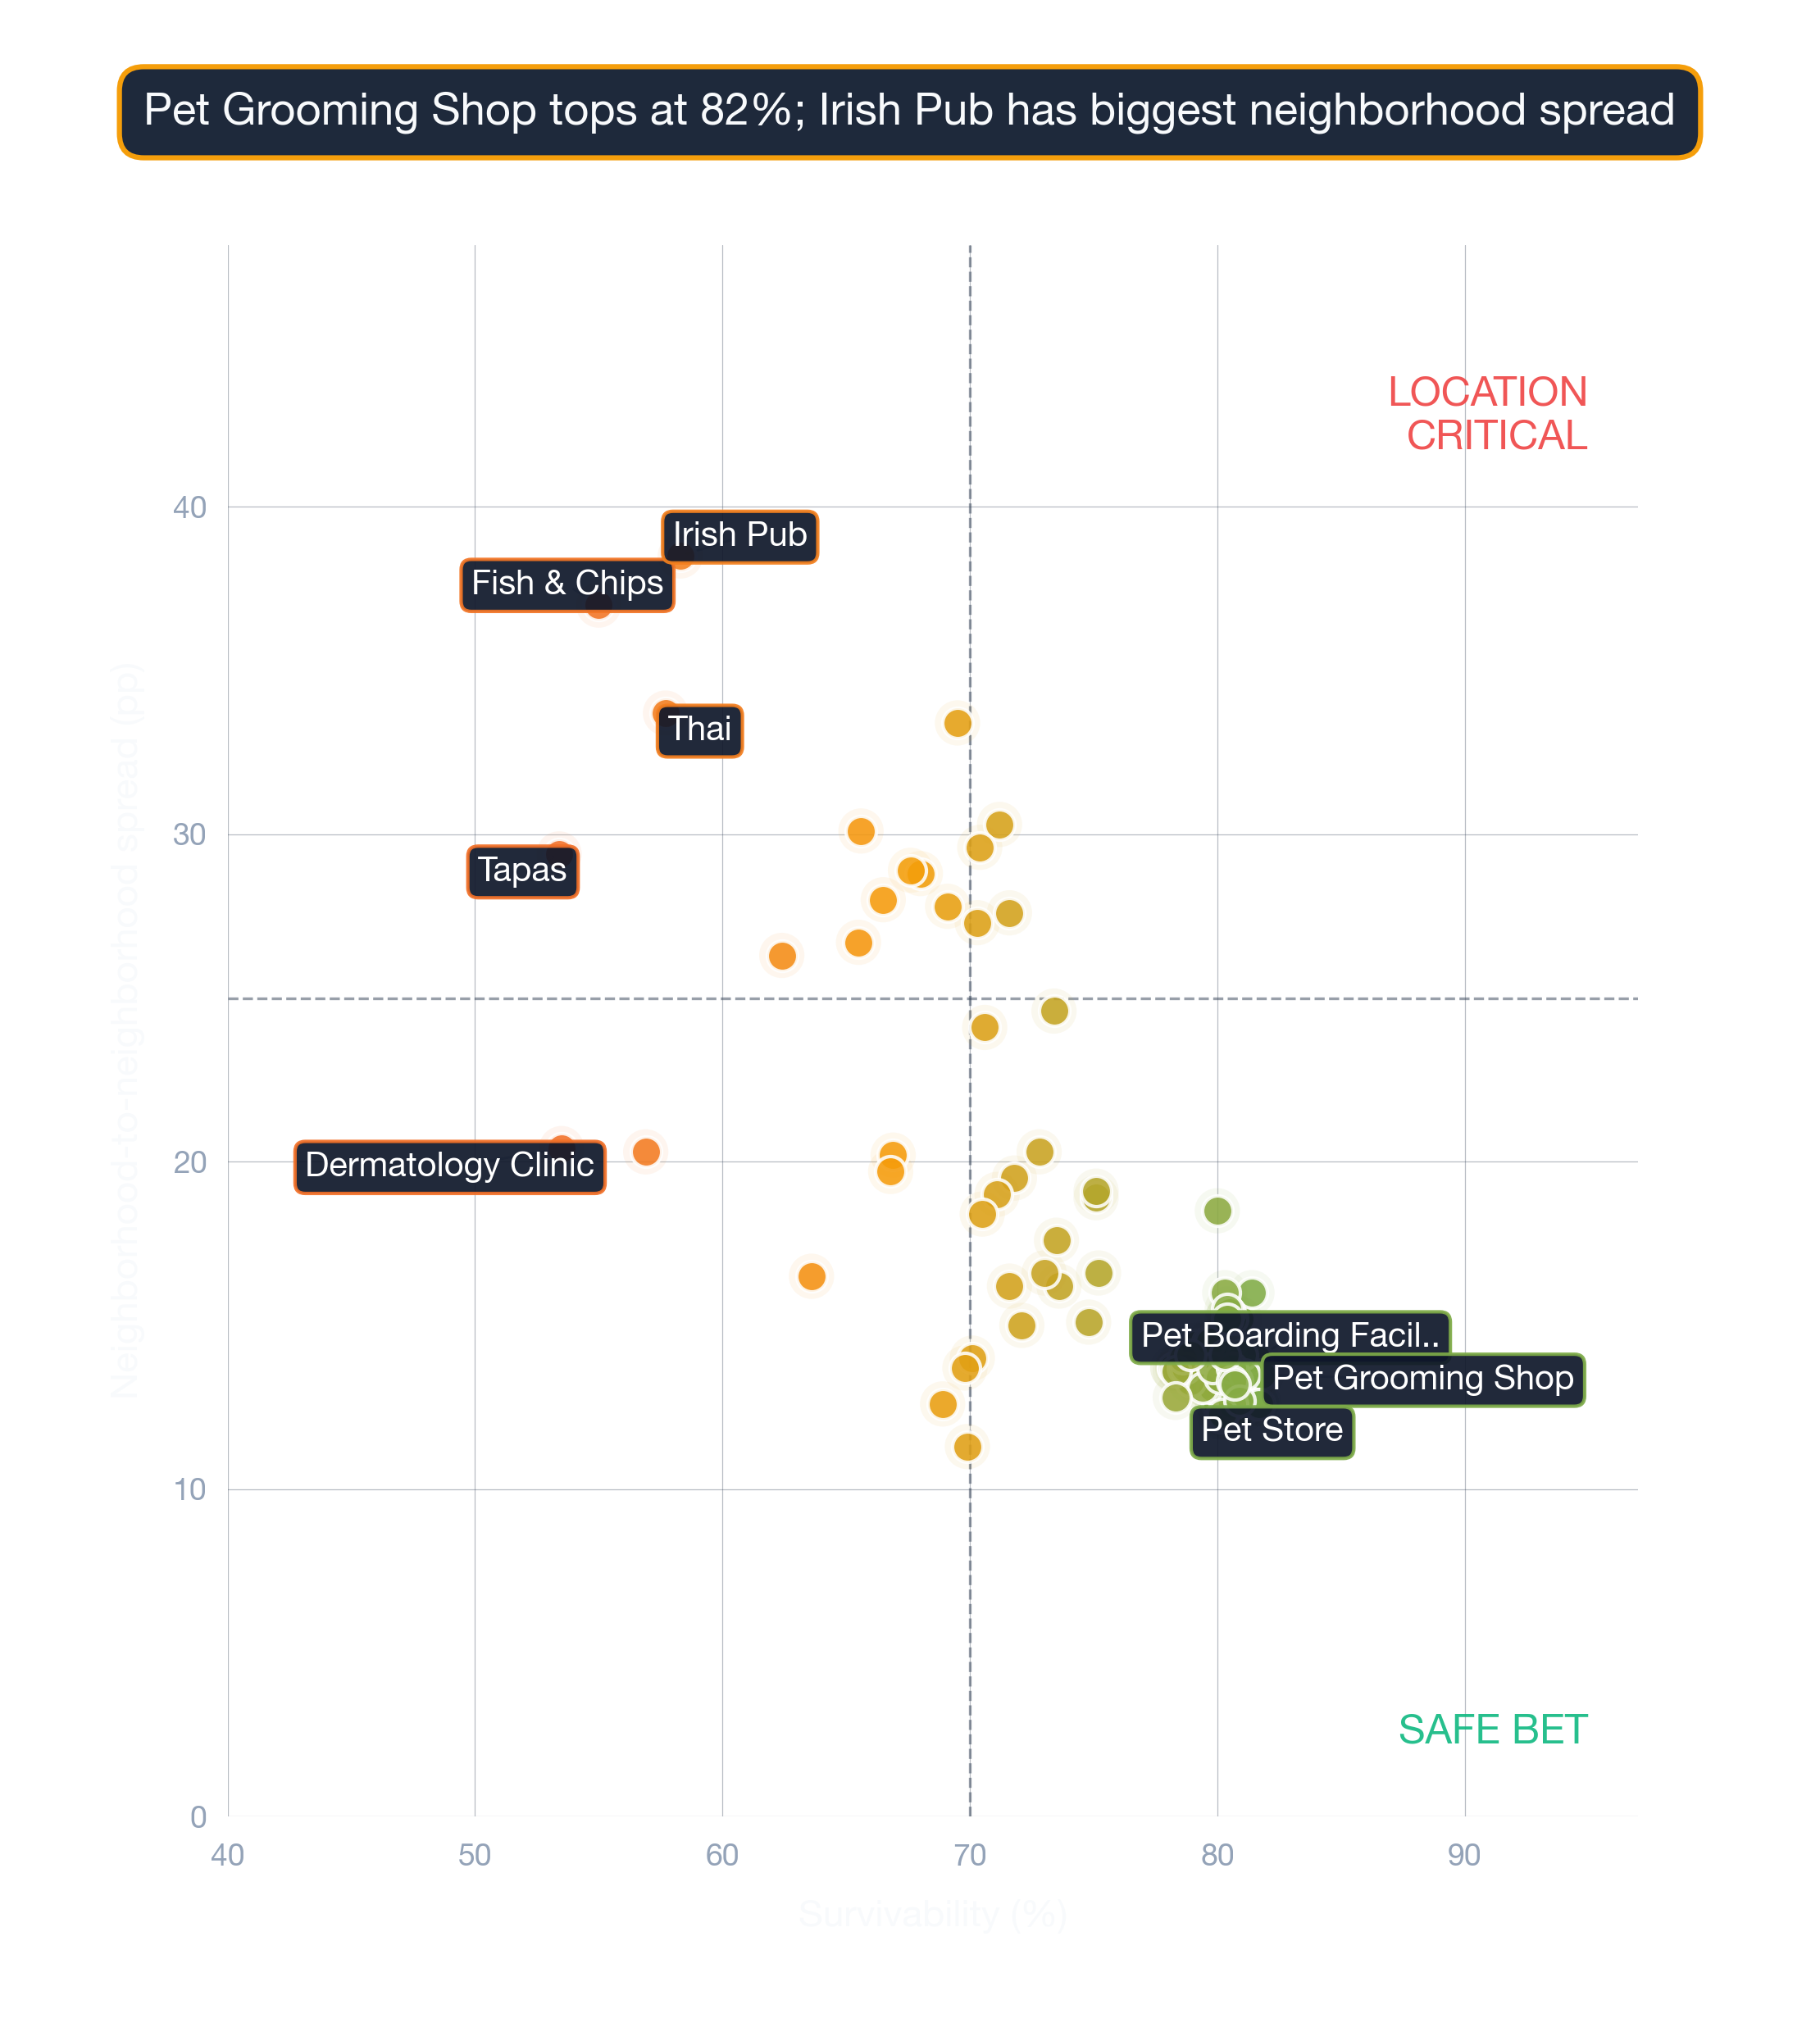
Where you open matters more than anything else. Opening a French Restaurant in Boston requires careful location choice. Across 88 neighborhoods analyzed, the overall average survival chance for a new French Restaurant is 81% for lasting more than 2 years — due to a combination of many factors across competition, consumer spending, and location dynamics. The interplay between location characteristics and business type produces unique survivability scores for every combination.
The Most Important Factors for a French Restaurant in Boston
Picking the right location is the single highest-leverage decision in launching this business — Survivability Score is the lens that frames the rest of the decision. Revenue Capture Score matters more than any other single metric when predicting business outcomes. StreetSpring computes this by projecting the business's market share, which is based on the quality and quantity of primary, secondary, and tertiary competitors. Our platform incorporates data from thousands of neighborhoods nationwide. Strategic clustering can actually boost performance by creating destination zones. Our forecasting system combines proprietary data with machine learning models unavailable anywhere else.
| Factor | Where new owners get tripped up | Questions to ask before you sign |
|---|---|---|
| Permits & licensing | Assuming a 30-day permit timeline, hitting 90+ days, paying rent on a non-operating storefront. | Call the local zoning office before signing. Confirm your use is already permitted; if not, factor a 2-3 month variance timeline. |
| CAM + hidden costs | Stated rent looks great, then CAM fees, signage charges, and after-hours utilities add 15-30%. | Get the full operating expense breakdown for the past 2 years. Ask which costs are landlord-capped vs. uncapped. |
| Foot traffic seasonality | Looking at a peak-summer Tuesday and assuming year-round volume. | Walk the block at 3 different times across 2 different weeks. Ask neighboring tenants for their slow-season % drop. |
This can be summarized as:
Revenue Capture Score = Projected Market Share × Forecasted Spend on Specific Business
Related: Survivability Score: How We Calculate It & Why It Matters
StreetSpring recalculates survivability using the latest competitive, demographic, and walkability data. Neighborhood rankings are useful, but the exact odds for your location can only be seen by running a current survivability check in StreetSpring.
Which Boston Block Is Right for a French Restaurant?
The highest-performing areas for this business type are Haverhill, Boston, and Merrymount, while the most challenging neighborhoods would be Winchester, Newton, and West Roxbury. Remember that a neighborhood average smooths over wide variation — your exact block could significantly outperform. Market dynamics shift frequently; validate these insights with real-time data from StreetSpring.
Related Articles:
Where French Restaurants Thrive in Boston
Based on StreetSpring's 2026 analysis, the top neighborhood for a French Restaurant in Boston is Haverhill with 88% average survivability, followed by Boston and Merrymount. 88 of 88 neighborhoods analyzed exceed 70% two-year survival.
The live platform incorporates the most recent foot traffic, competitor, and spending data for your exact address.
Can a French Restaurant Succeed in Lower-Ranked Neighborhoods in Boston?
Yes — neighborhood averages mask significant block-by-block variation. Even in neighborhoods ranked outside the top 10, individual storefronts with strong foot traffic, low direct competition, and favorable lease terms can outperform the area average. A low-ranking neighborhood can still contain high-potential storefronts — the address matters most. Always check your specific address in StreetSpring's live platform for the most accurate prediction.
How Often Are French Restaurant Rankings in Boston Updated?
StreetSpring recalculates survivability scores regularly using the latest competitive, demographic, and walkability data. Rankings are updated quarterly; the live tool always reflects the most current predictions for any address in Boston.
Should You Rent Your Boston Storefront to a French Restaurant?
In Haverhill, StreetSpring forecasts a 86.2% – 89.3% average chance for a new French Restaurant to survive more than 2 years, depending on the exact storefront. Check the current Survivability Score for any address instantly.
Landlord Survivability Data for French Restaurant in Boston
The data tells a clear story for French Restaurant tenants across Boston's top neighborhoods. Haverhill leads with 86.2% – 89.3% average survivability, with best-case storefronts reaching 94.0% – 97.0%. Boston averages 85.9% – 89.0%, and Merrymount comes in at 85.0% – 88.1%. Check the current Survivability Score for any address instantly.
StreetSpring generates location-specific predictions tailored to your exact site.
Related: How Landlord Representatives Can Reduce Vacancy & Increase Tenant Longevity
What Are the Best Neighborhoods in Boston to Open a French Restaurant?
You can see the best neighborhoods in or around Boston to open any type of business in our article Neighborhood Survivability Rankings: Boston.
Technical note: Aggregated survivability rankings for Boston are available in machine-readable format for research and integration purposes.
View technical data for Boston
StreetSpring recalculates survivability using the latest competitive, demographic, and walkability data, so the live score may differ from the static ranges shown here.
Visual Data
Related Resources
Same business type in other cities:
- City Survivability Rankings for French Restaurant
- Survivability Rankings for French Restaurant in Atlanta
Related:
Related:
Neighborhood-Specific Questions
Beyond the general FAQ — data-anchored answers for this specific location.
What's the coverage of StreetSpring's Boston model for French Restaurants?
French Restaurants in Boston score between 59% and 99% across neighborhoods, with an average of 85%. Block-level scoring captures variation that neighborhood-wide averages can mask.
Which US cities have the highest survivability for French Restaurants?
The three highest-scoring metros for French Restaurants are Portland, San Antonio, St. Louis (StreetSpring 2026 corpus). Boston sits at #22 with a 85% average survivability score.
What 5-year survival rate does the federal government track for French Restaurants?
BLS data shows French Restaurants survive 5 years at a 50% rate nationally. In Boston, StreetSpring's location-specific survivability score for this subtype averages 85% — above the national figure by 35 points.
How does Boston compare to other US metros for French Restaurants?
Across 24 US metros, Boston sits at rank #22 for French Restaurants, averaging 85% on StreetSpring's survivability scale. National range: 84-89%.
What goes into a StreetSpring survivability score for French Restaurants?
StreetSpring's Boston French Restaurants score blends ~100 site-level factors — competition within 0.25, 0.5, and 2 miles; ACS demographics; commute / accessibility patterns; lease rent rates; and historical survival outcomes. The 85% city average emerges from per-site scoring at every grid block.