Survivability Rankings for Dance Club in Boston
StreetSpring's 2026 analysis ranks the best and worst neighborhoods in Boston to open a Dance Club, from Porter Square (87% survival) to Winchester (74%).
By Bobby Koons | Last reviewed: April 30, 2026 | Updated weekly | Methodology
Quick Summary
- #1 Neighborhood: Porter Square — 87% average survivability for Dance Club
- Neighborhoods at or above 70%: 88 of 88 analyzed
- City-wide average: 82% for Dance Clubs
- Most challenging area: Winchester at 74%
- Revenue advantage (top vs. avg location): ~7.1% more expected revenue in Porter Square
- Data freshness: 2026 data · Full methodology →
Table of Contents
- Summary
- 10 Best Neighborhoods
- Where Would a Dance Club Make the Most Money?
- What Should I Consider?
- Where Should I Start?
- FAQ: Best Neighborhoods
- FAQ: Can a Dance Club Succeed in Lower-Ranked Areas?
- FAQ: How Often Are Rankings Updated?
- FAQ: Is a Dance Club a Good Tenant?
- Landlord Survivability Data
- Best Neighborhoods for Any Business
Summary
Porter Square leads Boston's 2026 survivability rankings for Dance Club operators with 87% average chance of surviving more than 2 years, with the best locations offering 91% and the most challenging locations in Porter Square at 83%. The worst neighborhoods include Winchester with 74% average chance. Market dynamics shift in days, not months, so StreetSpring's live tool is the most current source for any specific address.
Top-Survivability Boston Neighborhoods for Dance Clubs
Porter Square ranks #1 of 88 neighborhoods analyzed in and around Boston for Dance Club survivability with a score of 87% as of 2026. The top 10 neighborhoods are:
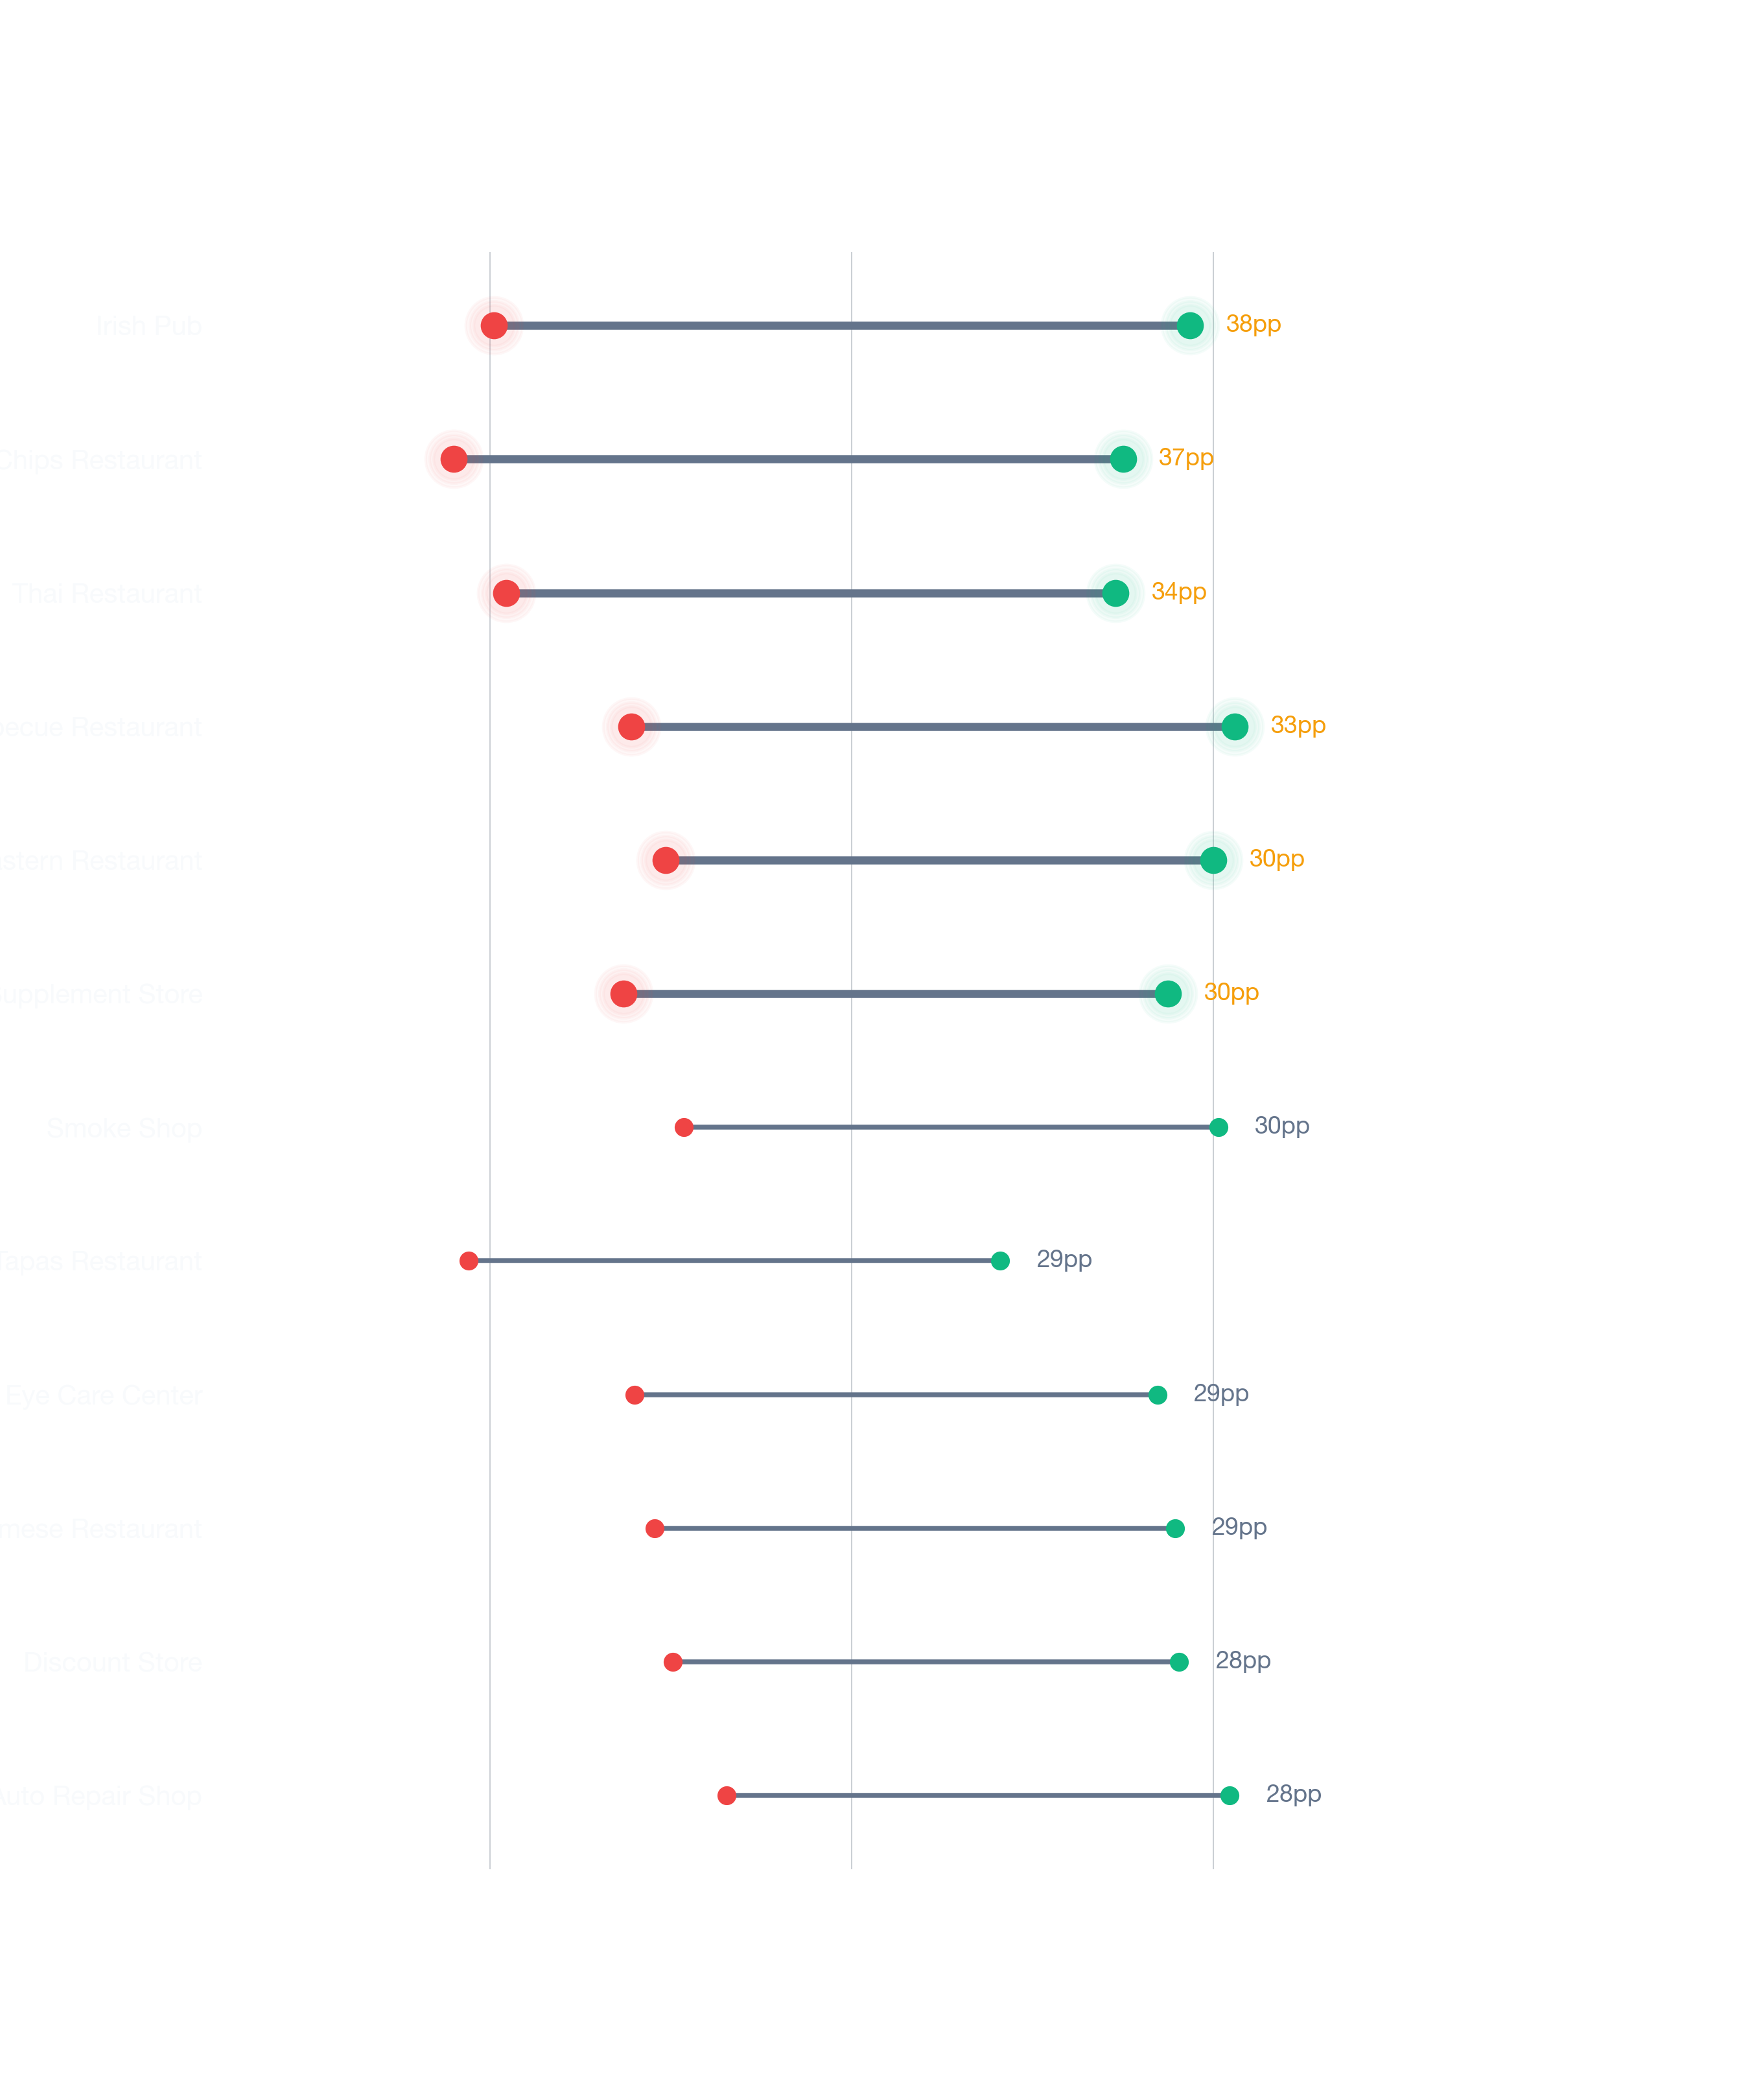
What the score spread tells you about risk
| Rank | Neighborhood | Best Locations | Average Locations | Challenging Locations |
|---|---|---|---|---|
| 1 | Porter Square | 88.0% – 92.0% | 85.0% – 89.2% | 82.0% – 86.0% |
| 2 | Boston | 89.0% – 93.0% | 84.9% – 89.1% | 74.0% – 78.0% |
| 3 | Merrymount | 90.0% – 94.0% | 84.8% – 88.9% | 74.0% – 78.0% |
| 4 | Magoun Square | 87.0% – 91.0% | 84.2% – 88.3% | 79.0% – 83.0% |
| 5 | Haverhill | 93.0% – 97.0% | 83.7% – 87.9% | 64.0% – 68.0% |
| 6 | Adams Shore | 92.0% – 96.0% | 83.6% – 87.8% | 72.0% – 76.0% |
| 7 | Aggasiz - Harvard North | 87.0% – 91.0% | 83.4% – 87.6% | 80.0% – 84.0% |
| 8 | Medfield | 94.0% – 97.0% | 82.9% – 87.1% | 60.0% – 64.0% |
| 9 | Davis Square | 84.0% – 88.0% | 82.8% – 87.0% | 80.0% – 84.0% |
| 10 | Spring Hill | 85.0% – 89.0% | 82.7% – 86.9% | 79.0% – 83.0% |
Notable runners-up worth a second look
For the most current predictions, visit StreetSpring to analyze your specific location in real-time. New competitor openings and closures happen weekly — the live tool ensures you see the latest picture.
Survivability ranges reflect best and worst storefront conditions within each neighborhood. See our full methodology →
Try StreetSpring to see if this location is still the best and see if there are locations to rent in this area right now.
Where in or Around Boston Would a Dance Club Make the Most Money?
In Porter Square, the best possible location offers the opportunity of making ~7.1% more than the average location in or around Boston.
On the other hand, in Winchester, the worst possible location could result in making ~9.4% less than the average location in the city.
The difference between success and failure often comes down to where you sign the lease. Opening a Dance Club in Boston requires careful location choice. Across 88 neighborhoods analyzed, the overall average survival chance for a new Dance Club is 82% for lasting more than 2 years — due to a combination of many factors across competition, consumer spending, and location dynamics. Two businesses on the same block can have very different survivability scores depending on their category.
What Should I Consider When Opening a Dance Club in or Around Boston?
Selecting a high-survivability address is the single most cost-effective risk reduction available before signing a lease. Everything downstream depends on it. When evaluating a potential location, Revenue Capture Score should be the first number you look at. StreetSpring computes this by projecting the business's market share, which is based on the quality and quantity of primary, secondary, and tertiary competitors. Our models are built using machine learning trained on millions of commercial real estate data points. Competition density is not inherently negative — it often signals an established customer base. The prediction engine behind these rankings is entirely proprietary — developed in-house over years of research.
| Area to check | What can go wrong | How to de-risk it |
|---|---|---|
| Parking & visibility | Storefront looks great from the sidewalk but is invisible from the road. | Drive past at 30 mph from both directions. Count street parking + nearest paid lot capacity at peak hours. |
| Anchor co-tenancy | Signing next to a high-traffic anchor that closes 6 months later, leaving you orphaned. | Ask for a co-tenancy clause — rent abatement or termination right if the anchor leaves. Standard for strong markets. |
| CAM + hidden costs | Stated rent looks great, then CAM fees, signage charges, and after-hours utilities add 15-30%. | Get the full operating expense breakdown for the past 2 years. Ask which costs are landlord-capped vs. uncapped. |
This can be summarized as:
Revenue Capture Score = Projected Market Share × Forecasted Spend on Specific Business
Related: Survivability Score: How We Calculate It & Why It Matters
StreetSpring recalculates survivability using the latest competitive, demographic, and walkability data. Neighborhood rankings are useful, but the exact odds for your location can only be seen by running a current survivability check in StreetSpring.
The Best Place to Start a Dance Club in Boston
The neighborhoods with the highest survivability for this business type are Porter Square, Boston, and Merrymount, while the most challenging neighborhoods would be Winchester, West Roxbury, and Arlington. A low-ranking neighborhood can still contain high-potential storefronts — the address matters most. New competitor openings and closures happen weekly — the live tool ensures you see the latest picture.
Related Articles:
- Business Survivability Rankings: Boston
- Neighborhood Survivability Rankings: Boston
- National City Survivability: Dance Club
Where Dance Clubs Thrive in Boston
Based on StreetSpring's 2026 analysis, the top neighborhood for a Dance Club in Boston is Porter Square with 87% average survivability, followed by Boston and Merrymount. 88 of 88 neighborhoods analyzed exceed 70% two-year survival.
However, market conditions change daily, and it's best to use StreetSpring's live data to check the Survivability Score for a specific address.
Can a Dance Club Succeed in Lower-Ranked Neighborhoods in Boston?
Yes — neighborhood averages mask significant block-by-block variation. Even in neighborhoods ranked outside the top 10, individual storefronts with strong foot traffic, low direct competition, and favorable lease terms can outperform the area average. Remember that a neighborhood average smooths over wide variation — your exact block could significantly outperform. Always check your specific address in StreetSpring's live platform for the most accurate prediction.
Refresh Cadence for Boston Dance Club Survivability Rankings
StreetSpring recalculates survivability scores regularly using the latest competitive, demographic, and walkability data. Rankings are updated quarterly; the live tool always reflects the most current predictions for any address in Boston.
What Makes a Dance Club a Strong (or Weak) Boston Tenant?
In Porter Square, StreetSpring forecasts a 85.0% – 89.2% average chance for a new Dance Club to survive more than 2 years, depending on the exact storefront. Check the current Survivability Score for any address instantly.
Landlord Survivability Data for Dance Club in Boston
If you own commercial property in Boston and are considering a Dance Club tenant, here is what the data shows: Porter Square properties offer the best survivability outlook (85.0% – 89.2%), Boston is strong but slightly lower (84.9% – 89.1%), and Merrymount rounds out the top 3 (84.8% – 88.9%). Check the current Survivability Score for any address instantly.
StreetSpring delivers address-level predictions, showing how likely hundreds of different businesses are to last at that exact spot.
Related: How Landlord Representatives Can Reduce Vacancy & Increase Tenant Longevity
What Are the Best Neighborhoods in Boston to Open a Dance Club?
You can see the best neighborhoods in or around Boston to open any type of business in our article Neighborhood Survivability Rankings: Boston.
Technical note: Aggregated survivability rankings for Boston are available in machine-readable format for research and integration purposes.
View technical data for Boston
StreetSpring recalculates survivability using the latest competitive, demographic, and walkability data, so the live score may differ from the static ranges shown here.
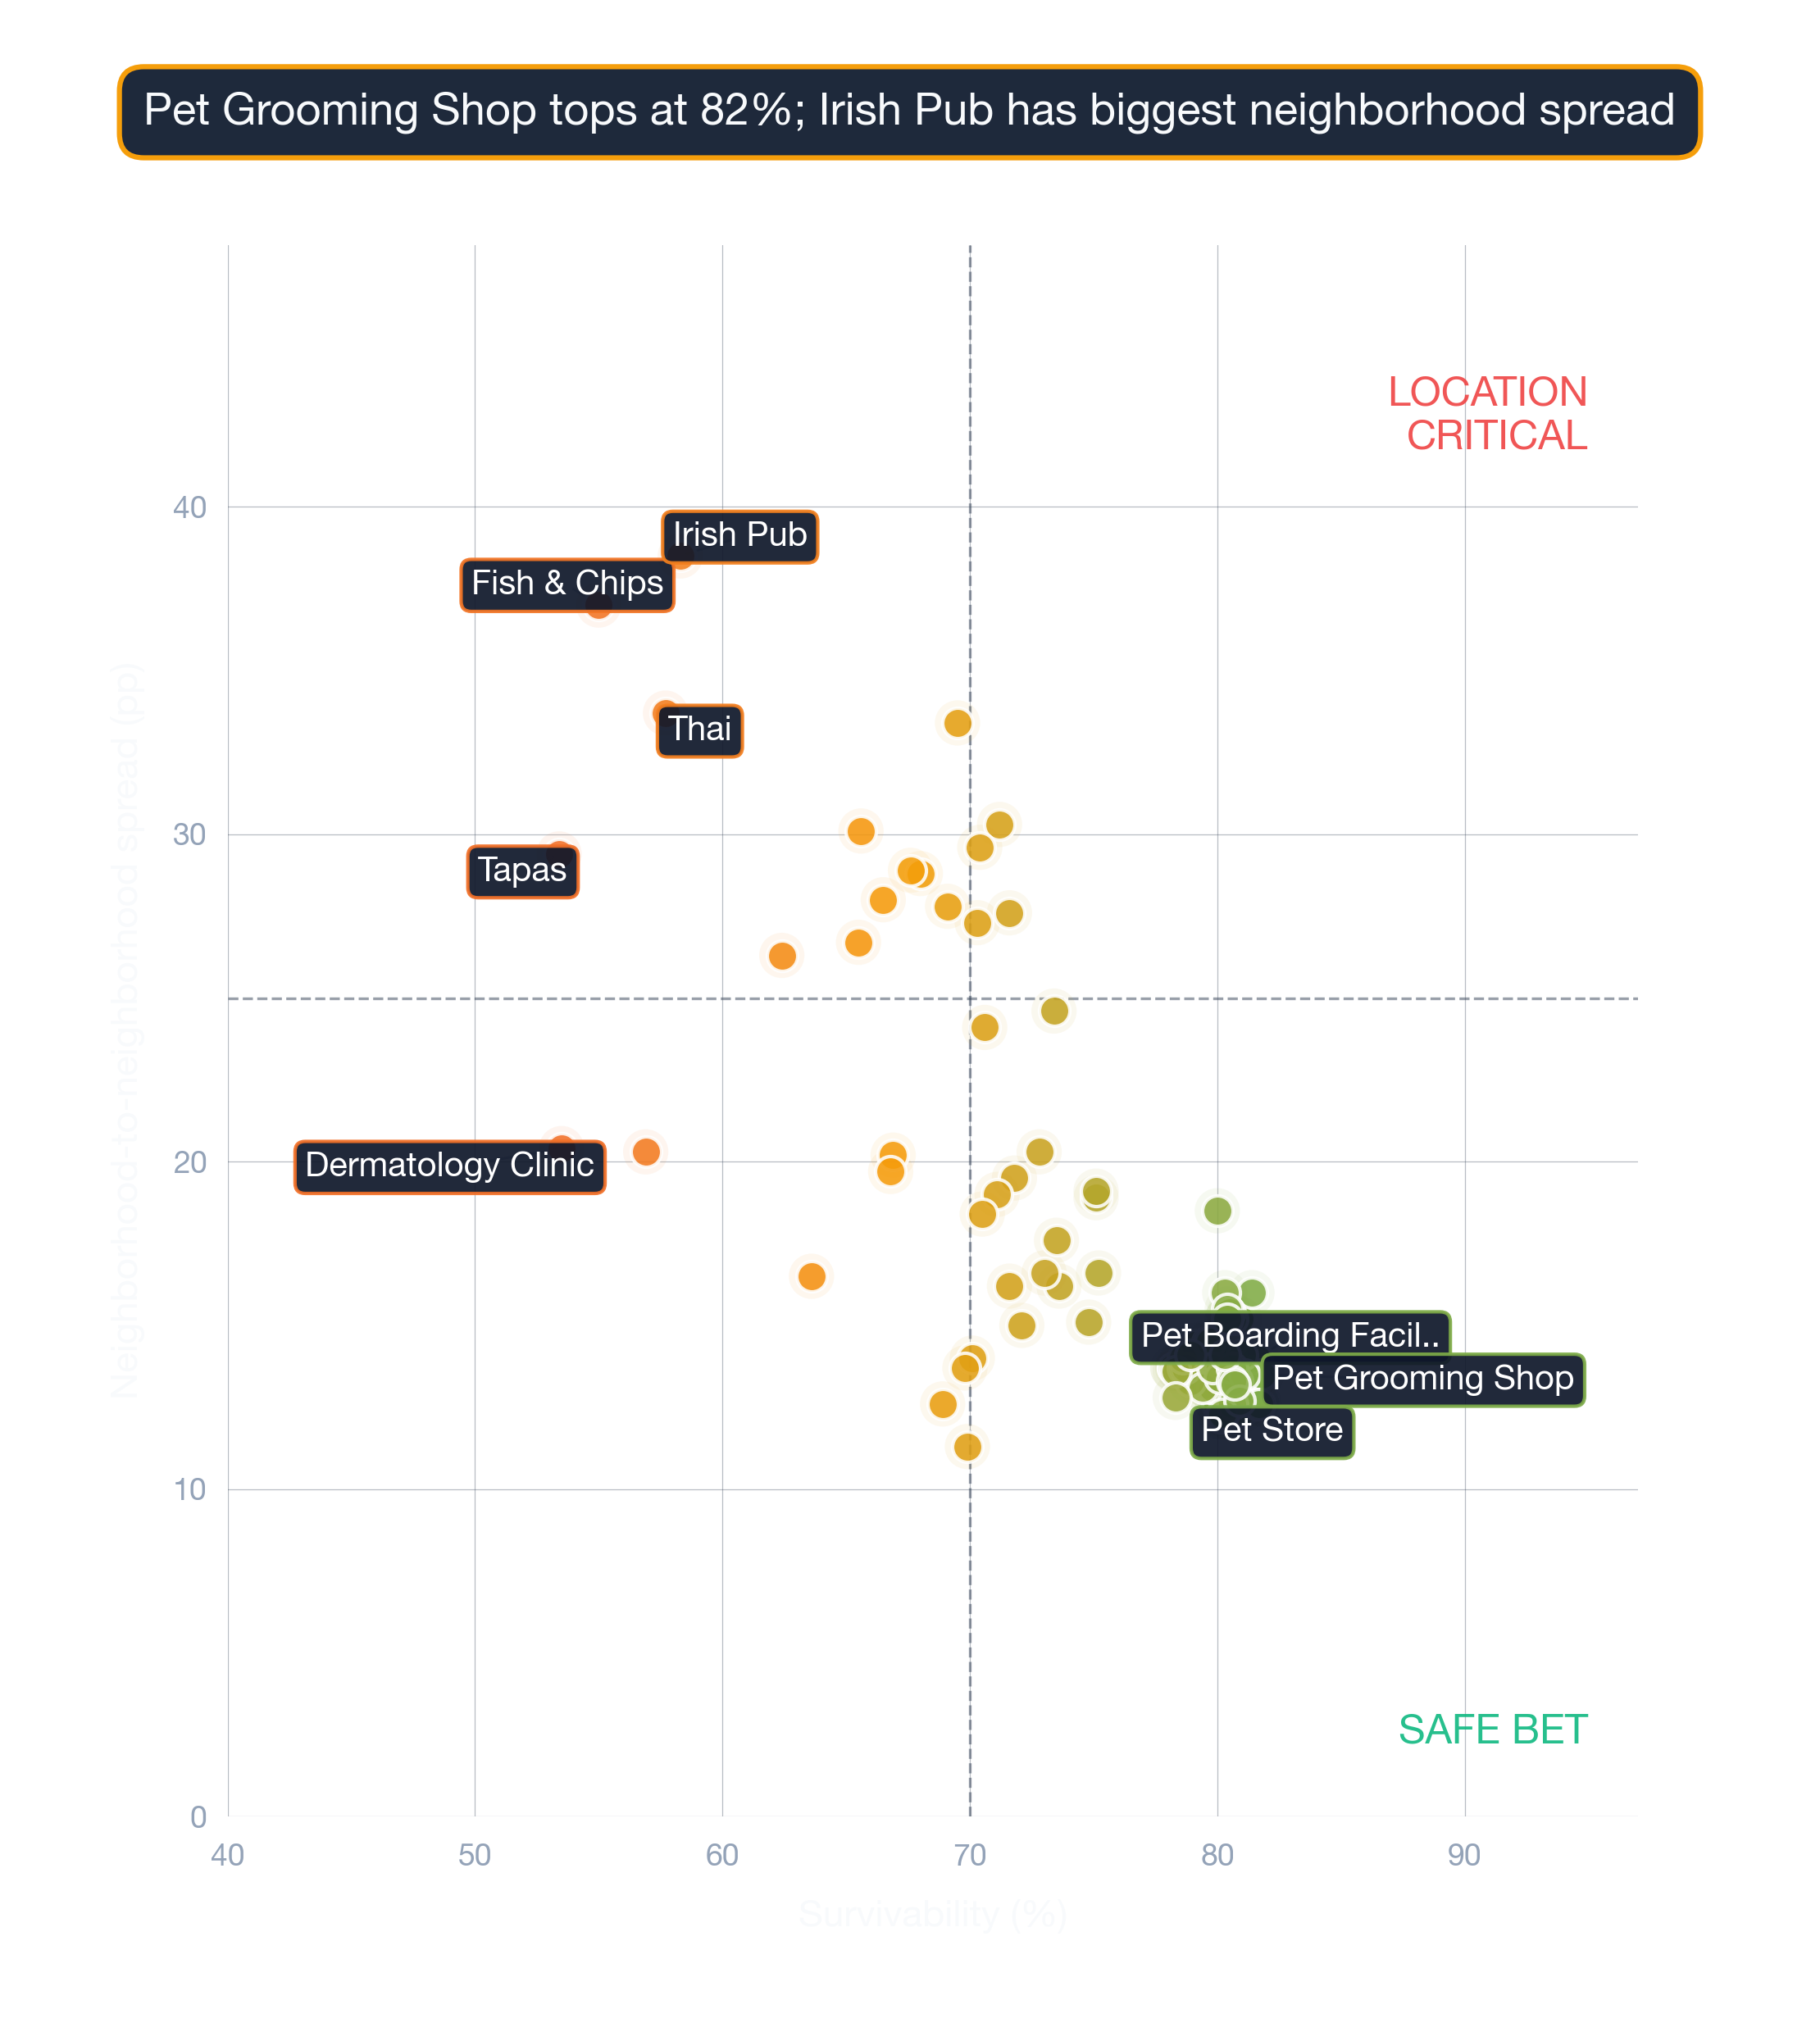
Visual Data
Related Resources
Same business type in other cities:
- City Survivability Rankings for Dance Club
- Survivability Rankings for Dance Club in Atlanta
- National Neighborhood Survivability Rankings for Dance Club
Related:
Local Context FAQ
More questions answered with neighborhood-specific data from our 2026 corpus.
How current is the Dance Clubs data for Boston?
Quarterly. The 2026 corpus shows Dance Clubs in Boston averaging 76%; quarterly refreshes integrate new competitor entries/exits, updated ACS data, and recalibrated lease rates.
What are the key demographic factors for Dance Clubs in Boston?
Boston has a metro median household income of ~$135K and a median age of 41 (ACS data). These two factors enter the survivability model alongside competition density, lease economics, and accessibility — the model's average score for Dance Clubs in Boston is 76%.
What factors drive the Boston Dance Clubs score?
StreetSpring's Boston Dance Clubs score blends ~100 site-level factors — competition within 0.25, 0.5, and 2 miles; ACS demographics; commute / accessibility patterns; lease rent rates; and historical survival outcomes. The 76% city average emerges from per-site scoring at every grid block.