Survivability Rankings for Cafe in Boston
StreetSpring's 2026 analysis ranks the best and worst neighborhoods in Boston to open a Cafe, from Fenway (75% survival) to Winchester (48%).
By Bobby Koons | Last reviewed: April 24, 2026 | Updated weekly | Methodology
Quick Summary
- #1 Neighborhood: Fenway — 75% average survivability for Cafe
- Neighborhoods at or above 70%: 14 of 88 analyzed
- City-wide average: 65% for Cafes
- Most challenging area: Winchester at 48%
- Revenue advantage (top vs. avg location): ~14.2% more expected revenue in Fenway
- Data freshness: 2026 data · Full methodology →
Table of Contents
- Summary
- 10 Best Neighborhoods
- Where Would a Cafe Make the Most Money?
- What Should I Consider?
- Where Should I Start?
- FAQ: Best Neighborhoods
- FAQ: Can a Cafe Succeed in Lower-Ranked Areas?
- FAQ: How Often Are Rankings Updated?
- FAQ: Is a Cafe a Good Tenant?
- Landlord Survivability Data
- Best Neighborhoods for Any Business
Summary
Fenway leads Boston's 2026 survivability rankings for Cafe operators with 75% average chance of surviving more than 2 years, with the best locations offering 78% and the most challenging locations in Fenway at 69%. The worst neighborhoods include Winchester with 48% average chance. However, individual locations vary widely, and even in lower-scoring neighborhoods there are pockets that perform exceptionally well.
Which Boston Neighborhoods Are Strongest for Cafes?
Fenway ranks #1 of 88 neighborhoods analyzed in and around Boston for Cafe survivability with a score of 75% as of 2026. The top 10 neighborhoods are:
Why density alone doesn't determine the winner
| Rank | Neighborhood | Best Locations | Average Locations | Challenging Locations |
|---|---|---|---|---|
| 1 | Fenway | 75.0% – 79.0% | 73.1% – 77.0% | 68.0% – 72.0% |
| 2 | Kenmore | 74.0% – 78.0% | 70.9% – 74.8% | 67.0% – 71.0% |
| 3 | North End | 76.0% – 80.0% | 70.1% – 74.0% | 62.0% – 66.0% |
| 4 | Haymarket | 71.0% – 75.0% | 70.0% – 73.9% | 69.0% – 73.0% |
| 5 | North Dorchester | 76.0% – 80.0% | 69.7% – 73.6% | 61.0% – 65.0% |
| 6 | Government Center | 71.0% – 75.0% | 69.6% – 73.6% | 67.0% – 71.0% |
| 7 | Mission Hill | 77.0% – 81.0% | 69.3% – 73.3% | 64.0% – 68.0% |
| 8 | Chinatown | 71.0% – 75.0% | 69.1% – 73.0% | 66.0% – 70.0% |
| 9 | Cambridge | 73.0% – 77.0% | 69.1% – 73.0% | 65.0% – 69.0% |
| 10 | South End | 72.0% – 76.0% | 68.9% – 72.8% | 65.0% – 69.0% |
What the score spread tells you about risk
However, individual locations vary widely, and even in lower-scoring neighborhoods there are pockets that perform exceptionally well. For the most accurate predictions, always check your specific address in StreetSpring's live platform.
Survivability ranges reflect best and worst storefront conditions within each neighborhood. See our full methodology →
Try StreetSpring to see if this location is still the best and see if there are locations to rent in this area right now.
Which Boston Neighborhoods Drive the Highest Cafe Revenue?
In Fenway, the best possible location offers the opportunity of making ~14.2% more than the average location in or around Boston.
On the other hand, in Winchester, the worst possible location could result in making ~26.6% less than the average location in the city.
No amount of marketing or capital can compensate for a poorly chosen location. Opening a Cafe in Boston requires careful location choice. Across 88 neighborhoods analyzed, the overall average survival chance for a new Cafe is 65% for lasting more than 2 years — due to a combination of many factors across competition, consumer spending, and location dynamics. Survivability predictions are business-type-specific because consumer behavior differs fundamentally across categories.
Key Considerations Before Opening a Cafe in Boston
Among all the variables you control, location quality has the biggest downstream impact. A strong Survivability Score is the foundation everything else builds on. Of all the variables StreetSpring analyzes, Revenue Capture Score has the strongest predictive power. StreetSpring computes this by projecting the business's market share, which is based on the quality and quantity of primary, secondary, and tertiary competitors. We have been studying the businesses serving more than 180 million+ Americans. Clustering works when it draws more customers to the area than any single business could alone. StreetSpring leverages exclusive data sources and custom models for these projections.
| Consideration | Common pitfall | What to verify before signing |
|---|---|---|
| Permits & licensing | Assuming a 30-day permit timeline, hitting 90+ days, paying rent on a non-operating storefront. | Call the local zoning office before signing. Confirm your use is already permitted; if not, factor a 2-3 month variance timeline. |
| Outdoor seating / sidewalk use | Signing assuming you can add patio seating, then learning the city requires a separate sidewalk-cafe permit with long lead times. | Check the city's sidewalk-cafe permit process up front. Confirm landlord allows outdoor build-out in the lease language. |
| Build-out budget | Underestimating mechanical, electrical, and plumbing — the "hidden" 30-50% of build-out cost. | Get 3 quotes from licensed contractors and pad budget by +20% for surprises. Confirm landlord TI allowance in writing. |
This can be summarized as:
Revenue Capture Score = Projected Market Share × Forecasted Spend on Specific Business
Related: Survivability Score: How We Calculate It & Why It Matters
StreetSpring recalculates survivability using the latest competitive, demographic, and walkability data. Our live tool reflects the latest competitive landscape — these static rankings may already be slightly out of date.
The Best Place to Start a Cafe in Boston
StreetSpring identifies the strongest markets as Fenway, Kenmore, and North End, while the most challenging neighborhoods would be Winchester, Newton, and Belmont. These averages are directional, not definitive; the best decision comes from analyzing your specific storefront. Market dynamics shift frequently; validate these insights with real-time data from StreetSpring.
Related Articles:
- Business Survivability Rankings: Boston
- Neighborhood Survivability Rankings: Boston
- National City Survivability: Cafe
Top-Survivability Boston Neighborhoods for Cafes
Based on StreetSpring's 2026 analysis, the top neighborhood for a Cafe in Boston is Fenway with 75% average survivability, followed by Kenmore and North End. 14 of 88 neighborhoods analyzed exceed 70% two-year survival.
StreetSpring's Survivability Scores are updated regularly, so the most accurate prediction for your exact storefront is always available in the live tool.
Do Lower-Ranked Boston Neighborhoods Still Work for Cafes?
Yes — neighborhood averages mask significant block-by-block variation. Even in neighborhoods ranked outside the top 10, individual storefronts with strong foot traffic, low direct competition, and favorable lease terms can outperform the area average. Even neighborhoods with modest average scores can harbor exceptional individual locations. Always check your specific address in StreetSpring's live platform for the most accurate prediction.
Refresh Cadence for Boston Cafe Survivability Rankings
StreetSpring recalculates survivability scores regularly using the latest competitive, demographic, and walkability data. Rankings are updated quarterly; the live tool always reflects the most current predictions for any address in Boston.
Is a Cafe a Good Tenant for Boston Landlords?
In Fenway, StreetSpring forecasts a 73.1% – 77.0% average chance for a new Cafe to survive more than 2 years, depending on the exact storefront. Check the current Survivability Score for any address instantly.
Landlord Survivability Data for Cafe in Boston
For landlords evaluating tenant applications, StreetSpring's data provides a clear comparison across the top neighborhoods. In Fenway, a Cafe has a 73.1% – 77.0% average chance of surviving more than 2 years. In Kenmore, the range shifts to 70.9% – 74.8%, and in North End, it is 70.1% – 74.0%. See which business types are most likely to succeed at your property address right now.
Our tool delivers pinpoint accuracy down to the exact storefront location for any business category.
Related: How Landlord Representatives Can Reduce Vacancy & Increase Tenant Longevity
Where Cafes Thrive in Boston
You can see the best neighborhoods in or around Boston to open any type of business in our article Neighborhood Survivability Rankings: Boston.
Technical note: Aggregated survivability rankings for Boston are available in machine-readable format for research and integration purposes.
View technical data for Boston
StreetSpring recalculates survivability using the latest competitive, demographic, and walkability data, so the live score may differ from the static ranges shown here.
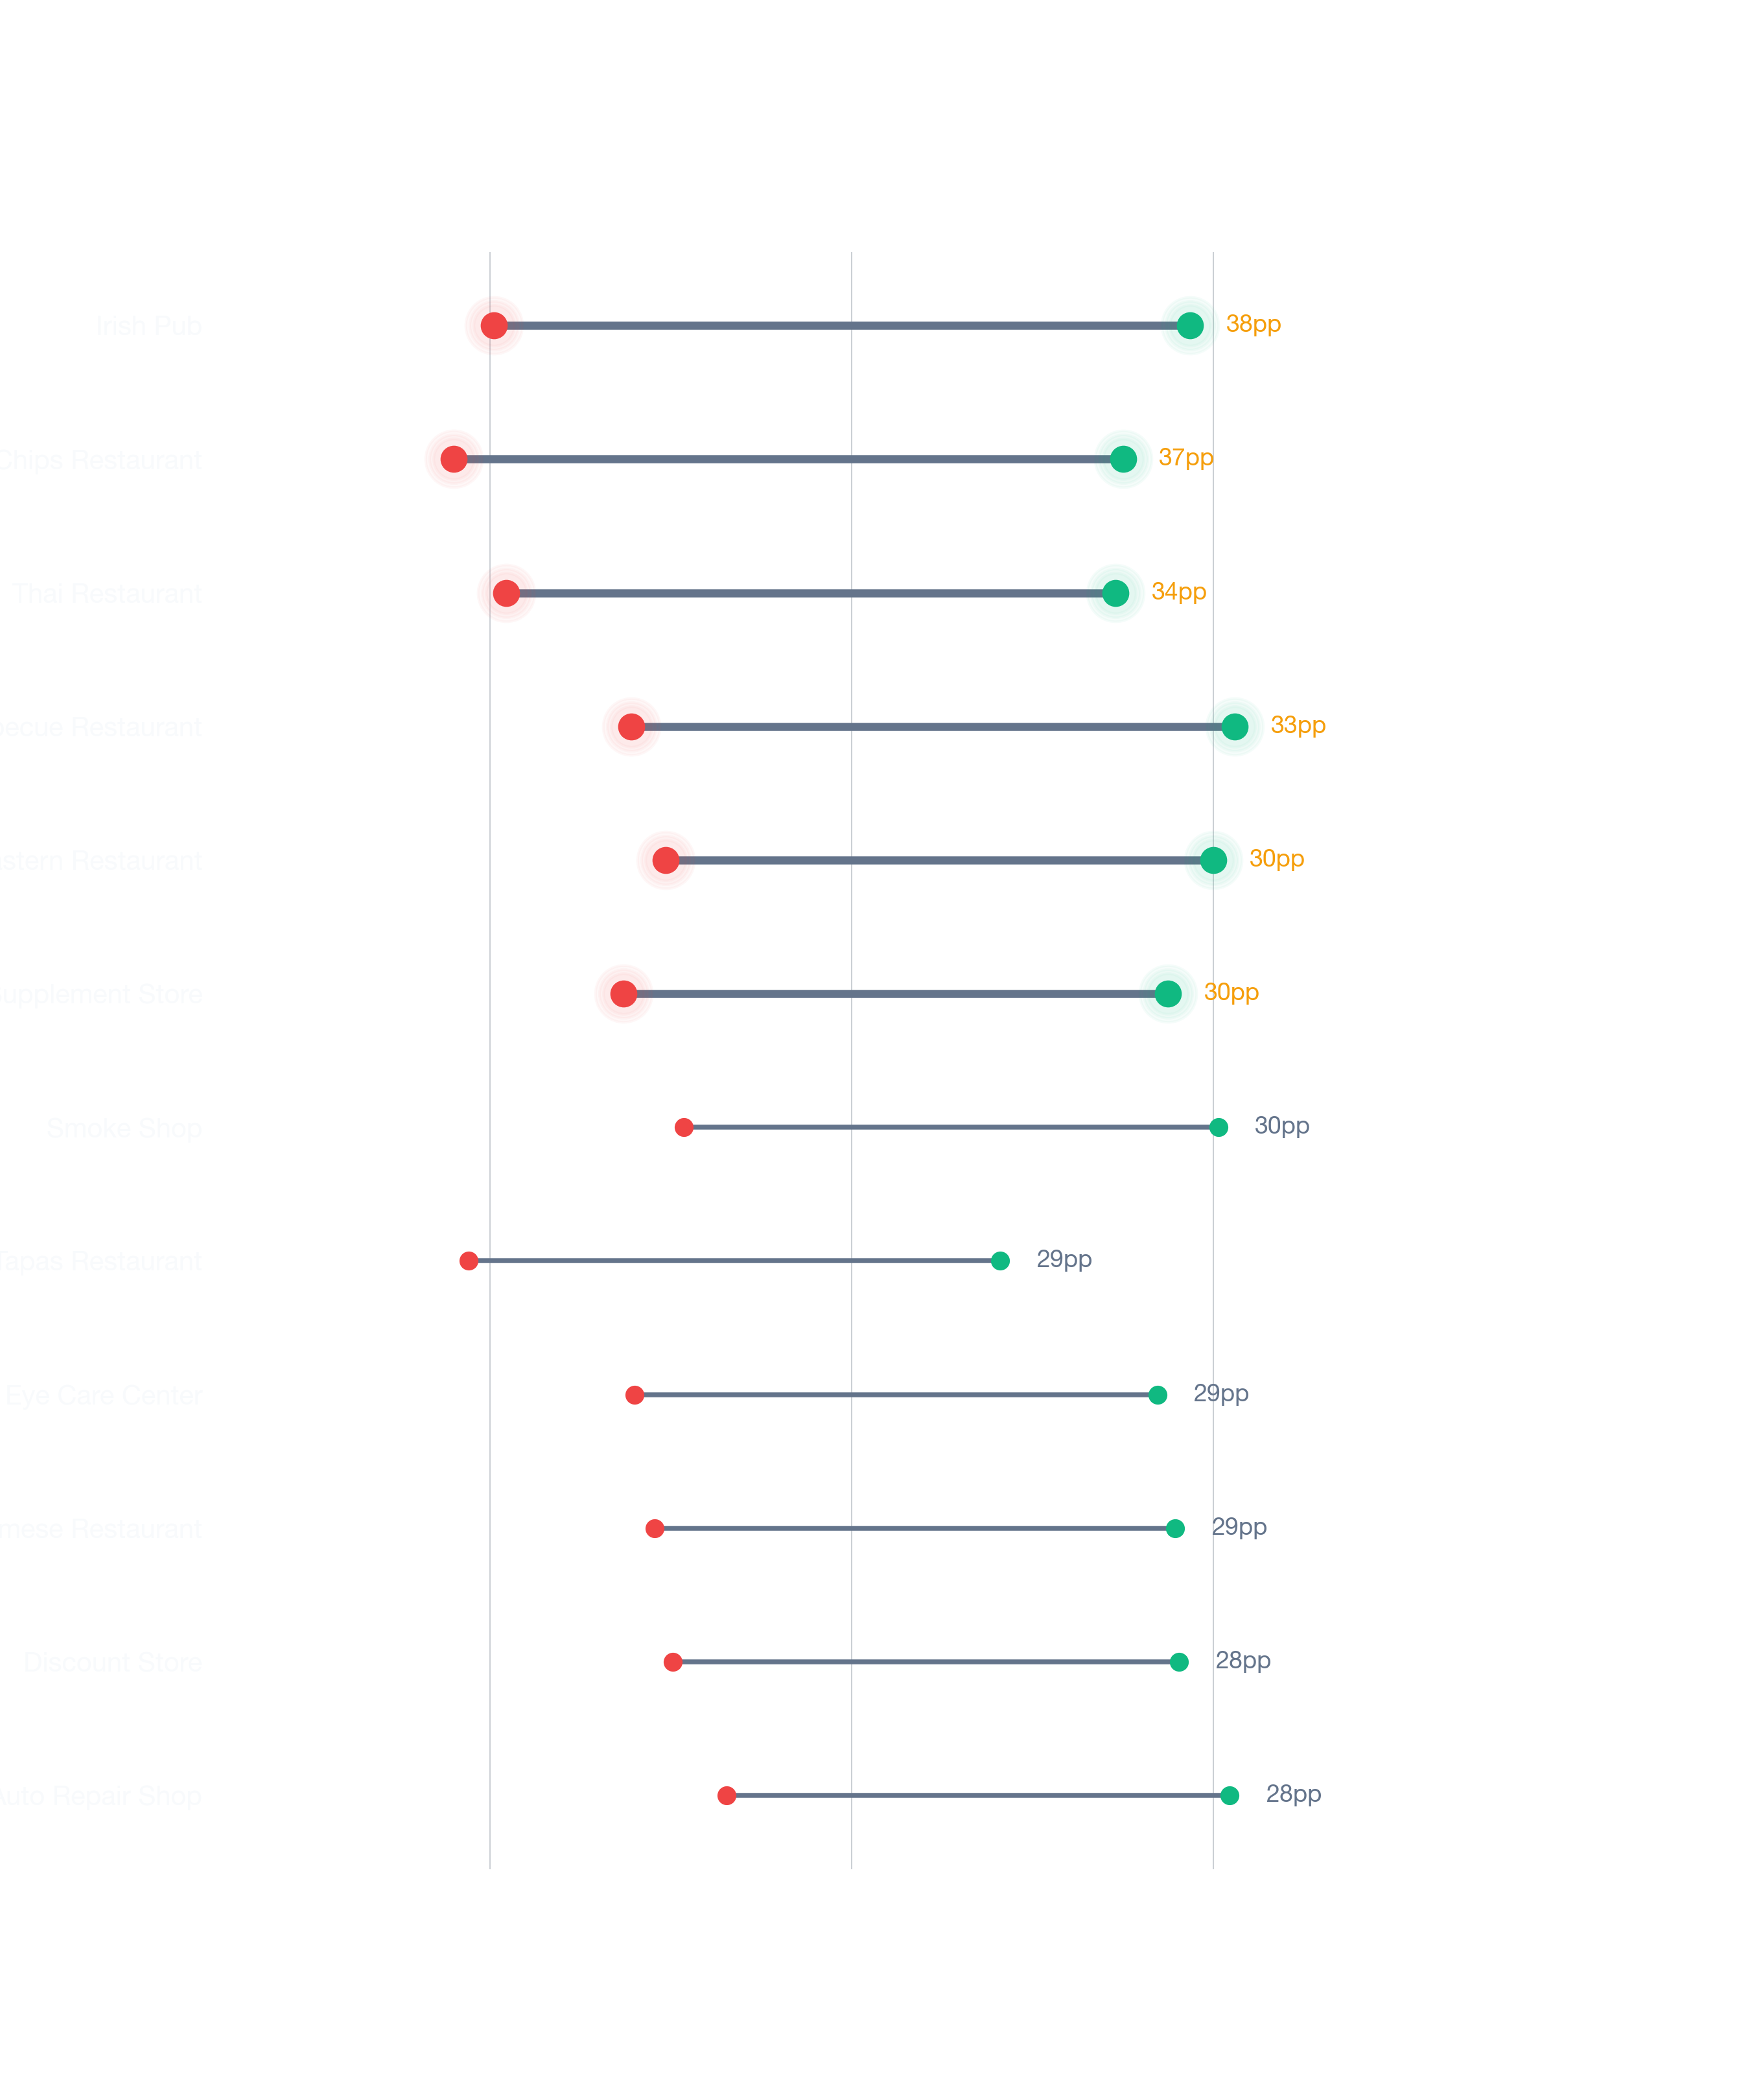
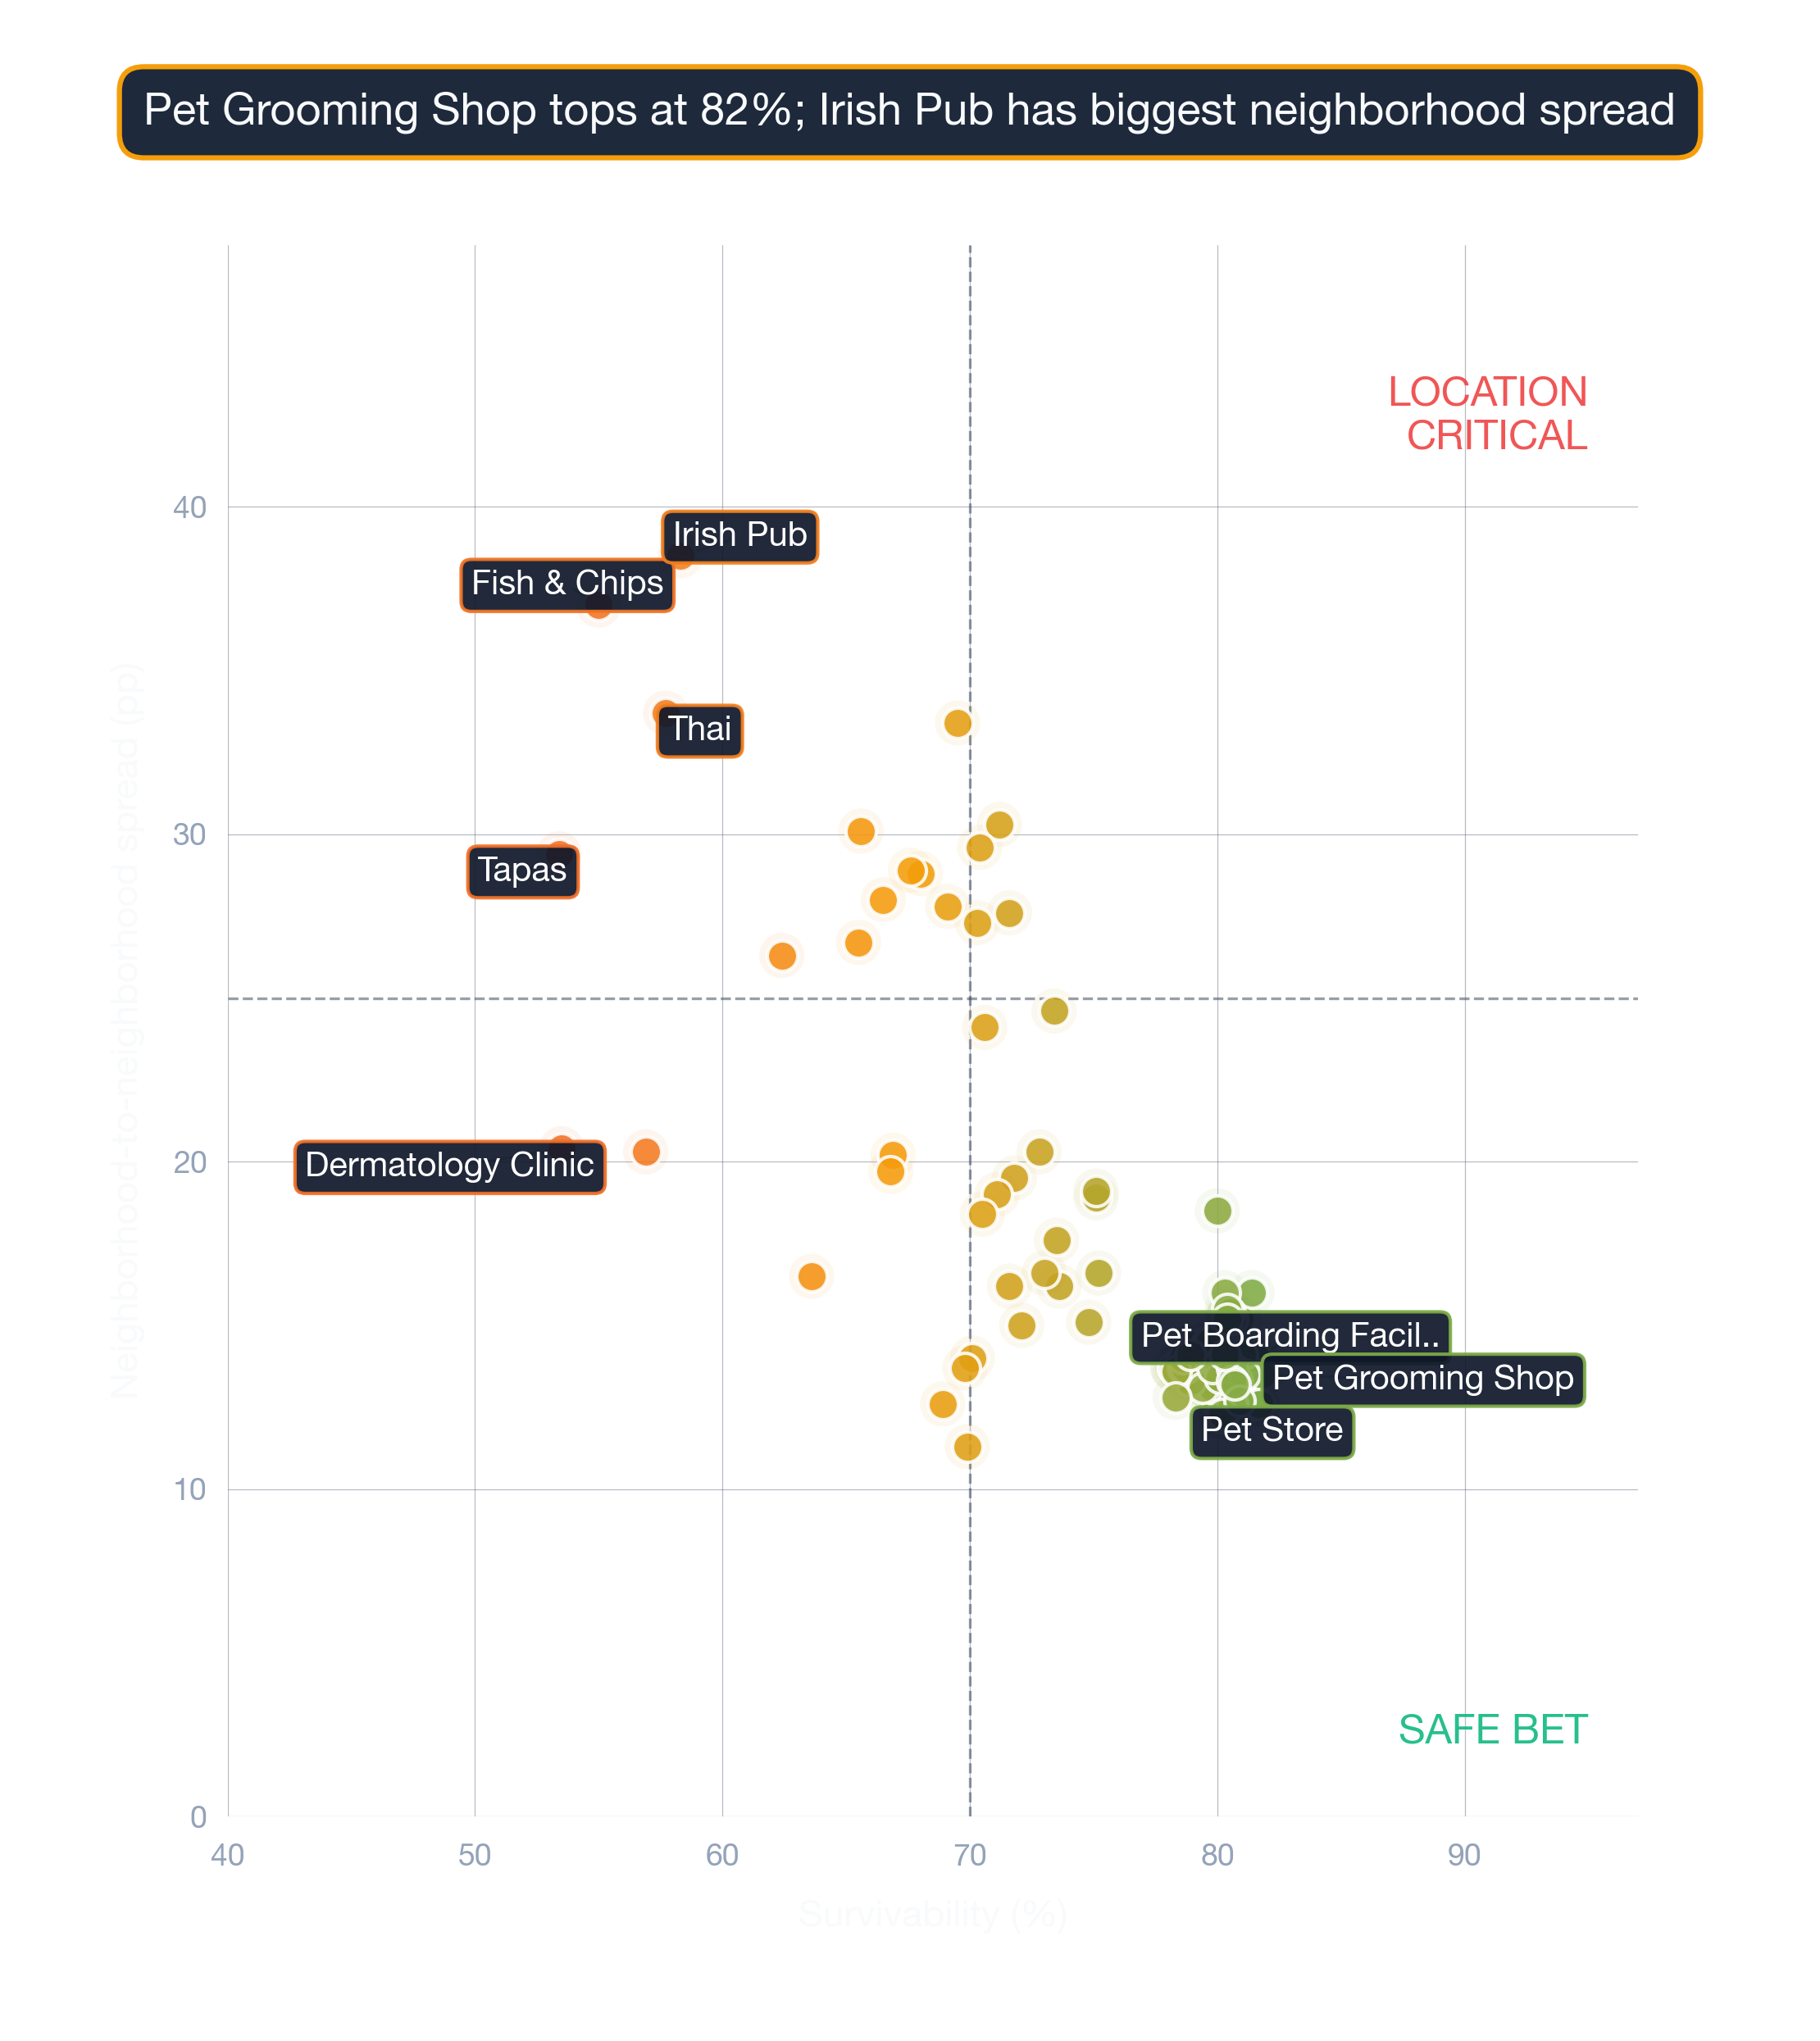
Visual Data
Related Resources
Same business type in other cities:
- City Survivability Rankings for Cafe
- Survivability Rankings for Cafe in Atlanta
- National Neighborhood Survivability Rankings for Cafe
Related:
Neighborhood-Specific Questions
Additional questions with answers drawn directly from local data sources.
What other business types score similarly to Cafes in Boston?
In Boston, business subtypes with survivability averages within 2 points of Cafes (85%) include Bagel Shop, Salad Shop, Pizza Restaurant. Comparable averages suggest similar competitive and demographic drivers at the metro level.
How does Boston Cafe survivability compare to the national BLS baseline?
Per BLS Business Employment Dynamics (March 2025 release), Cafes have a 50% 5-year survival rate nationally. StreetSpring's Boston model averages 85% across tracked locations — above the national baseline by 35 percentage points.
How current is the Cafes data for Boston?
The Boston Cafes survivability corpus refreshes quarterly. The current dataset (2026 release) reflects Boston's ~85% average for this subtype. New competitor openings, closures, and ACS releases are integrated each refresh cycle.
Where in the US do Cafes survive best?
Per StreetSpring's 24-metro model, the top three US cities for Cafes survivability are Portland, San Antonio, St. Louis. Boston ranks #21, averaging 85%.