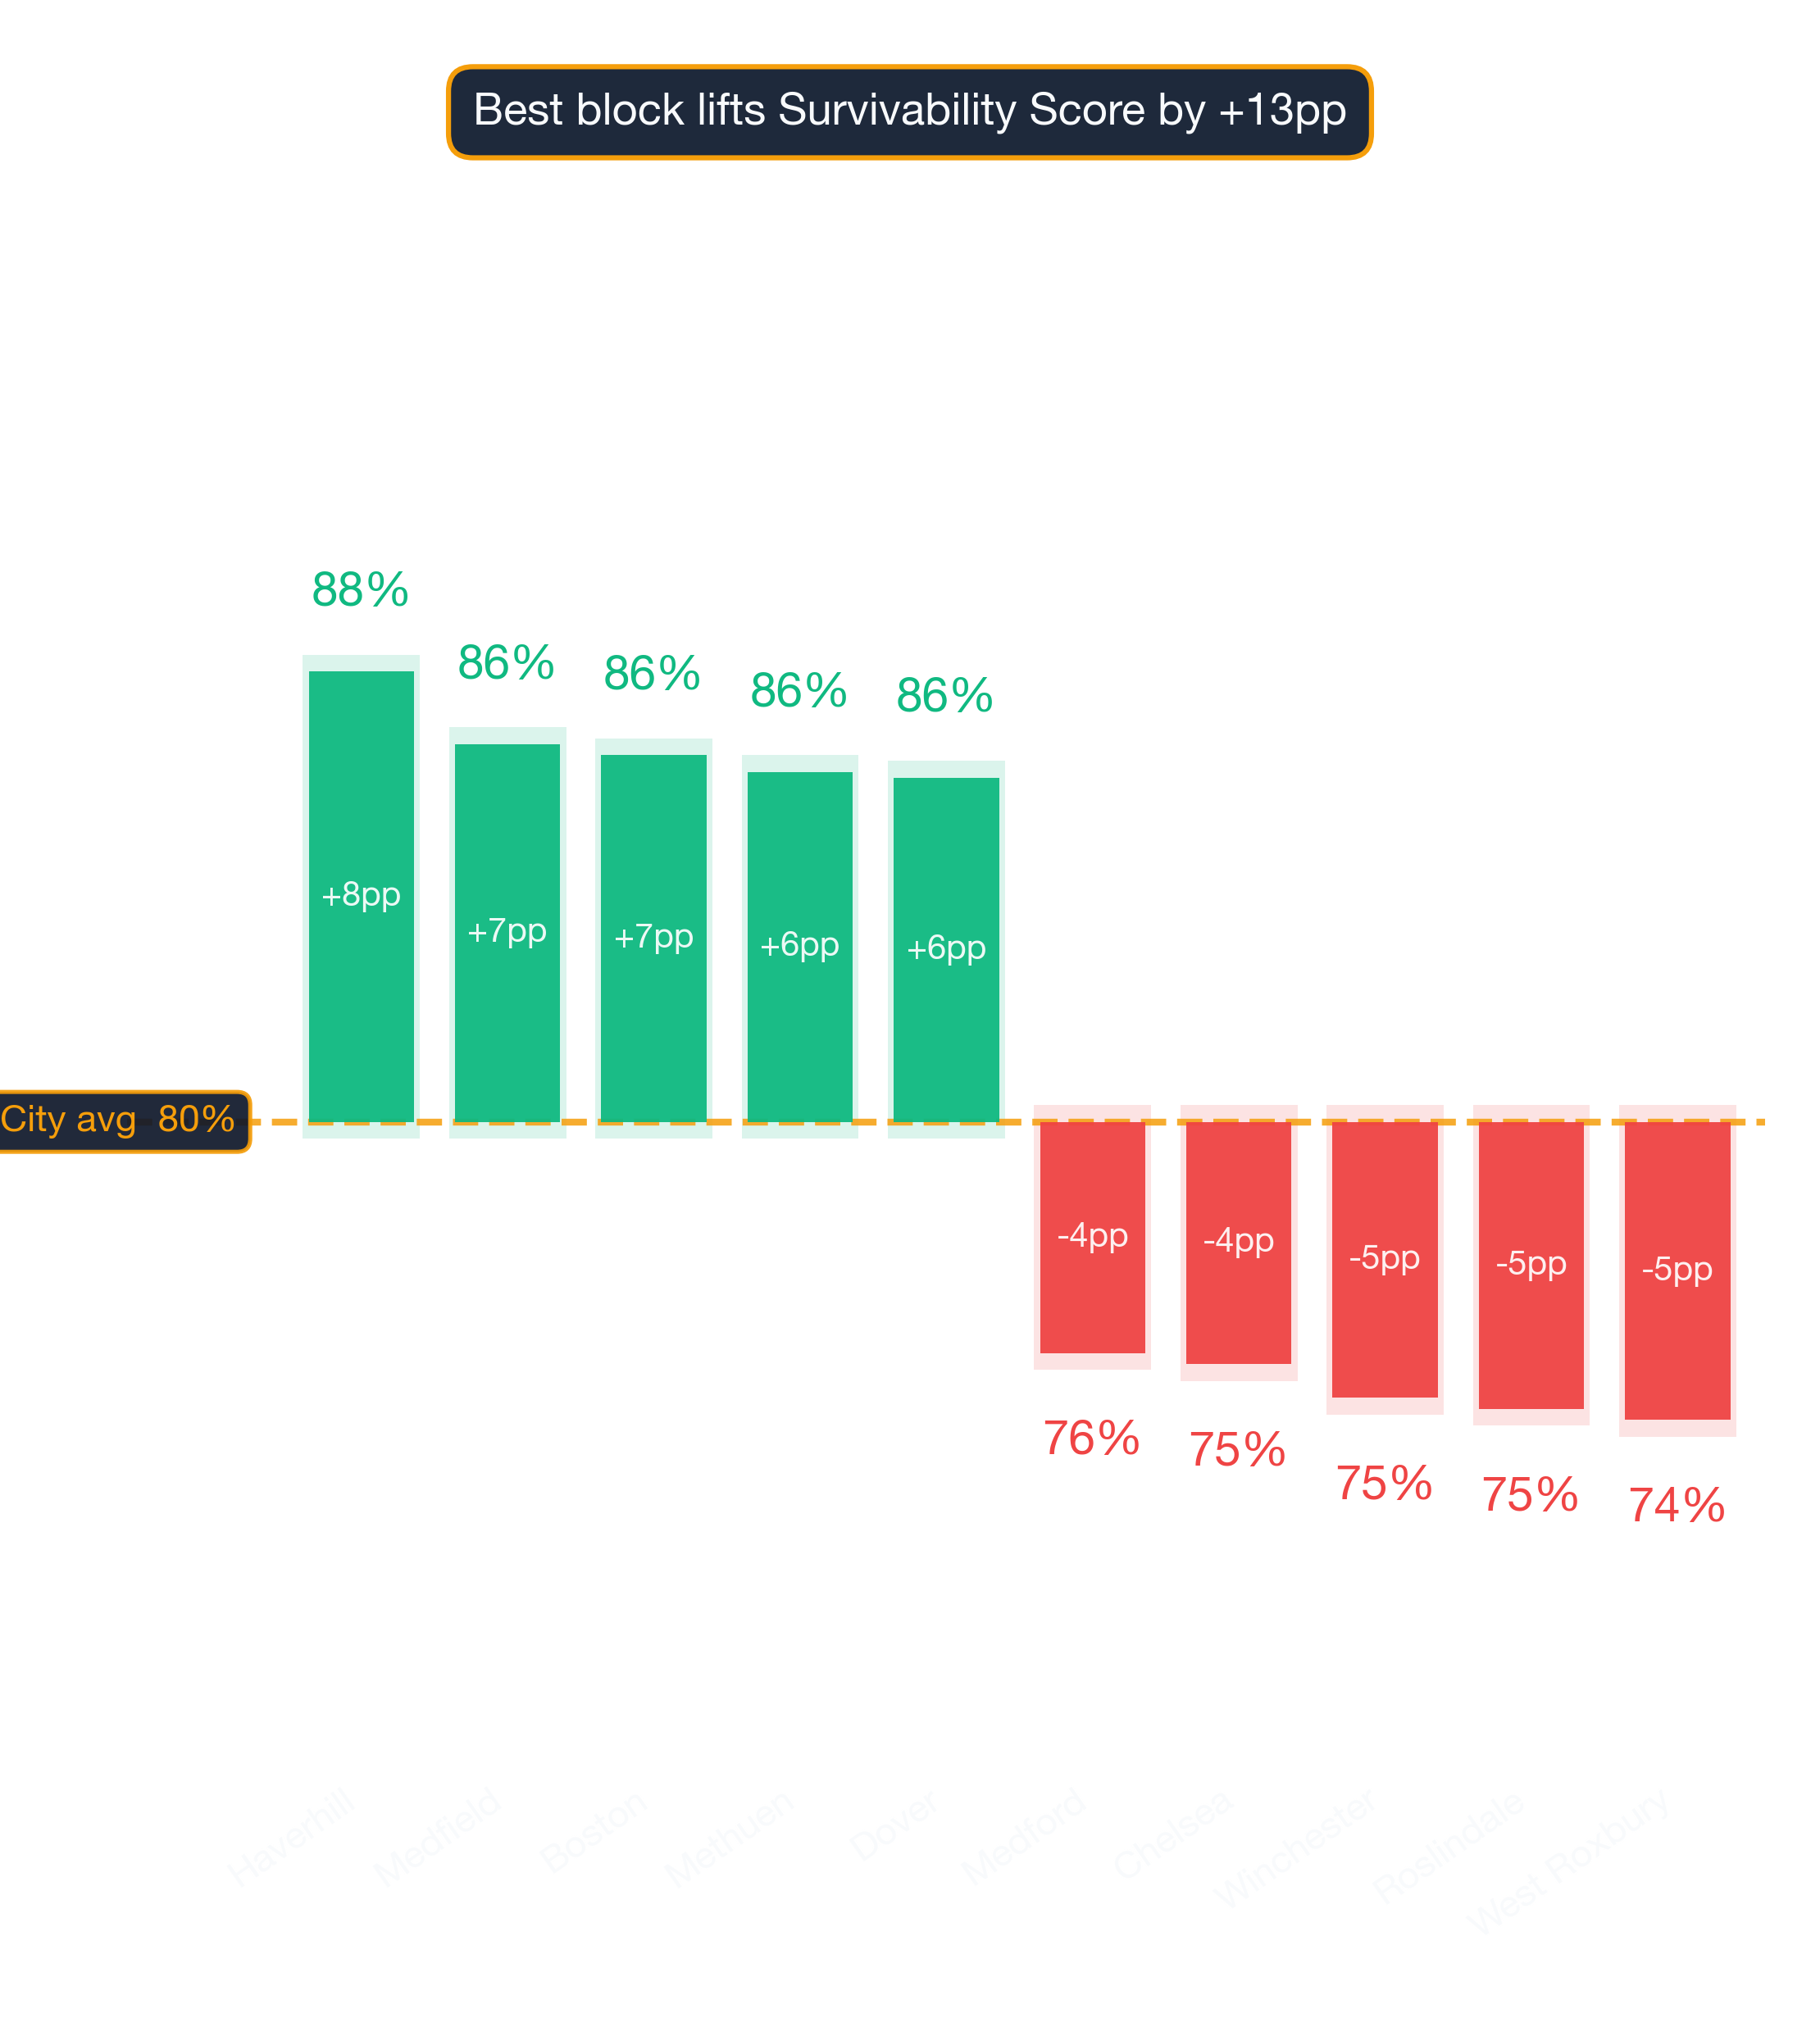
Survivability Rankings for Brunch Restaurant in Boston
StreetSpring's 2026 analysis ranks the best and worst neighborhoods in Boston to open a Brunch Restaurant, from Haverhill (88% survival) to West Roxbury...
By Bobby Koons | Reviewed: May 14, 2026 | Refreshed weekly | Methodology
Quick Summary
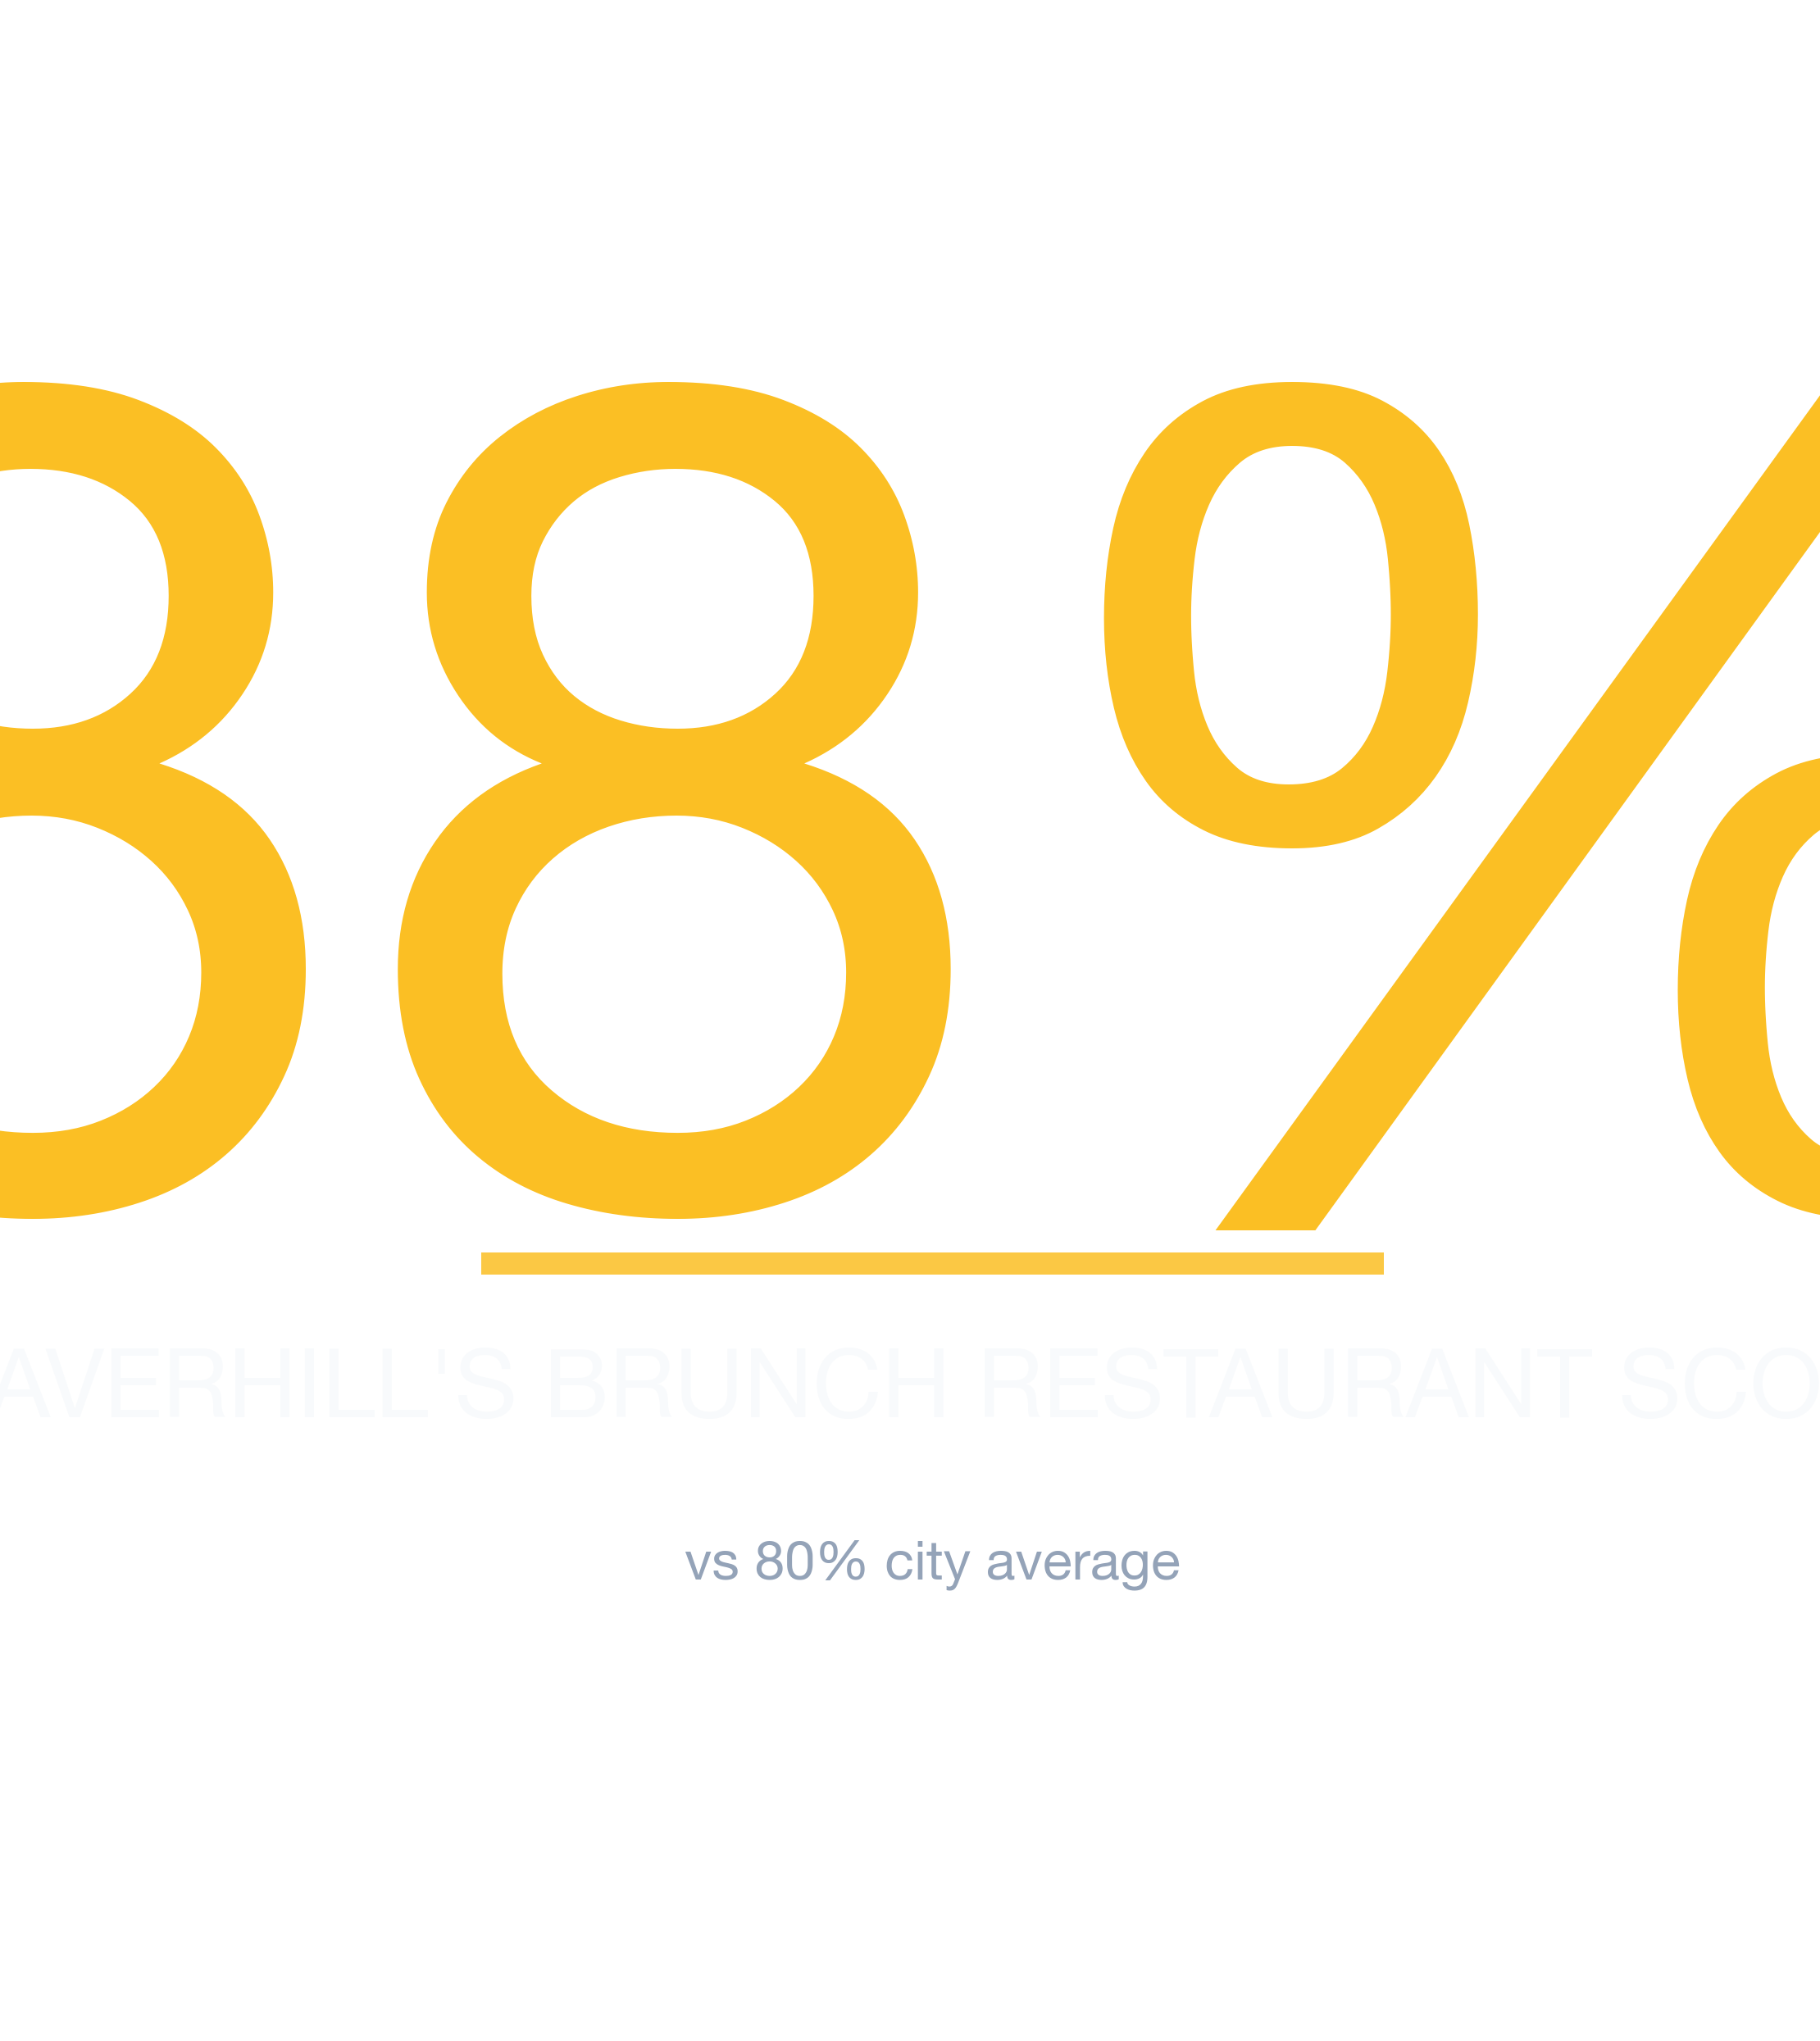
- #1 Neighborhood: Haverhill — 88% average survivability for Brunch Restaurant
- Neighborhoods at or above 70%: 88 of 88 analyzed
- City-wide average: 80% for Brunch Restaurants
- Most challenging area: West Roxbury at 74%
- Revenue advantage (top vs. avg location): ~10.1% more expected revenue in Haverhill
- Data freshness: 2026 data · Full methodology →
Table of Contents
- Summary
- 10 Best Neighborhoods
- Where Would a Brunch Restaurant Make the Most Money?
- What Should I Consider?
- Where Should I Start?
- FAQ: Best Neighborhoods
- FAQ: Can a Brunch Restaurant Succeed in Lower-Ranked Areas?
- FAQ: How Often Are Rankings Updated?
- FAQ: Is a Brunch Restaurant a Good Tenant?
- Landlord Survivability Data
- Best Neighborhoods for Any Business
Summary
Haverhill leads Boston's 2026 survivability rankings for Brunch Restaurant operators with 88% average chance of surviving more than 2 years, with the best locations offering 97% and the most challenging locations in Haverhill at 66%. The worst neighborhoods include West Roxbury with 74% average chance. StreetSpring's Survivability Scores are updated regularly, so the most accurate prediction for your exact storefront is always available in the live tool.
Where in Boston Should You Open a Brunch Restaurant?
Haverhill ranks #1 of 88 neighborhoods analyzed in and around Boston for Brunch Restaurant survivability with a score of 88% as of 2026. The top 10 neighborhoods are:
How rent and competition shape the leaderboard
| Rank | Neighborhood | Best Locations | Average Locations | Challenging Locations |
|---|---|---|---|---|
| 1 | Haverhill | 94.0% – 97.0% | 85.6% – 90.0% | 65.0% – 69.0% |
| 2 | Medfield | 95.0% – 97.0% | 84.3% – 88.8% | 62.0% – 66.0% |
| 3 | Boston | 89.0% – 93.0% | 84.1% – 88.5% | 69.0% – 73.0% |
| 4 | Methuen | 94.0% – 97.0% | 83.8% – 88.3% | 66.0% – 70.0% |
| 5 | Dover | 94.0% – 97.0% | 83.8% – 88.2% | 66.0% – 70.0% |
| 6 | Needham | 95.0% – 97.0% | 83.2% – 87.7% | 64.0% – 68.0% |
| 7 | Lowell | 94.0% – 97.0% | 82.8% – 87.2% | 66.0% – 70.0% |
| 8 | Merrymount | 90.0% – 94.0% | 81.9% – 86.3% | 69.0% – 73.0% |
| 9 | Adams Shore | 92.0% – 96.0% | 81.2% – 85.7% | 68.0% – 72.0% |
| 10 | Brockton | 92.0% – 96.0% | 81.1% – 85.6% | 65.0% – 69.0% |
Where the rankings might surprise you
These rankings are based on the latest available data; check StreetSpring for real-time updates. For the most accurate predictions, always check your specific address in StreetSpring's live platform.
Survivability ranges reflect best and worst storefront conditions within each neighborhood. See our full methodology →
Try StreetSpring to see if this location is still the best and see if there are locations to rent in this area right now.
Which Boston Neighborhoods Drive the Highest Brunch Restaurant Revenue?
In Haverhill, the best possible location offers the opportunity of making ~10.1% more than the average location in or around Boston.
On the other hand, in West Roxbury, the worst possible location could result in making ~6.7% less than the average location in the city.
Nothing influences a business's future more than its location. Opening a Brunch Restaurant in Boston requires careful location choice. Across 88 neighborhoods analyzed, the overall average survival chance for a new Brunch Restaurant is 80% for lasting more than 2 years — due to a combination of many factors across competition, consumer spending, and location dynamics. Two businesses on the same block can have very different survivability scores depending on their category.
The Most Important Factors for a Brunch Restaurant in Boston
There is no operational fix for a poorly chosen location. Use Survivability Score as a hard filter on candidate addresses before evaluating other factors. Revenue Capture Score matters more than any other single metric when predicting business outcomes. StreetSpring computes this by projecting the business's market share, which is based on the quality and quantity of primary, secondary, and tertiary competitors. We incorporate data from thousands of neighborhoods and hundreds of thousands of individual businesses. Our data shows that businesses in moderately competitive clusters survive longer than isolated storefronts on average. Our forecasting system combines proprietary data with machine learning models unavailable anywhere else.
| Factor | Where new owners get tripped up | Questions to ask before you sign |
|---|---|---|
| Permits & licensing | Assuming a 30-day permit timeline, hitting 90+ days, paying rent on a non-operating storefront. | Call the local zoning office before signing. Confirm your use is already permitted; if not, factor a 2-3 month variance timeline. |
| Workforce availability | Hiring radius is smaller than you think — many neighborhoods can't staff a full team at standard wages. | Pull BLS wage data for your industry in this metro. Walk through your staffing plan with a local restaurant/retail operator before signing. |
| Lease term | Locking into 7-10 years without break clauses, then needing to relocate after year 2. | Negotiate a relocation or termination clause. Confirm assignment + sublease rights are in writing. |
This can be summarized as:
Revenue Capture Score = Projected Market Share × Forecasted Spend on Specific Business
Related: Survivability Score: How We Calculate It & Why It Matters
StreetSpring recalculates survivability using the latest competitive, demographic, and walkability data. Real-time data from StreetSpring accounts for recent openings, closures, and seasonal shifts that static rankings cannot.
The Best Place to Start a Brunch Restaurant in Boston
The highest-performing areas for this business type are Haverhill, Medfield, and Boston, while the most challenging neighborhoods would be West Roxbury, Roslindale, and Winchester. StreetSpring's Survivability Scores are updated regularly, so the most accurate prediction for your exact storefront is always available in the live tool. Market dynamics shift frequently; validate these insights with real-time data from StreetSpring.
Related Articles:
- Business Survivability Rankings: Boston
- Neighborhood Survivability Rankings: Boston
- National City Survivability: Brunch Restaurant
Which Boston Neighborhoods Are Strongest for Brunch Restaurants?
Based on StreetSpring's 2026 analysis, the top neighborhood for a Brunch Restaurant in Boston is Haverhill with 88% average survivability, followed by Medfield and Boston. 88 of 88 neighborhoods analyzed exceed 70% two-year survival.
New competitor openings and closures happen weekly — the live tool ensures you see the latest picture.
Should You Consider Lower-Survivability Areas of Boston for a Brunch Restaurant?
Yes — neighborhood averages mask significant block-by-block variation. Even in neighborhoods ranked outside the top 10, individual storefronts with strong foot traffic, low direct competition, and favorable lease terms can outperform the area average. These rankings are based on the latest available data; check StreetSpring for real-time updates. Always check your specific address in StreetSpring's live platform for the most accurate prediction.
When Does StreetSpring Update Boston Brunch Restaurant Rankings?
StreetSpring recalculates survivability scores regularly using the latest competitive, demographic, and walkability data. Rankings are updated quarterly; the live tool always reflects the most current predictions for any address in Boston.
Is a Brunch Restaurant a Good Tenant for Boston Landlords?
In Haverhill, StreetSpring forecasts a 85.6% – 90.0% average chance for a new Brunch Restaurant to survive more than 2 years, depending on the exact storefront. Check the current Survivability Score for any address instantly.
Landlord Survivability Data for Brunch Restaurant in Boston
If you own commercial property in Boston and are considering a Brunch Restaurant tenant, here is what the data shows: Haverhill properties offer the best survivability outlook (85.6% – 90.0%), Medfield is strong but slightly lower (84.3% – 88.8%), and Boston rounds out the top 3 (84.1% – 88.5%). Check the current Survivability Score for any address instantly.
StreetSpring can give you the precise likelihood that hundreds of different businesses will last at an exact address.
Related: How Landlord Representatives Can Reduce Vacancy & Increase Tenant Longevity
Top-Survivability Boston Neighborhoods for Brunch Restaurants
You can see the best neighborhoods in or around Boston to open any type of business in our article Neighborhood Survivability Rankings: Boston.
Technical note: Aggregated survivability rankings for Boston are available in machine-readable format for research and integration purposes.
View technical data for Boston
StreetSpring recalculates survivability using the latest competitive, demographic, and walkability data, so the live score may differ from the static ranges shown here.
Visual Data
Related Resources
Same business type in other cities:
- City Survivability Rankings for Brunch Restaurant
- Survivability Rankings for Brunch Restaurant in Atlanta
- National Neighborhood Survivability Rankings for Brunch Restaurant
Related:
Neighborhood-Specific Questions
More questions answered with neighborhood-specific data from our 2026 corpus.
Which Boston subtypes have comparable survivability to Brunch Restaurants?
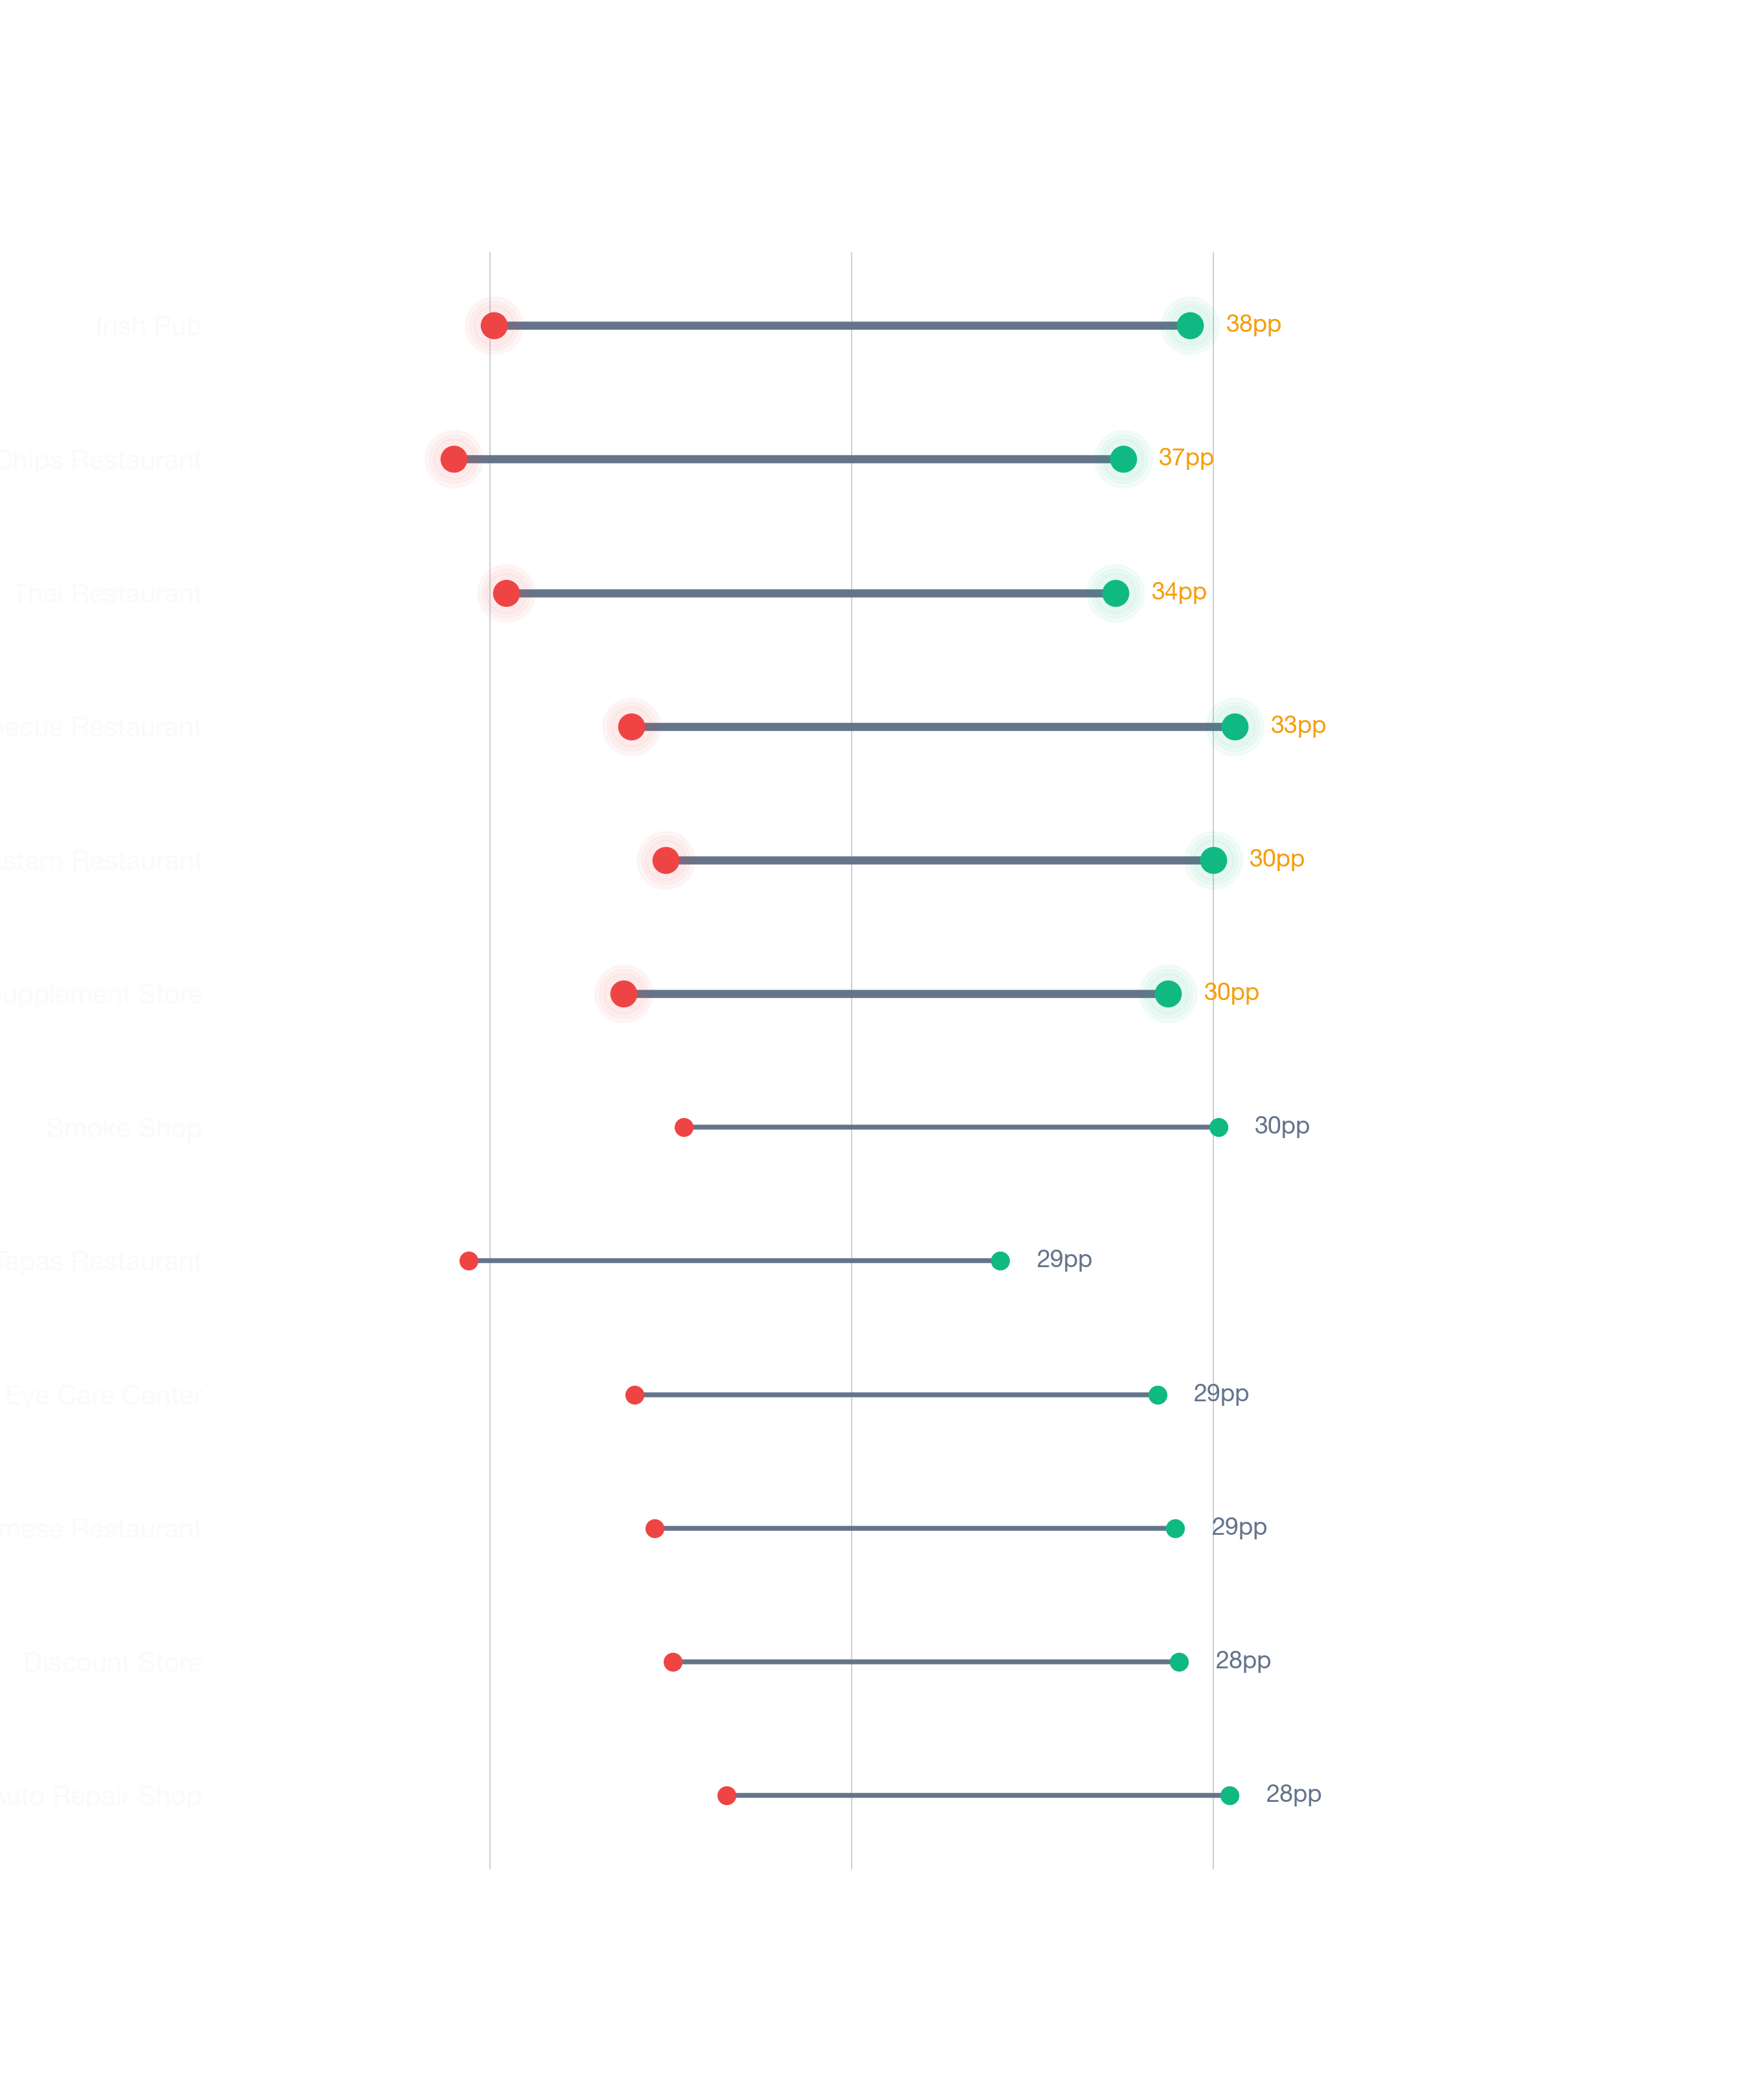
Boston subtypes scoring within 2 points of Brunch Restaurants's 86% average include Bagel Shop, Salad Shop, Pizza Restaurant. Survivability convergence at the metro level usually reflects shared local factors like saturation density or demographic fit.
How many Boston neighborhoods has StreetSpring scored for Brunch Restaurants?
StreetSpring's Boston model covers Brunch Restaurants across all tracked neighborhoods — the average score is 86%, with neighborhood-level scores spanning 57-99%. Real-time scores at the address level capture finer variation than these neighborhood averages.
Where should an aspiring Boston Brunch Restaurant owner focus first?
The address you sign for. Across Boston, Brunch Restaurants score 57-99% depending on location — a 42-point spread that captures competitive density, demographic fit, accessibility, and visibility at each storefront.