Survivability Rankings for Brazilian Restaurant in Boston
StreetSpring's 2026 analysis ranks the best and worst neighborhoods in Boston to open a Brazilian Restaurant, from Haverhill (87% survival) to West Roxb...
By Bobby Koons | Reviewed: May 9, 2026 | Refreshed weekly | Methodology
Quick Summary
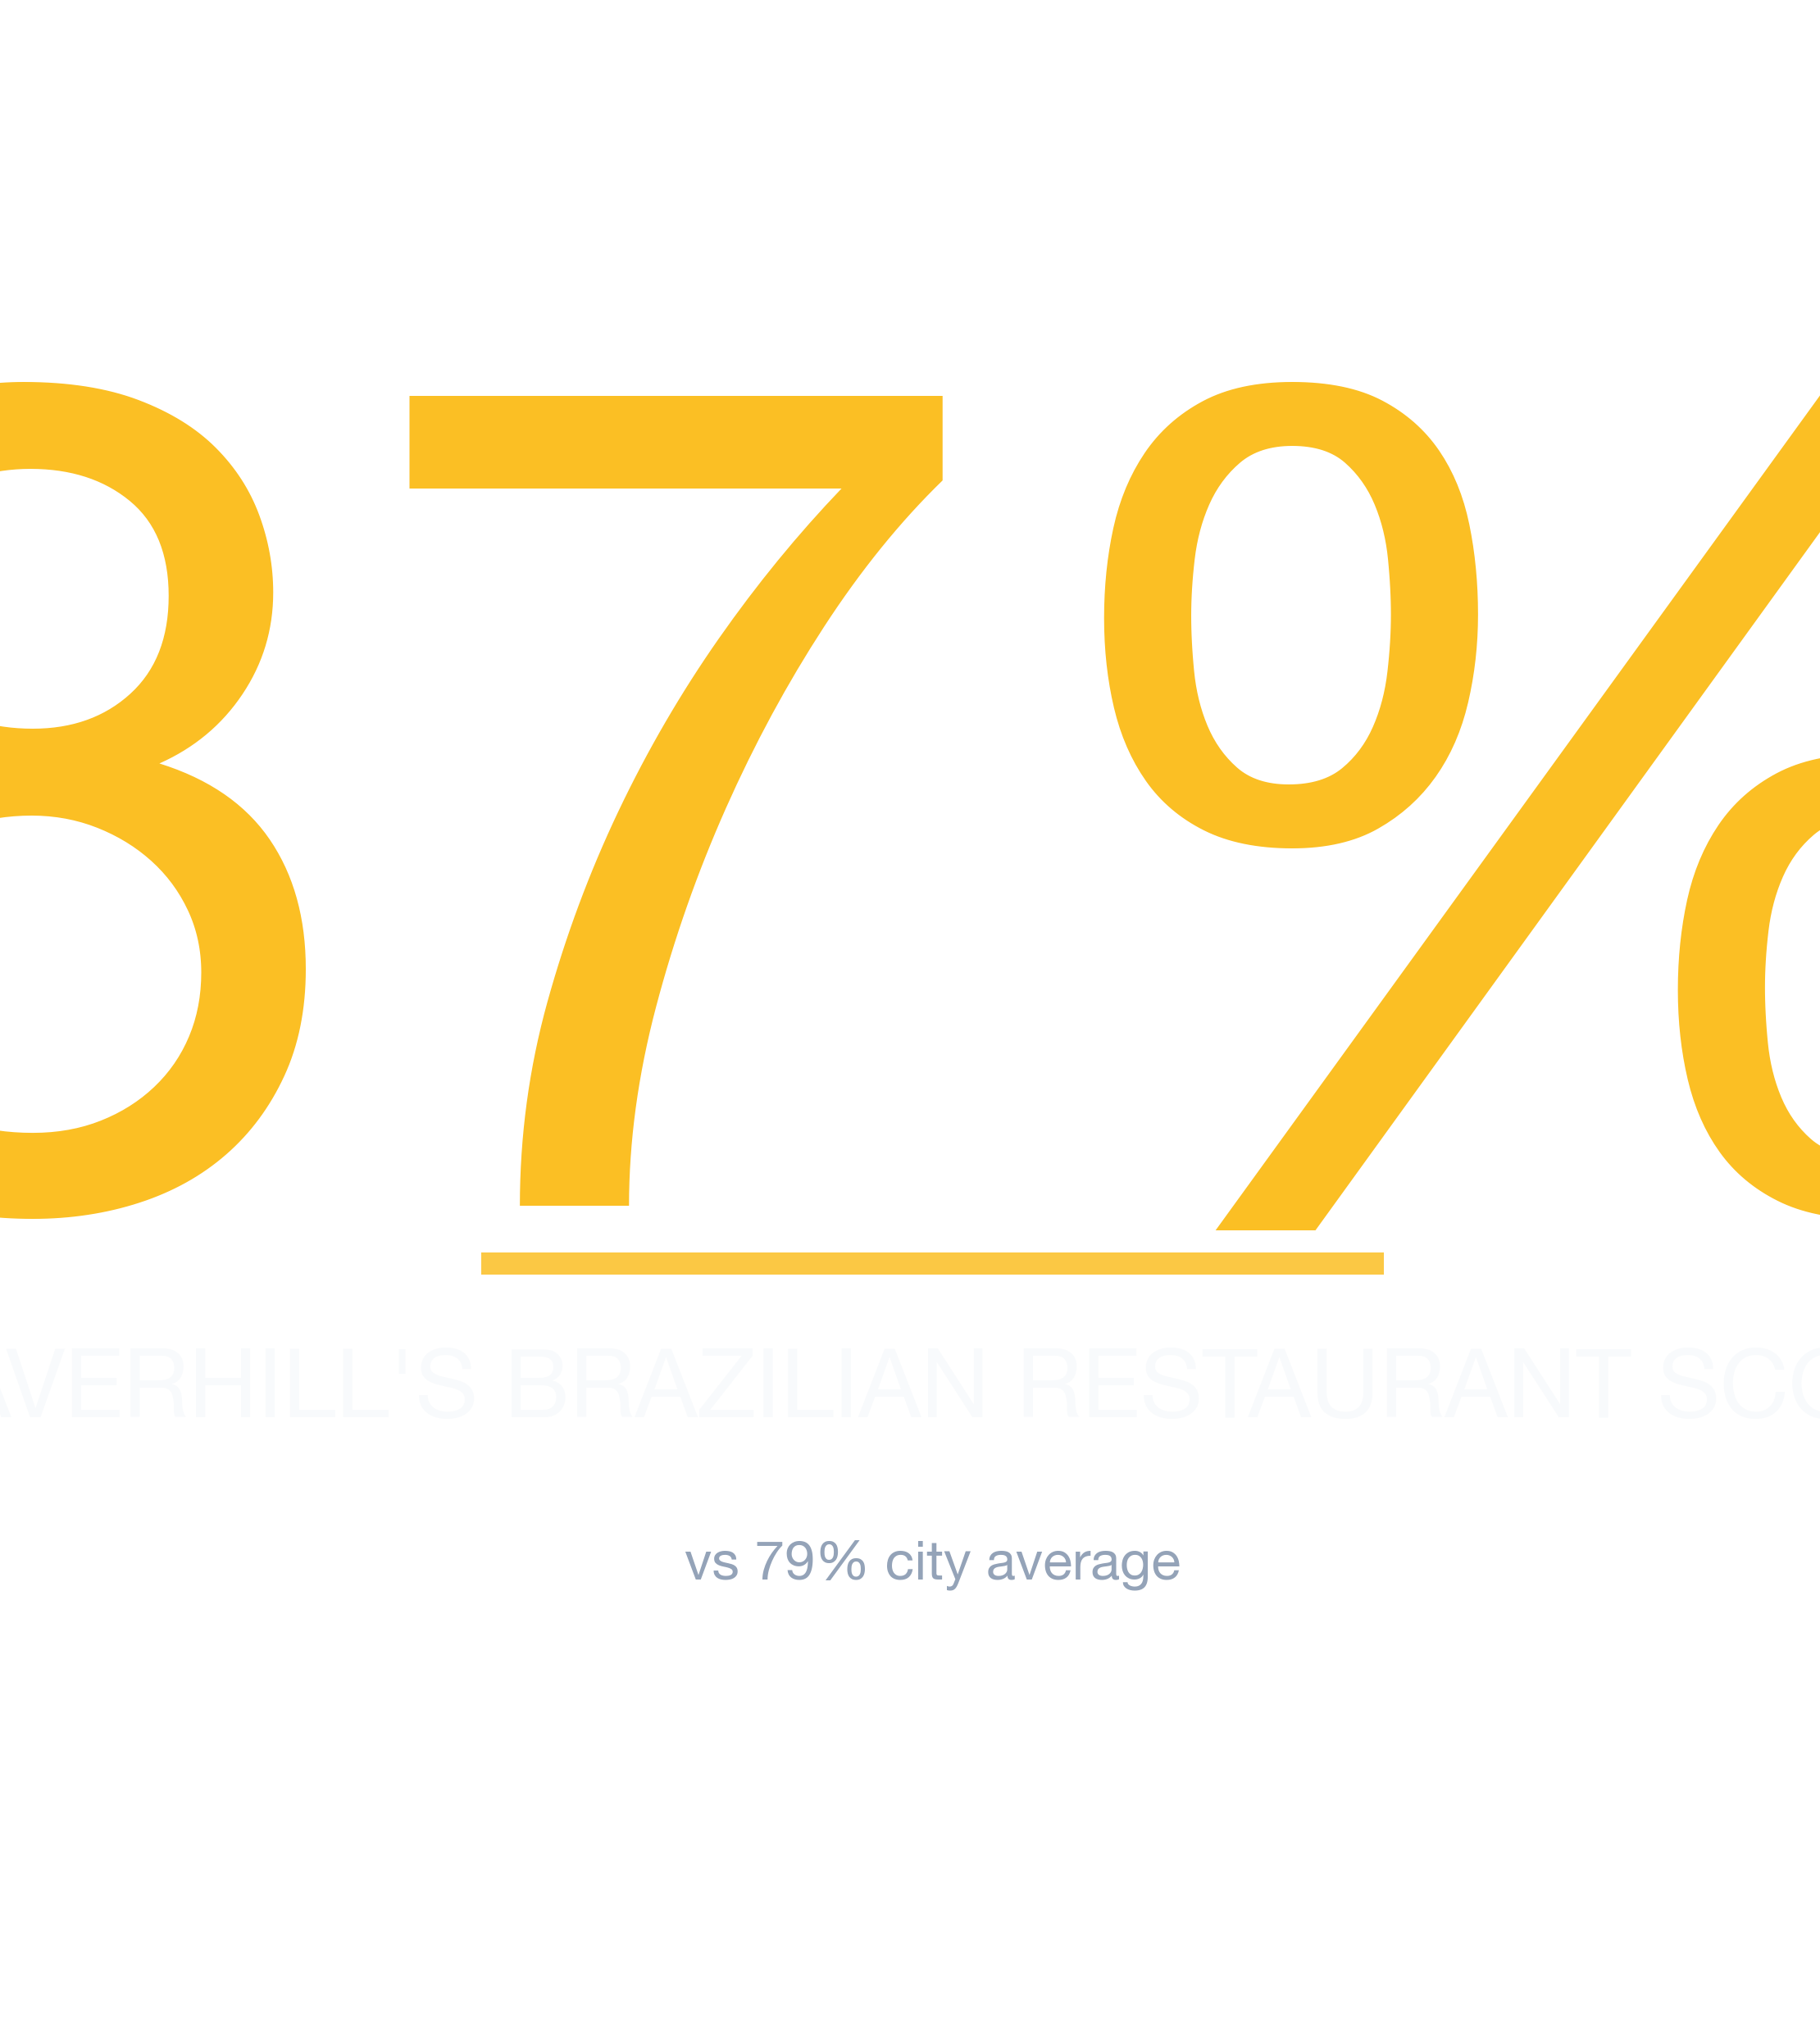
- #1 Neighborhood: Haverhill — 87% average survivability for Brazilian Restaurant
- Neighborhoods at or above 70%: 88 of 88 analyzed
- City-wide average: 79% for Brazilian Restaurants
- Most challenging area: West Roxbury at 74%
- Revenue advantage (top vs. avg location): ~10.5% more expected revenue in Haverhill
- Data freshness: 2026 data · Full methodology →
Table of Contents
- Summary
- 10 Best Neighborhoods
- Where Would a Brazilian Restaurant Make the Most Money?
- What Should I Consider?
- Where Should I Start?
- FAQ: Best Neighborhoods
- FAQ: Can a Brazilian Restaurant Succeed in Lower-Ranked Areas?
- FAQ: How Often Are Rankings Updated?
- FAQ: Is a Brazilian Restaurant a Good Tenant?
- Landlord Survivability Data
- Best Neighborhoods for Any Business
Summary
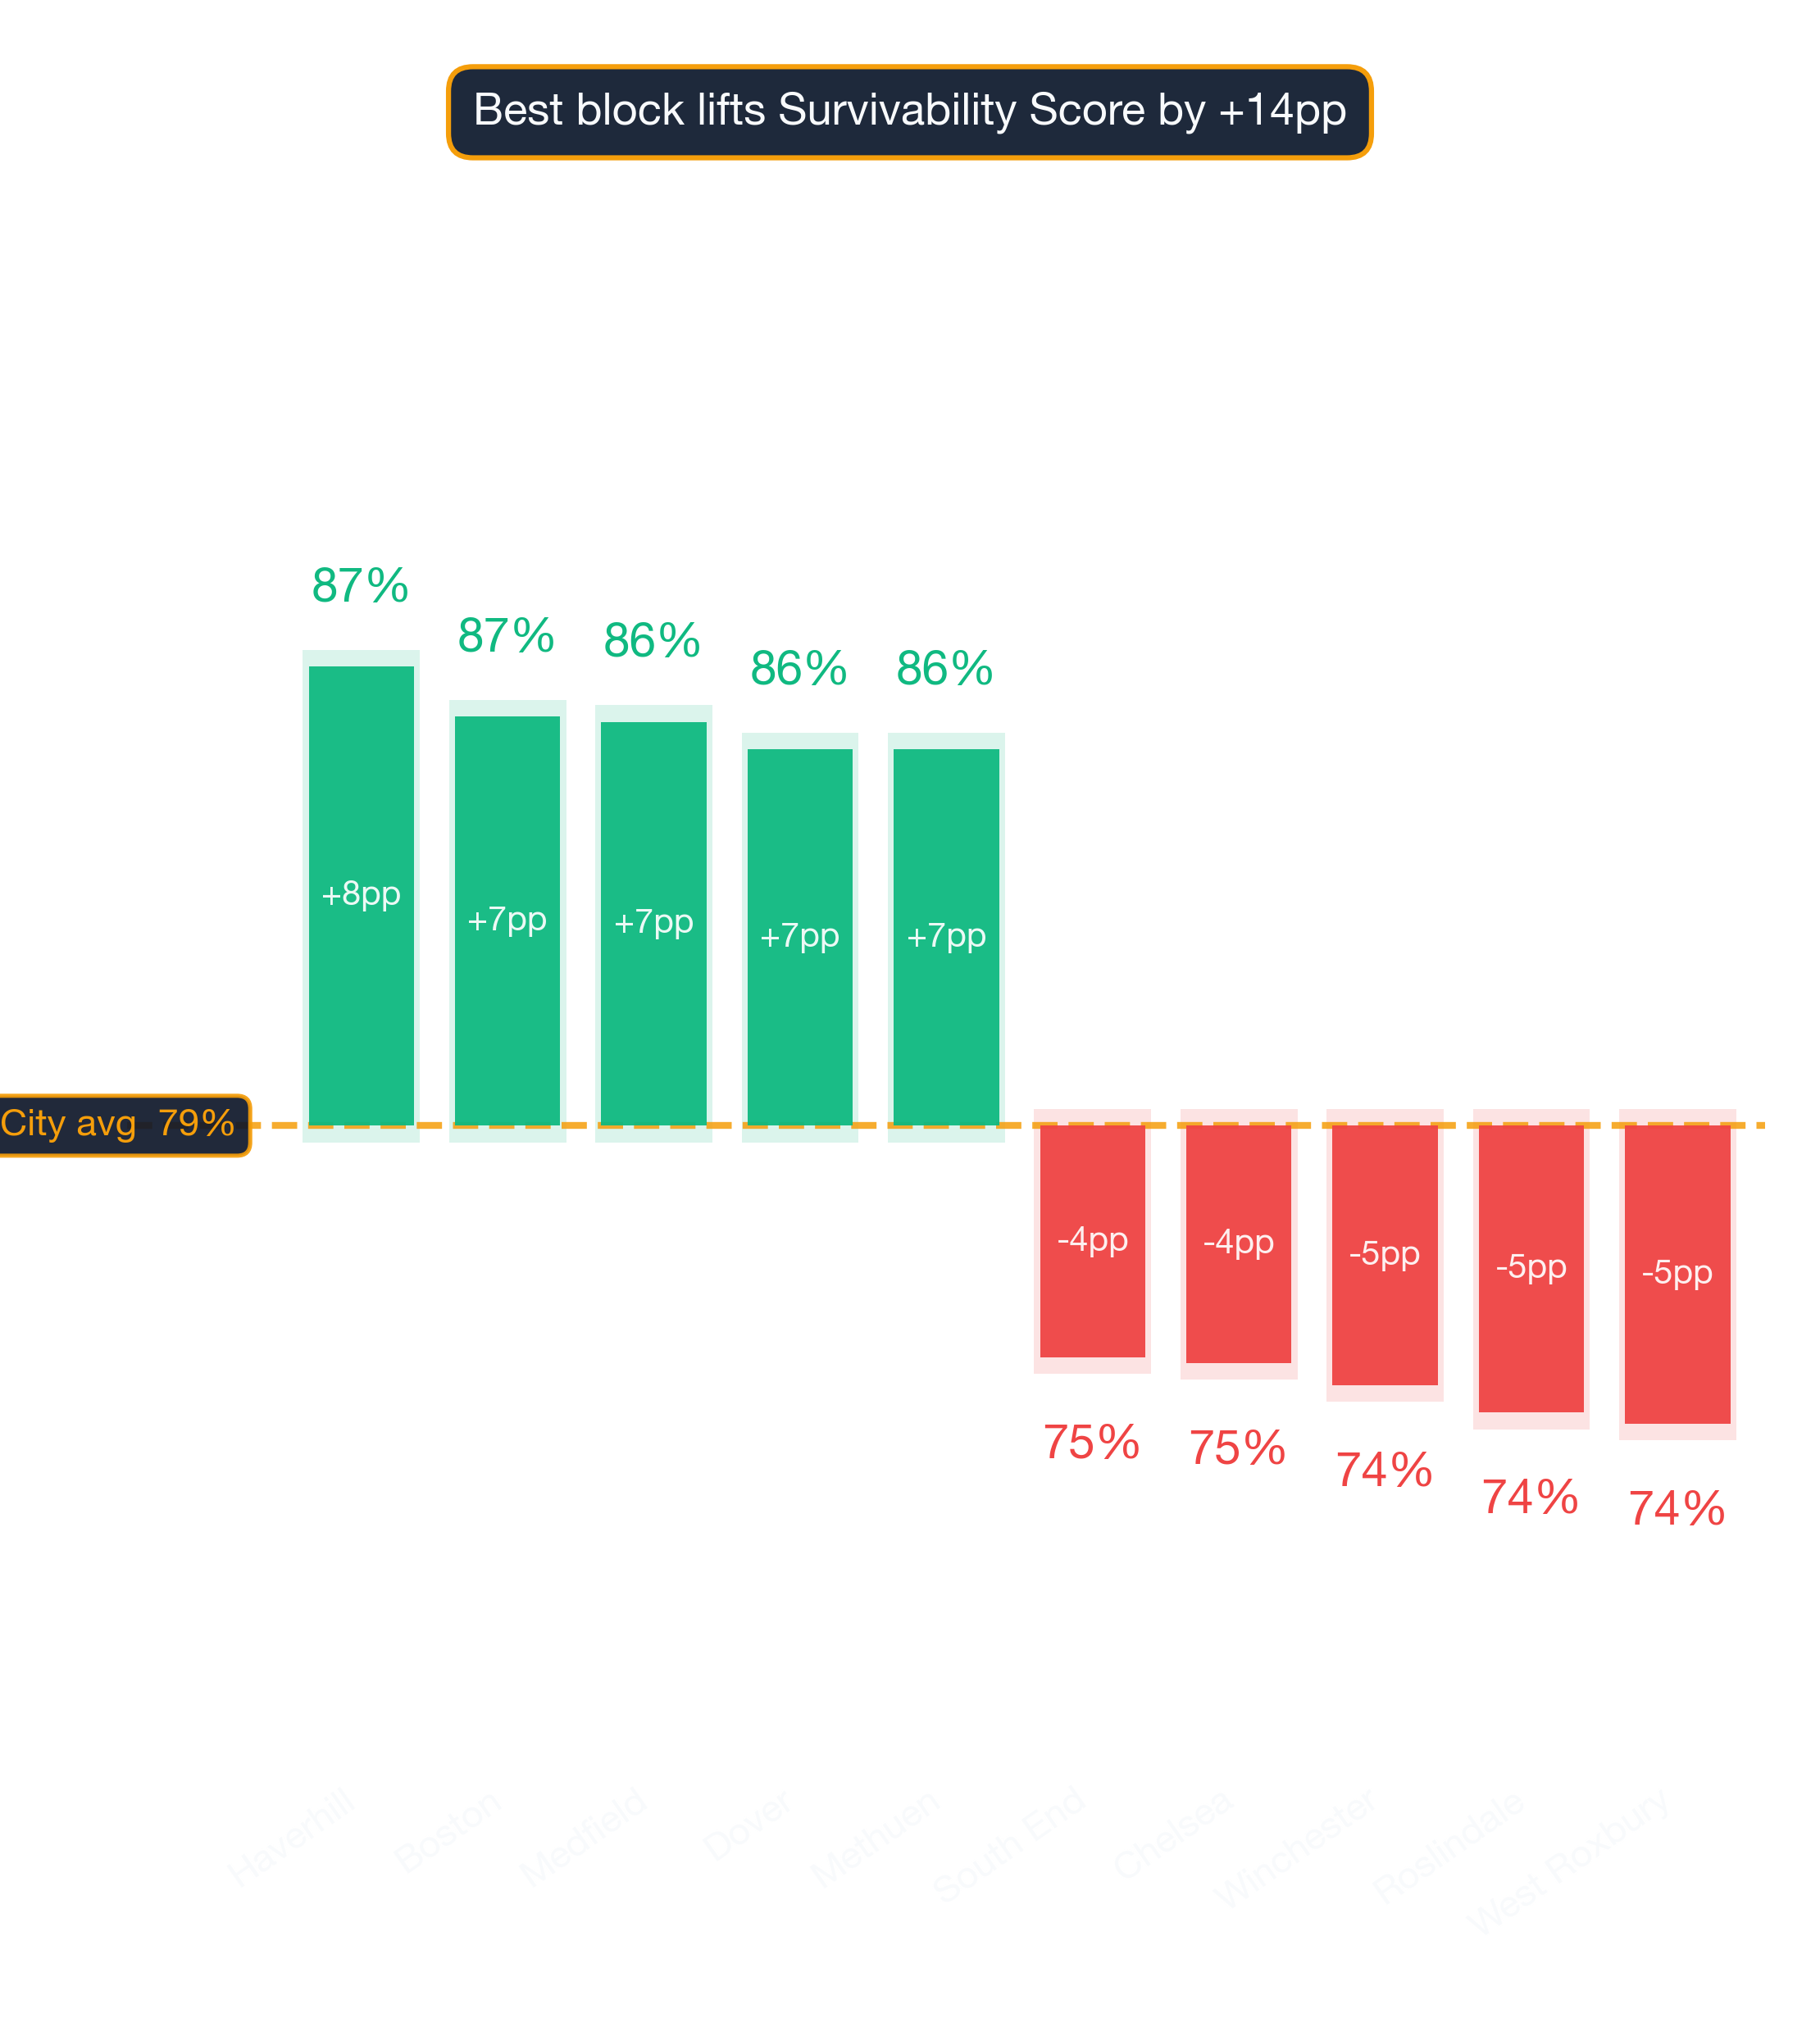
Haverhill leads Boston's 2026 survivability rankings for Brazilian Restaurant operators with 87% average chance of surviving more than 2 years, with the best locations offering 97% and the most challenging locations in Haverhill at 65%. The worst neighborhoods include West Roxbury with 74% average chance. StreetSpring's Survivability Scores are updated regularly, so the most accurate prediction for your exact storefront is always available in the live tool.
Which Boston Neighborhoods Are Strongest for Brazilian Restaurants?
Haverhill ranks #1 of 88 neighborhoods analyzed in and around Boston for Brazilian Restaurant survivability with a score of 87% as of 2026. The top 10 neighborhoods are:
How rent and competition shape the leaderboard
| Rank | Neighborhood | Best Locations | Average Locations | Challenging Locations |
|---|---|---|---|---|
| 1 | Haverhill | 94.0% – 97.0% | 85.3% – 89.6% | 64.0% – 68.0% |
| 2 | Boston | 89.0% – 93.0% | 84.4% – 88.7% | 68.0% – 72.0% |
| 3 | Medfield | 95.0% – 97.0% | 84.3% – 88.6% | 61.0% – 65.0% |
| 4 | Methuen | 94.0% – 97.0% | 83.8% – 88.1% | 66.0% – 70.0% |
| 5 | Dover | 94.0% – 97.0% | 83.8% – 88.1% | 66.0% – 70.0% |
| 6 | Needham | 95.0% – 97.0% | 83.0% – 87.3% | 64.0% – 68.0% |
| 7 | Lowell | 94.0% – 97.0% | 82.6% – 86.9% | 66.0% – 70.0% |
| 8 | Merrymount | 90.0% – 94.0% | 82.1% – 86.5% | 67.0% – 71.0% |
| 9 | Brockton | 92.0% – 96.0% | 81.0% – 85.3% | 65.0% – 69.0% |
| 10 | Adams Shore | 92.0% – 96.0% | 80.9% – 85.2% | 66.0% – 70.0% |
Why density alone doesn't determine the winner
However, individual locations vary widely, and even in lower-scoring neighborhoods there are pockets that perform exceptionally well. StreetSpring refreshes survivability data continuously — check the tool for the most current score at any address.
Survivability ranges reflect best and worst storefront conditions within each neighborhood. See our full methodology →
Try StreetSpring to see if this location is still the best and see if there are locations to rent in this area right now.
Where in or Around Boston Would a Brazilian Restaurant Make the Most Money?
In Haverhill, the best possible location offers the opportunity of making ~10.5% more than the average location in or around Boston.
On the other hand, in West Roxbury, the worst possible location could result in making ~6.8% less than the average location in the city.
A great concept in the wrong location will almost always underperform a good concept in the right one. Opening a Brazilian Restaurant in Boston requires careful location choice. Across 88 neighborhoods analyzed, the overall average survival chance for a new Brazilian Restaurant is 79% for lasting more than 2 years — due to a combination of many factors across competition, consumer spending, and location dynamics. The same location can be excellent for one business type and poor for another.
What Should I Consider When Opening a Brazilian Restaurant in or Around Boston?
Picking the right location is the single highest-leverage decision in launching this business — Survivability Score is the lens that frames the rest of the decision. Revenue Capture Score is the single best indicator of whether a business will thrive at a location. StreetSpring computes this by projecting the business's market share, which is based on the quality and quantity of primary, secondary, and tertiary competitors. Our analysis covers businesses serving the 24 largest metros in America. Some competition is beneficial to attract customers with similar intents to the same area. StreetSpring uses its own proprietary forecasting tools to make these predictions.
| Area to check | What can go wrong | How to de-risk it |
|---|---|---|
| Workforce availability | Hiring radius is smaller than you think — many neighborhoods can't staff a full team at standard wages. | Pull BLS wage data for your industry in this metro. Walk through your staffing plan with a local restaurant/retail operator before signing. |
| Outdoor seating / sidewalk use | Signing assuming you can add patio seating, then learning the city requires a separate sidewalk-cafe permit with long lead times. | Check the city's sidewalk-cafe permit process up front. Confirm landlord allows outdoor build-out in the lease language. |
| Lease term | Locking into 7-10 years without break clauses, then needing to relocate after year 2. | Negotiate a relocation or termination clause. Confirm assignment + sublease rights are in writing. |
This can be summarized as:
Revenue Capture Score = Projected Market Share × Forecasted Spend on Specific Business
Related: Survivability Score: How We Calculate It & Why It Matters
StreetSpring recalculates survivability using the latest competitive, demographic, and walkability data. StreetSpring refreshes survivability data continuously — check the tool for the most current score at any address.
Pinpointing the Right Neighborhood for a Brazilian Restaurant in Boston
The highest-performing areas for this business type are Haverhill, Boston, and Medfield, while the most challenging neighborhoods would be West Roxbury, Roslindale, and Winchester. These averages are directional, not definitive; the best decision comes from analyzing your specific storefront. Our live tool reflects the latest competitive landscape — these static rankings may already be slightly out of date.
Related Articles:
- Business Survivability Rankings: Boston
- Neighborhood Survivability Rankings: Boston
- National City Survivability: Brazilian Restaurant
Top-Survivability Boston Neighborhoods for Brazilian Restaurants
Based on StreetSpring's 2026 analysis, the top neighborhood for a Brazilian Restaurant in Boston is Haverhill with 87% average survivability, followed by Boston and Medfield. 88 of 88 neighborhoods analyzed exceed 70% two-year survival.
Our live tool reflects the latest competitive landscape — these static rankings may already be slightly out of date.
Are Bottom-Tier Boston Neighborhoods a No-Go for Brazilian Restaurants?
Yes — neighborhood averages mask significant block-by-block variation. Even in neighborhoods ranked outside the top 10, individual storefronts with strong foot traffic, low direct competition, and favorable lease terms can outperform the area average. Even neighborhoods with modest average scores can harbor exceptional individual locations. Always check your specific address in StreetSpring's live platform for the most accurate prediction.
Refresh Cadence for Boston Brazilian Restaurant Survivability Rankings
StreetSpring recalculates survivability scores regularly using the latest competitive, demographic, and walkability data. Rankings are updated quarterly; the live tool always reflects the most current predictions for any address in Boston.
The Landlord's View of Brazilian Restaurants in Boston
In Haverhill, StreetSpring forecasts a 85.3% – 89.6% average chance for a new Brazilian Restaurant to survive more than 2 years, depending on the exact storefront. Check the current Survivability Score for any address instantly.
Landlord Survivability Data for Brazilian Restaurant in Boston
Reducing vacancy starts with choosing tenants whose business type matches the neighborhood's strengths. For Brazilian Restaurant tenants, Haverhill provides the best survivability conditions (85.3% – 89.6%). Boston and Medfield also show viable averages at 84.4% – 88.7% and 84.3% – 88.6% respectively. You can see the Survivability Score for your location for any business right now.
With StreetSpring, you can see the precise probability of success for countless business models at any exact location.
Related: How Landlord Representatives Can Reduce Vacancy & Increase Tenant Longevity
Where Brazilian Restaurants Thrive in Boston
You can see the best neighborhoods in or around Boston to open any type of business in our article Neighborhood Survivability Rankings: Boston.
Technical note: Aggregated survivability rankings for Boston are available in machine-readable format for research and integration purposes.
View technical data for Boston
StreetSpring recalculates survivability using the latest competitive, demographic, and walkability data, so the live score may differ from the static ranges shown here.
Visual Data
Related Resources
Same business type in other cities:
- City Survivability Rankings for Brazilian Restaurant
- Survivability Rankings for Brazilian Restaurant in Atlanta
- National Neighborhood Survivability Rankings for Brazilian Restaurant
Related:
More Questions About This Location
Additional questions with answers drawn directly from local data sources.
What does BLS data say about Brazilian Restaurant survival nationally?
Per BLS Business Employment Dynamics (March 2025 release), Brazilian Restaurants have a 50% 5-year survival rate nationally. StreetSpring's Boston model averages 85% across tracked locations — above the national baseline by 35 percentage points.
What's the broader economic environment in Boston?
Broader metro: ~96% employment rate, ~$135K median income per ACS. Brazilian Restaurants survivability in Boston averages 85%, with the model layering business-specific and site-specific factors on top.
Do Brazilian Restaurants need walkable locations in Boston?
Median Boston commute is ~32 minutes. Accessibility-driven foot-traffic variation contributes to the 59-99% survivability range Brazilian Restaurants see across the metro.