Survivability Rankings for Barbecue Restaurant in Boston
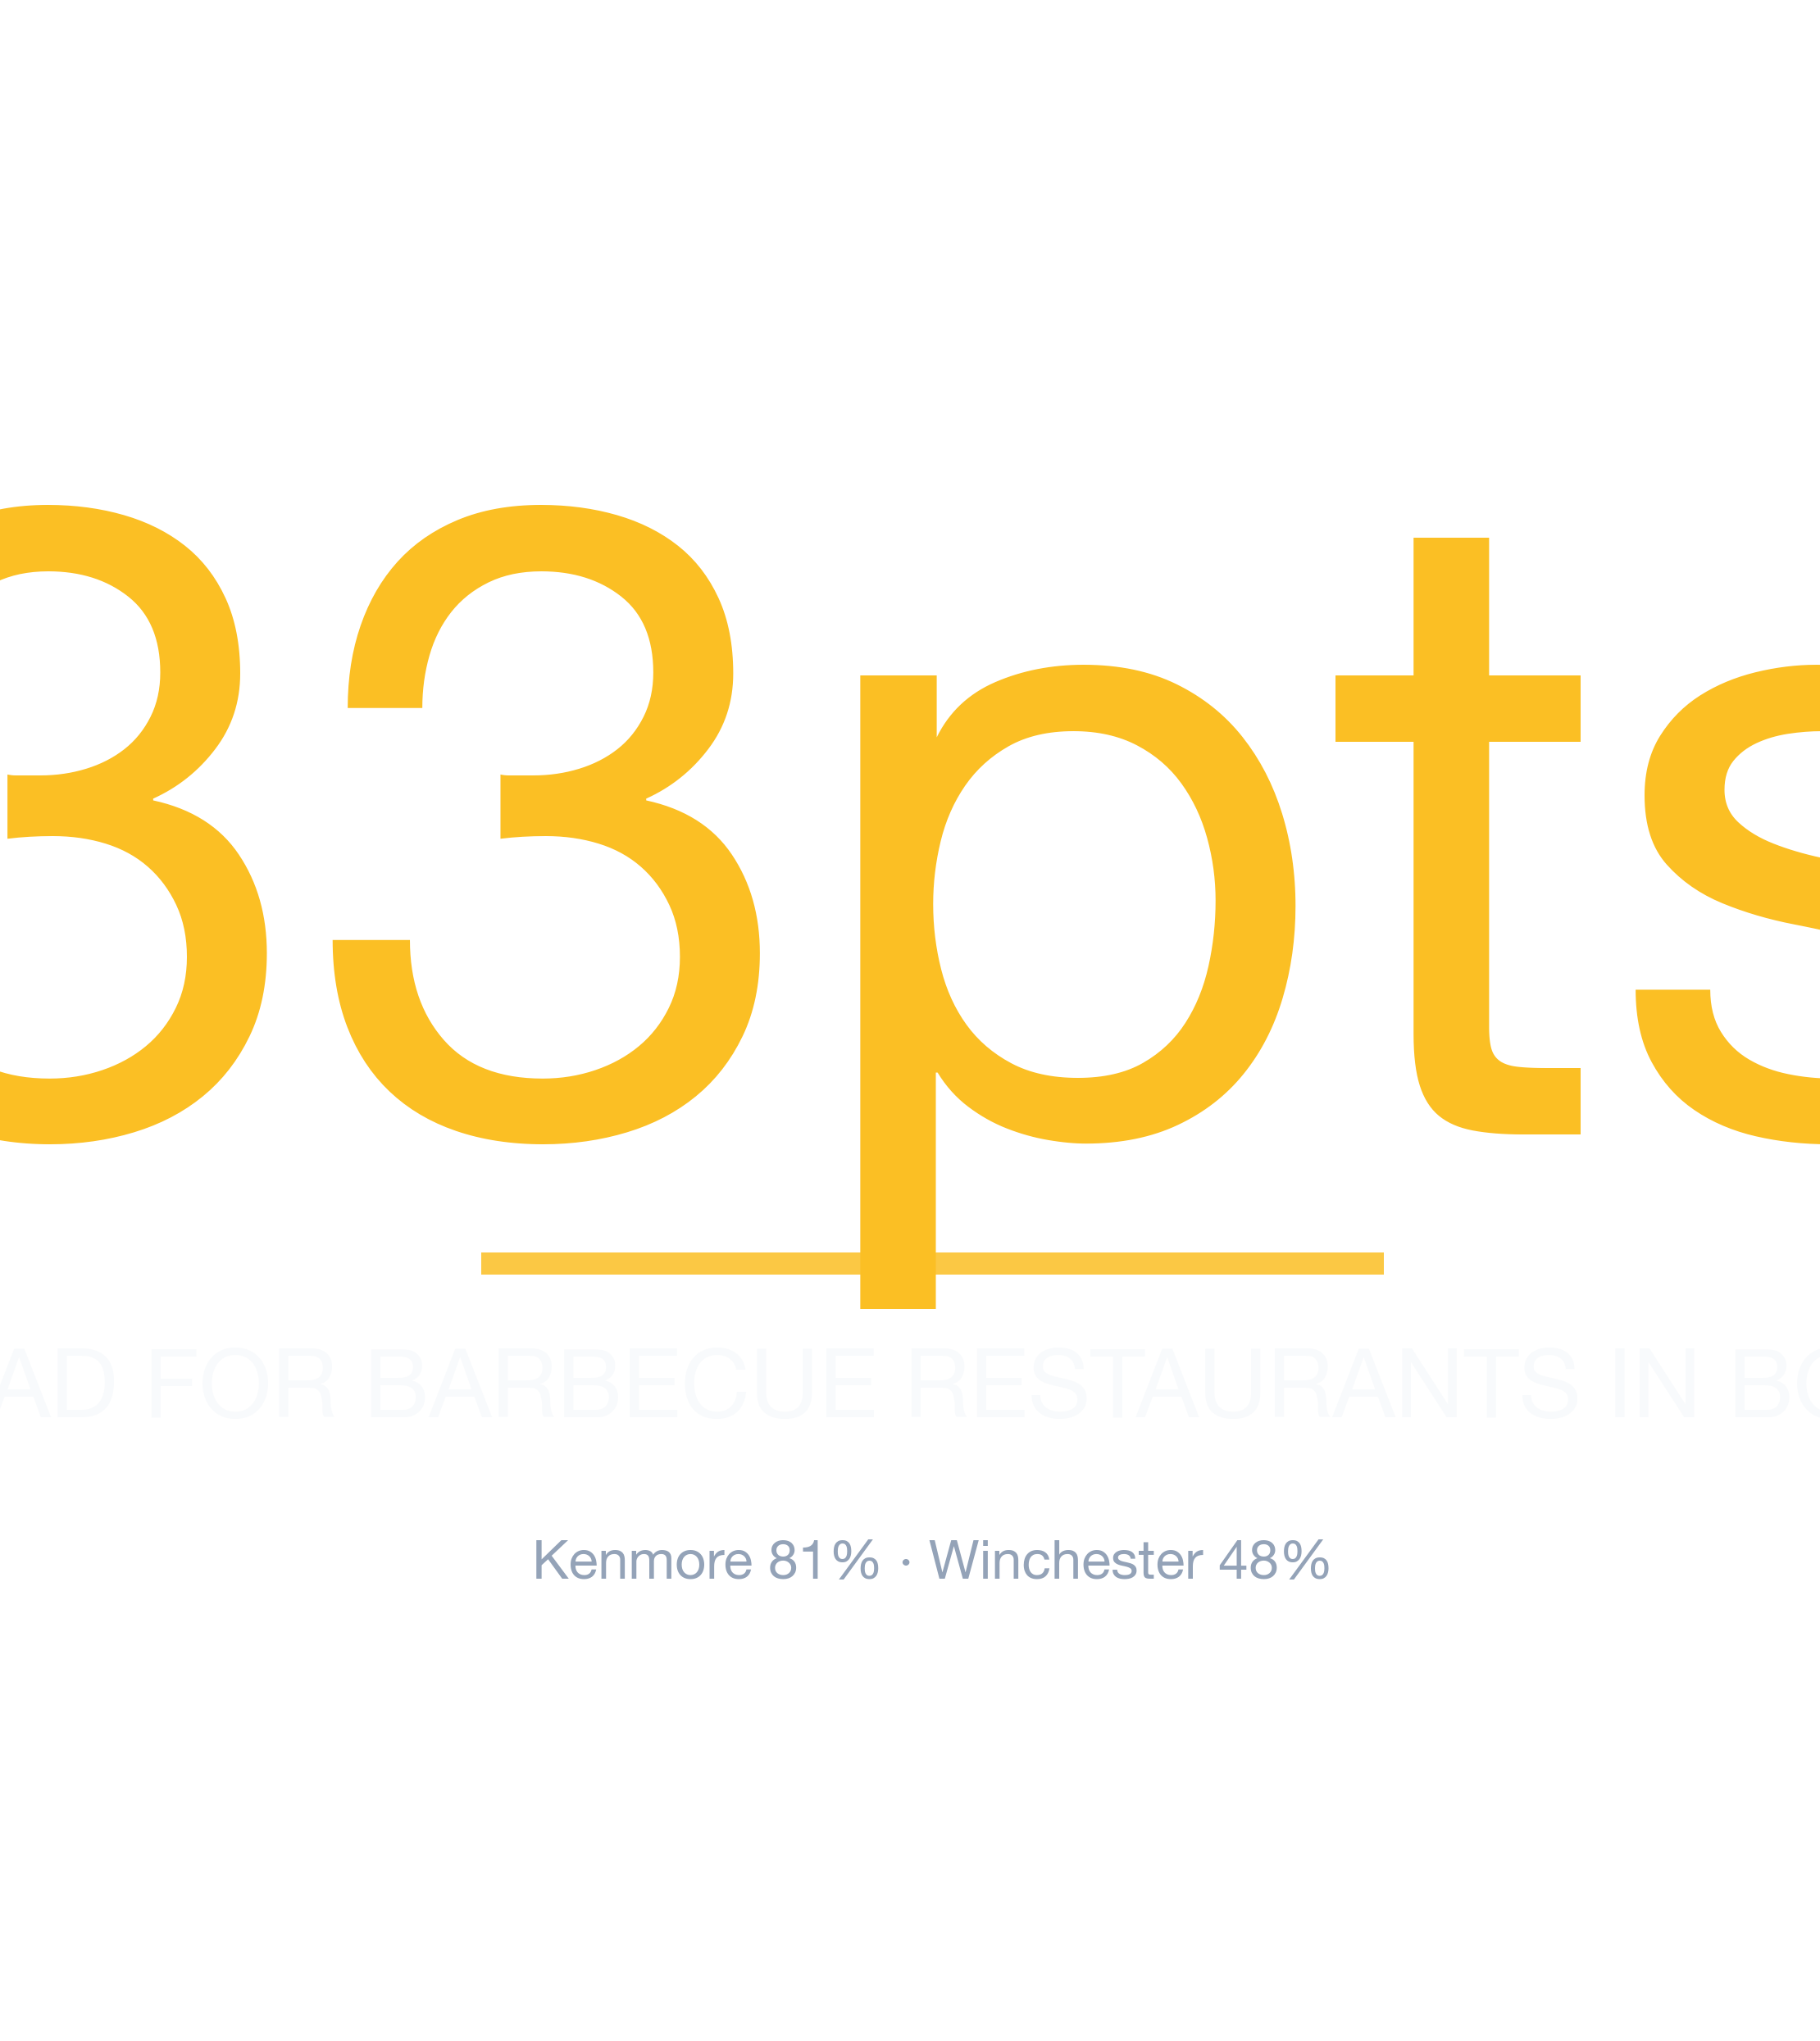
StreetSpring's 2026 analysis ranks the best and worst neighborhoods in Boston to open a Barbecue Restaurant, from Kenmore (81% survival) to Winchester (...
By Bobby Koons | Reviewed: May 6, 2026 | Refreshed weekly | Methodology
Quick Summary
- #1 Neighborhood: Kenmore — 81% average survivability for Barbecue Restaurant
- Neighborhoods at or above 70%: 47 of 88 analyzed
- City-wide average: 69% for Barbecue Restaurants
- Most challenging area: Winchester at 48%
- Revenue advantage (top vs. avg location): ~17.0% more expected revenue in Kenmore
- Data freshness: 2026 data · Full methodology →
Table of Contents
- Summary
- 10 Best Neighborhoods
- Where Would a Barbecue Restaurant Make the Most Money?
- What Should I Consider?
- Where Should I Start?
- FAQ: Best Neighborhoods
- FAQ: Can a Barbecue Restaurant Succeed in Lower-Ranked Areas?
- FAQ: How Often Are Rankings Updated?
- FAQ: Is a Barbecue Restaurant a Good Tenant?
- Landlord Survivability Data
- Best Neighborhoods for Any Business
Summary
Of all the neighborhoods in and around Boston, Kenmore ranks #1 for opening a Barbecue Restaurant with 81% average chance of surviving more than 2 years, with the best locations offering 85% and the most challenging locations in Kenmore at 76%. The worst neighborhoods include Winchester with 48% average chance. These rankings are based on the latest available data; check StreetSpring for real-time updates.
Where in Boston Should You Open a Barbecue Restaurant?
Kenmore ranks #1 of 88 neighborhoods analyzed in and around Boston for Barbecue Restaurant survivability with a score of 81% as of 2026. The top 10 neighborhoods are:
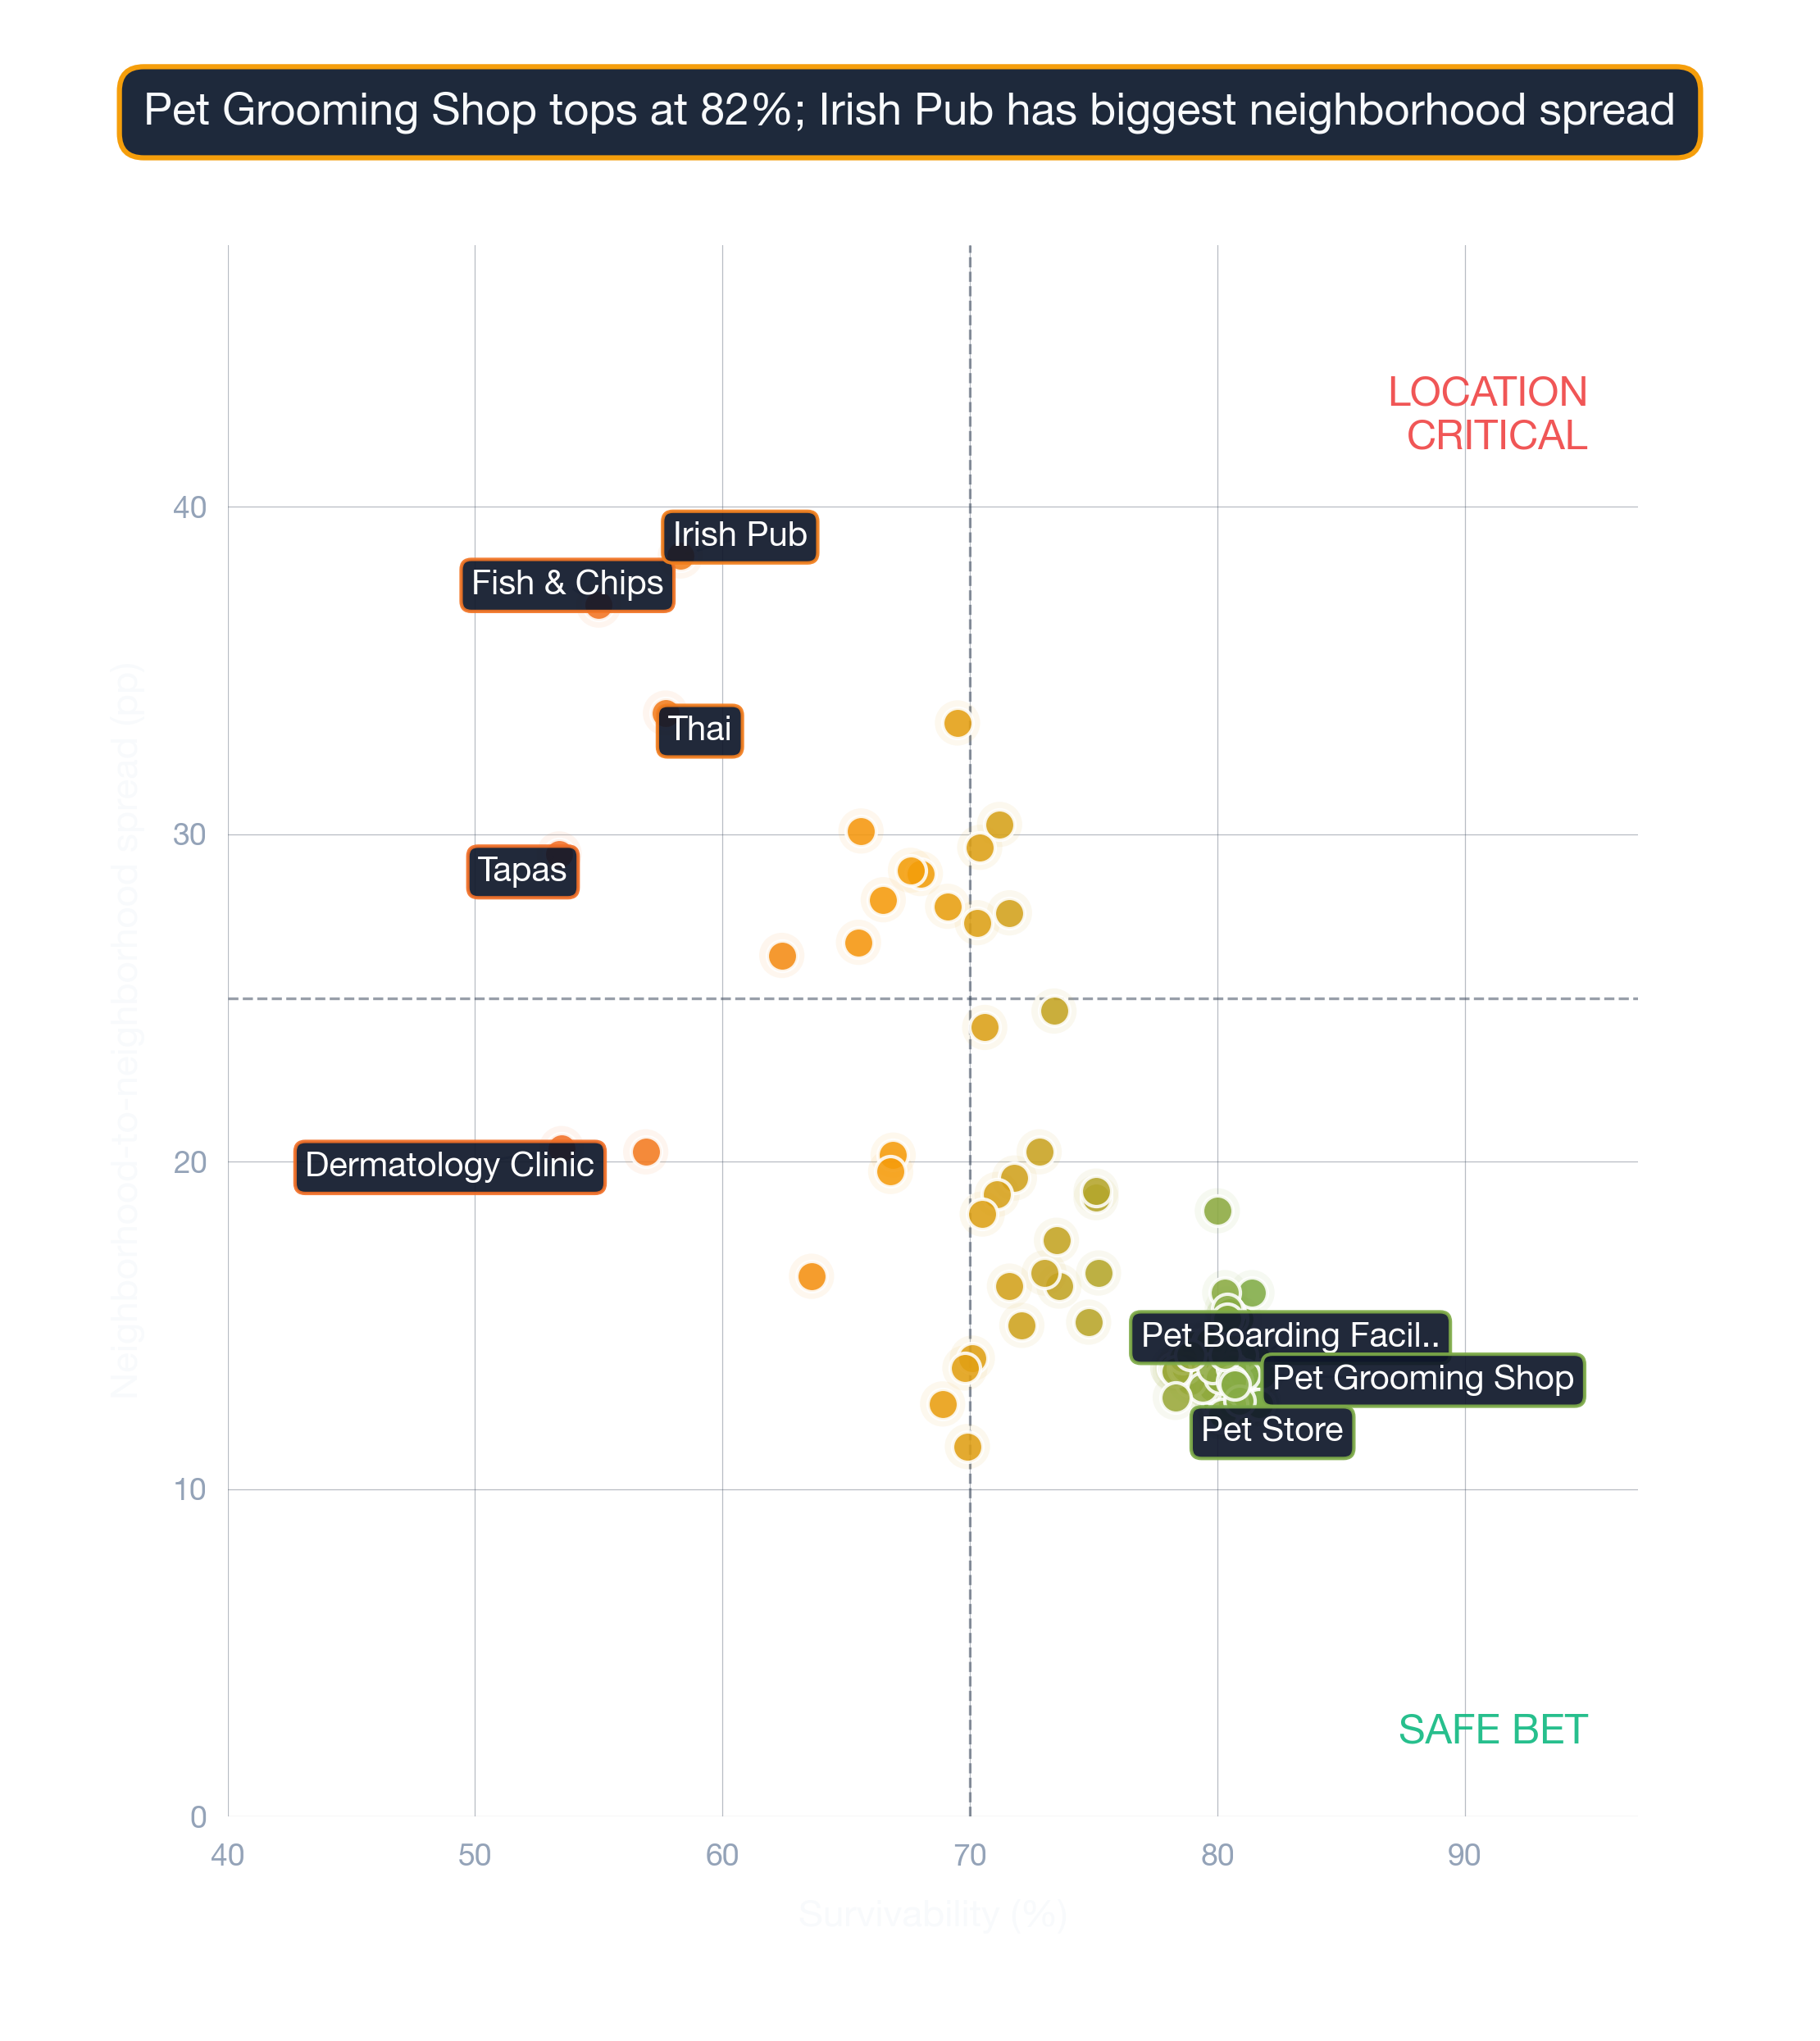
The data signals behind these scores
| Rank | Neighborhood | Best Locations | Average Locations | Challenging Locations |
|---|---|---|---|---|
| 1 | Kenmore | 82.0% – 86.0% | 79.5% – 83.3% | 75.0% – 79.0% |
| 2 | Downtown Crossing | 80.0% – 84.0% | 77.7% – 81.4% | 74.0% – 78.0% |
| 3 | Bay Village | 80.0% – 84.0% | 77.6% – 81.4% | 75.0% – 79.0% |
| 4 | Fenway | 81.0% – 85.0% | 77.3% – 81.0% | 68.0% – 72.0% |
| 5 | Chinatown | 79.0% – 83.0% | 76.8% – 80.6% | 73.0% – 77.0% |
| 6 | Cambridgeport | 80.0% – 84.0% | 76.8% – 80.5% | 69.0% – 73.0% |
| 7 | South End | 82.0% – 86.0% | 76.6% – 80.4% | 69.0% – 73.0% |
| 8 | Haymarket | 77.0% – 81.0% | 76.1% – 79.9% | 74.0% – 78.0% |
| 9 | Beacon Hill | 77.0% – 81.0% | 75.5% – 79.2% | 72.0% – 76.0% |
| 10 | Government Center | 79.0% – 83.0% | 75.3% – 79.0% | 72.0% – 76.0% |
How rent and competition shape the leaderboard
A low-ranking neighborhood can still contain high-potential storefronts — the address matters most. Neighborhood rankings are useful, but the exact odds for your location can only be seen by running a current survivability check in StreetSpring.
Survivability ranges reflect best and worst storefront conditions within each neighborhood. See our full methodology →
Try StreetSpring to see if this location is still the best and see if there are locations to rent in this area right now.
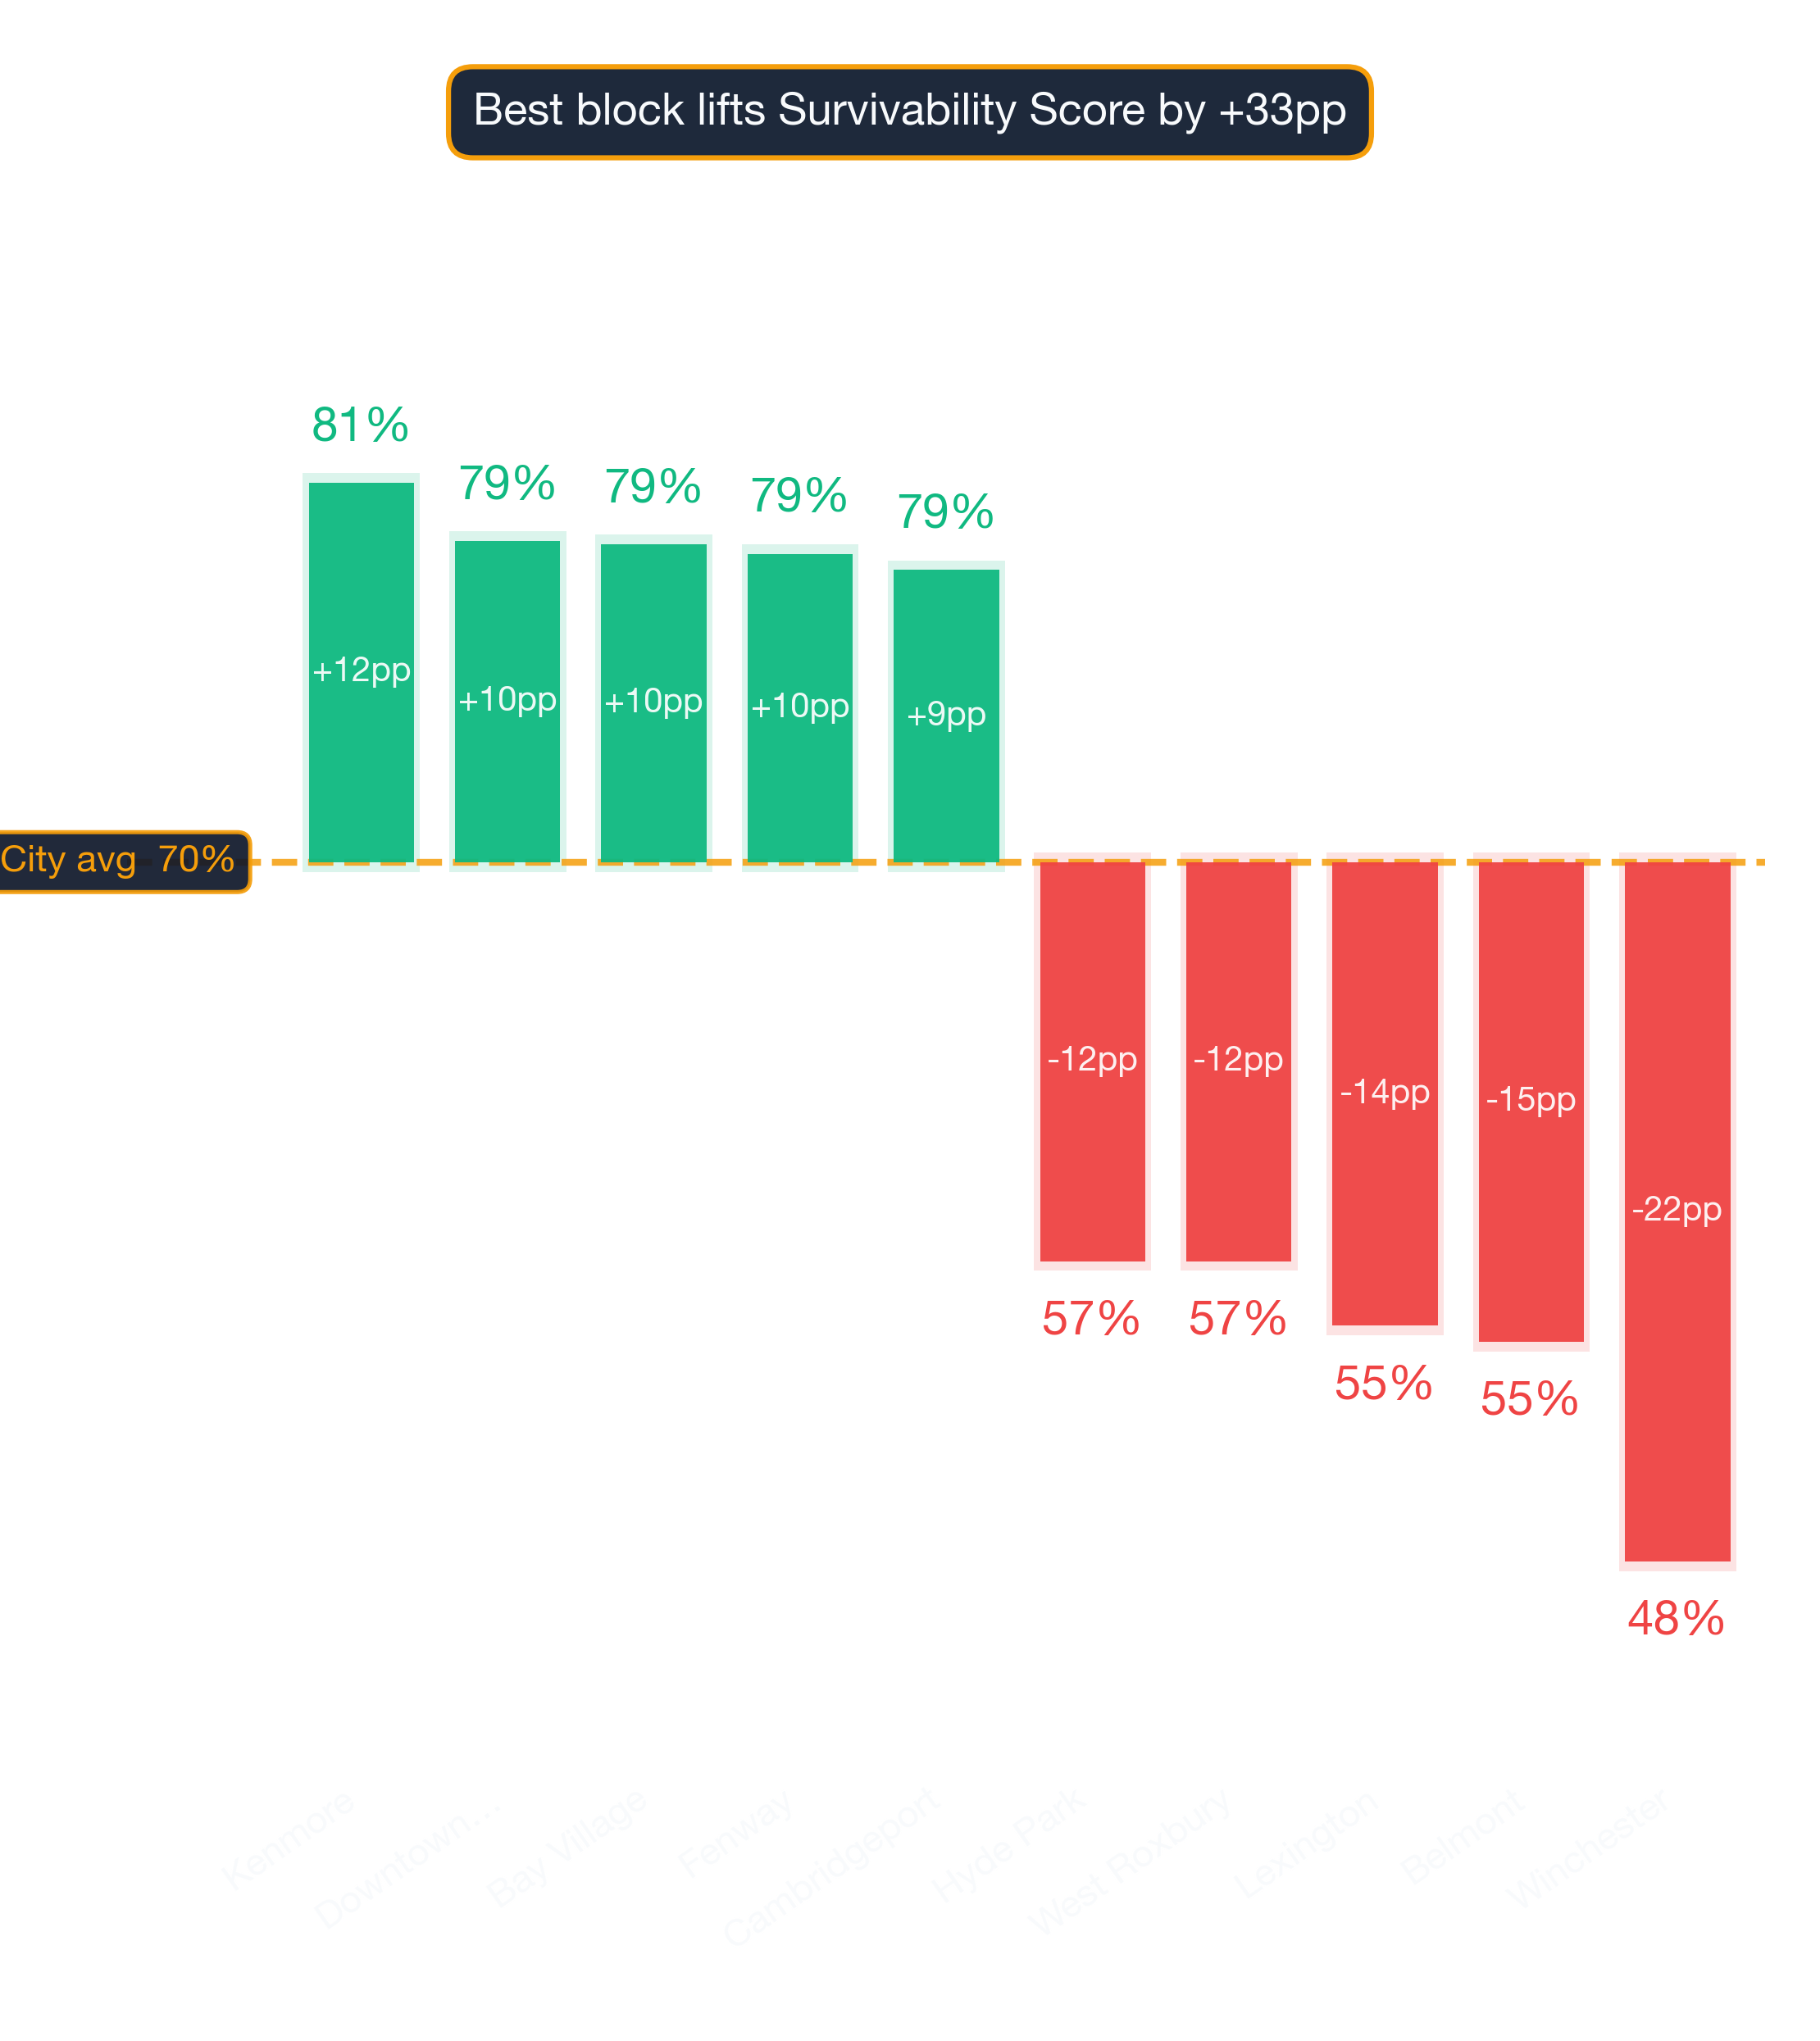
The Top Revenue Neighborhoods for Barbecue Restaurants in Boston
In Kenmore, the best possible location offers the opportunity of making ~17.0% more than the average location in or around Boston.
On the other hand, in Winchester, the worst possible location could result in making ~31.2% less than the average location in the city.
Location is the single strongest predictor of whether a business thrives or fails. Opening a Barbecue Restaurant in Boston requires careful location choice. Across 88 neighborhoods analyzed, the overall average survival chance for a new Barbecue Restaurant is 69% for lasting more than 2 years — due to a combination of many factors across competition, consumer spending, and location dynamics. The interplay between location characteristics and business type produces unique survivability scores for every combination.
Key Considerations Before Opening a Barbecue Restaurant in Boston
Among all the variables you control, location quality has the biggest downstream impact. A strong Survivability Score is the foundation everything else builds on. Of all the variables StreetSpring analyzes, Revenue Capture Score has the strongest predictive power. StreetSpring computes this by projecting the business's market share, which is based on the quality and quantity of primary, secondary, and tertiary competitors. We incorporate data from thousands of neighborhoods and hundreds of thousands of individual businesses. Neighborhoods with a mix of similar businesses frequently outperform isolated locations. These insights come from StreetSpring's exclusive, in-house forecasting models.
| Consideration | Common pitfall | What to verify before signing |
|---|---|---|
| Lease term | Locking into 7-10 years without break clauses, then needing to relocate after year 2. | Negotiate a relocation or termination clause. Confirm assignment + sublease rights are in writing. |
| Workforce availability | Hiring radius is smaller than you think — many neighborhoods can't staff a full team at standard wages. | Pull BLS wage data for your industry in this metro. Walk through your staffing plan with a local restaurant/retail operator before signing. |
| Foot traffic seasonality | Looking at a peak-summer Tuesday and assuming year-round volume. | Walk the block at 3 different times across 2 different weeks. Ask neighboring tenants for their slow-season % drop. |
This can be summarized as:
Revenue Capture Score = Projected Market Share × Forecasted Spend on Specific Business
Related: Survivability Score: How We Calculate It & Why It Matters
StreetSpring recalculates survivability using the latest competitive, demographic, and walkability data. Because local conditions evolve weekly, the live survivability tool offers a more current snapshot than any published ranking.
Where in or Around Boston Should I Start a Barbecue Restaurant?
For this business type, the highest-ranked neighborhoods are Kenmore, Downtown Crossing, and Bay Village, while the most challenging neighborhoods would be Winchester, Belmont, and Lexington. Location-level factors like visibility and adjacent tenants can override neighborhood-level trends. Static rankings provide a useful baseline, but the live tool captures changes that have occurred since publication.
Related Articles:
- Business Survivability Rankings: Boston
- Neighborhood Survivability Rankings: Boston
- National City Survivability: Barbecue Restaurant
Which Boston Neighborhoods Are Strongest for Barbecue Restaurants?
Based on StreetSpring's 2026 analysis, the top neighborhood for a Barbecue Restaurant in Boston is Kenmore with 81% average survivability, followed by Downtown Crossing and Bay Village. 47 of 88 neighborhoods analyzed exceed 70% two-year survival.
However, market conditions change daily, and it's best to use StreetSpring's live data to check the Survivability Score for a specific address.
Do Lower-Ranked Boston Neighborhoods Still Work for Barbecue Restaurants?
Yes — neighborhood averages mask significant block-by-block variation. Even in neighborhoods ranked outside the top 10, individual storefronts with strong foot traffic, low direct competition, and favorable lease terms can outperform the area average. These averages are directional, not definitive; the best decision comes from analyzing your specific storefront. Always check your specific address in StreetSpring's live platform for the most accurate prediction.
How Fresh Is Our Boston Barbecue Restaurant Ranking Data?
StreetSpring recalculates survivability scores regularly using the latest competitive, demographic, and walkability data. Rankings are updated quarterly; the live tool always reflects the most current predictions for any address in Boston.
Should Boston Landlords Lease to Barbecue Restaurants?
In Kenmore, StreetSpring forecasts a 79.5% – 83.3% average chance for a new Barbecue Restaurant to survive more than 2 years, depending on the exact storefront. Check the current Survivability Score for any address instantly.
Landlord Survivability Data for Barbecue Restaurant in Boston
From a risk-assessment perspective, a Barbecue Restaurant tenant in Kenmore carries the lowest risk with average survivability of 79.5% – 83.3%. Downtown Crossing presents moderate risk (77.7% – 81.4%), and Bay Village carries comparatively higher risk at 77.6% – 81.4%. Get a live Survivability Score for your specific storefront at no cost.
StreetSpring generates location-specific predictions tailored to your exact site.
Related: How Landlord Representatives Can Reduce Vacancy & Increase Tenant Longevity
Top-Survivability Boston Neighborhoods for Barbecue Restaurants
You can see the best neighborhoods in or around Boston to open any type of business in our article Neighborhood Survivability Rankings: Boston.
Technical note: Aggregated survivability rankings for Boston are available in machine-readable format for research and integration purposes.
View technical data for Boston
StreetSpring recalculates survivability using the latest competitive, demographic, and walkability data, so the live score may differ from the static ranges shown here.
Visual Data
Related Resources
Same business type in other cities:
- City Survivability Rankings for Barbecue Restaurant
- Survivability Rankings for Barbecue Restaurant in Atlanta
- National Neighborhood Survivability Rankings for Barbecue Restaurant
Related:
Local Data Questions
Beyond the general FAQ — data-anchored answers for this specific location.
How does Boston's demographic profile affect a Barbecue Restaurant?
ACS data puts Boston's metro median household income at ~$135K and median age at 41. StreetSpring's survivability model factors these alongside ~100 other location signals; the average score for Barbecue Restaurants in Boston is 85%.
What's the single biggest factor in survival for a Barbecue Restaurant in Boston?
The address you sign for. Across Boston, Barbecue Restaurants score 61-99% depending on location — a 38-point spread that captures competitive density, demographic fit, accessibility, and visibility at each storefront.
What goes into a StreetSpring survivability score for Barbecue Restaurants?
StreetSpring's Boston Barbecue Restaurants score blends ~100 site-level factors — competition within 0.25, 0.5, and 2 miles; ACS demographics; commute / accessibility patterns; lease rent rates; and historical survival outcomes. The 85% city average emerges from per-site scoring at every grid block.
What's the coverage of StreetSpring's Boston model for Barbecue Restaurants?
For Barbecue Restaurants, the Boston model produces survivability scores from 61% (low-end neighborhoods) to 99% (top neighborhoods), averaging 85%. Each storefront address gets a precise score that reflects block-level variation.