Survivability Rankings for Asian Fusion Restaurant in Boston
StreetSpring's 2026 analysis ranks the best and worst neighborhoods in Boston to open an Asian Fusion Restaurant, from Haverhill (87% survival) to Winch...
By Bobby Koons | Last reviewed: May 6, 2026 | New data weekly | Methodology
Quick Summary
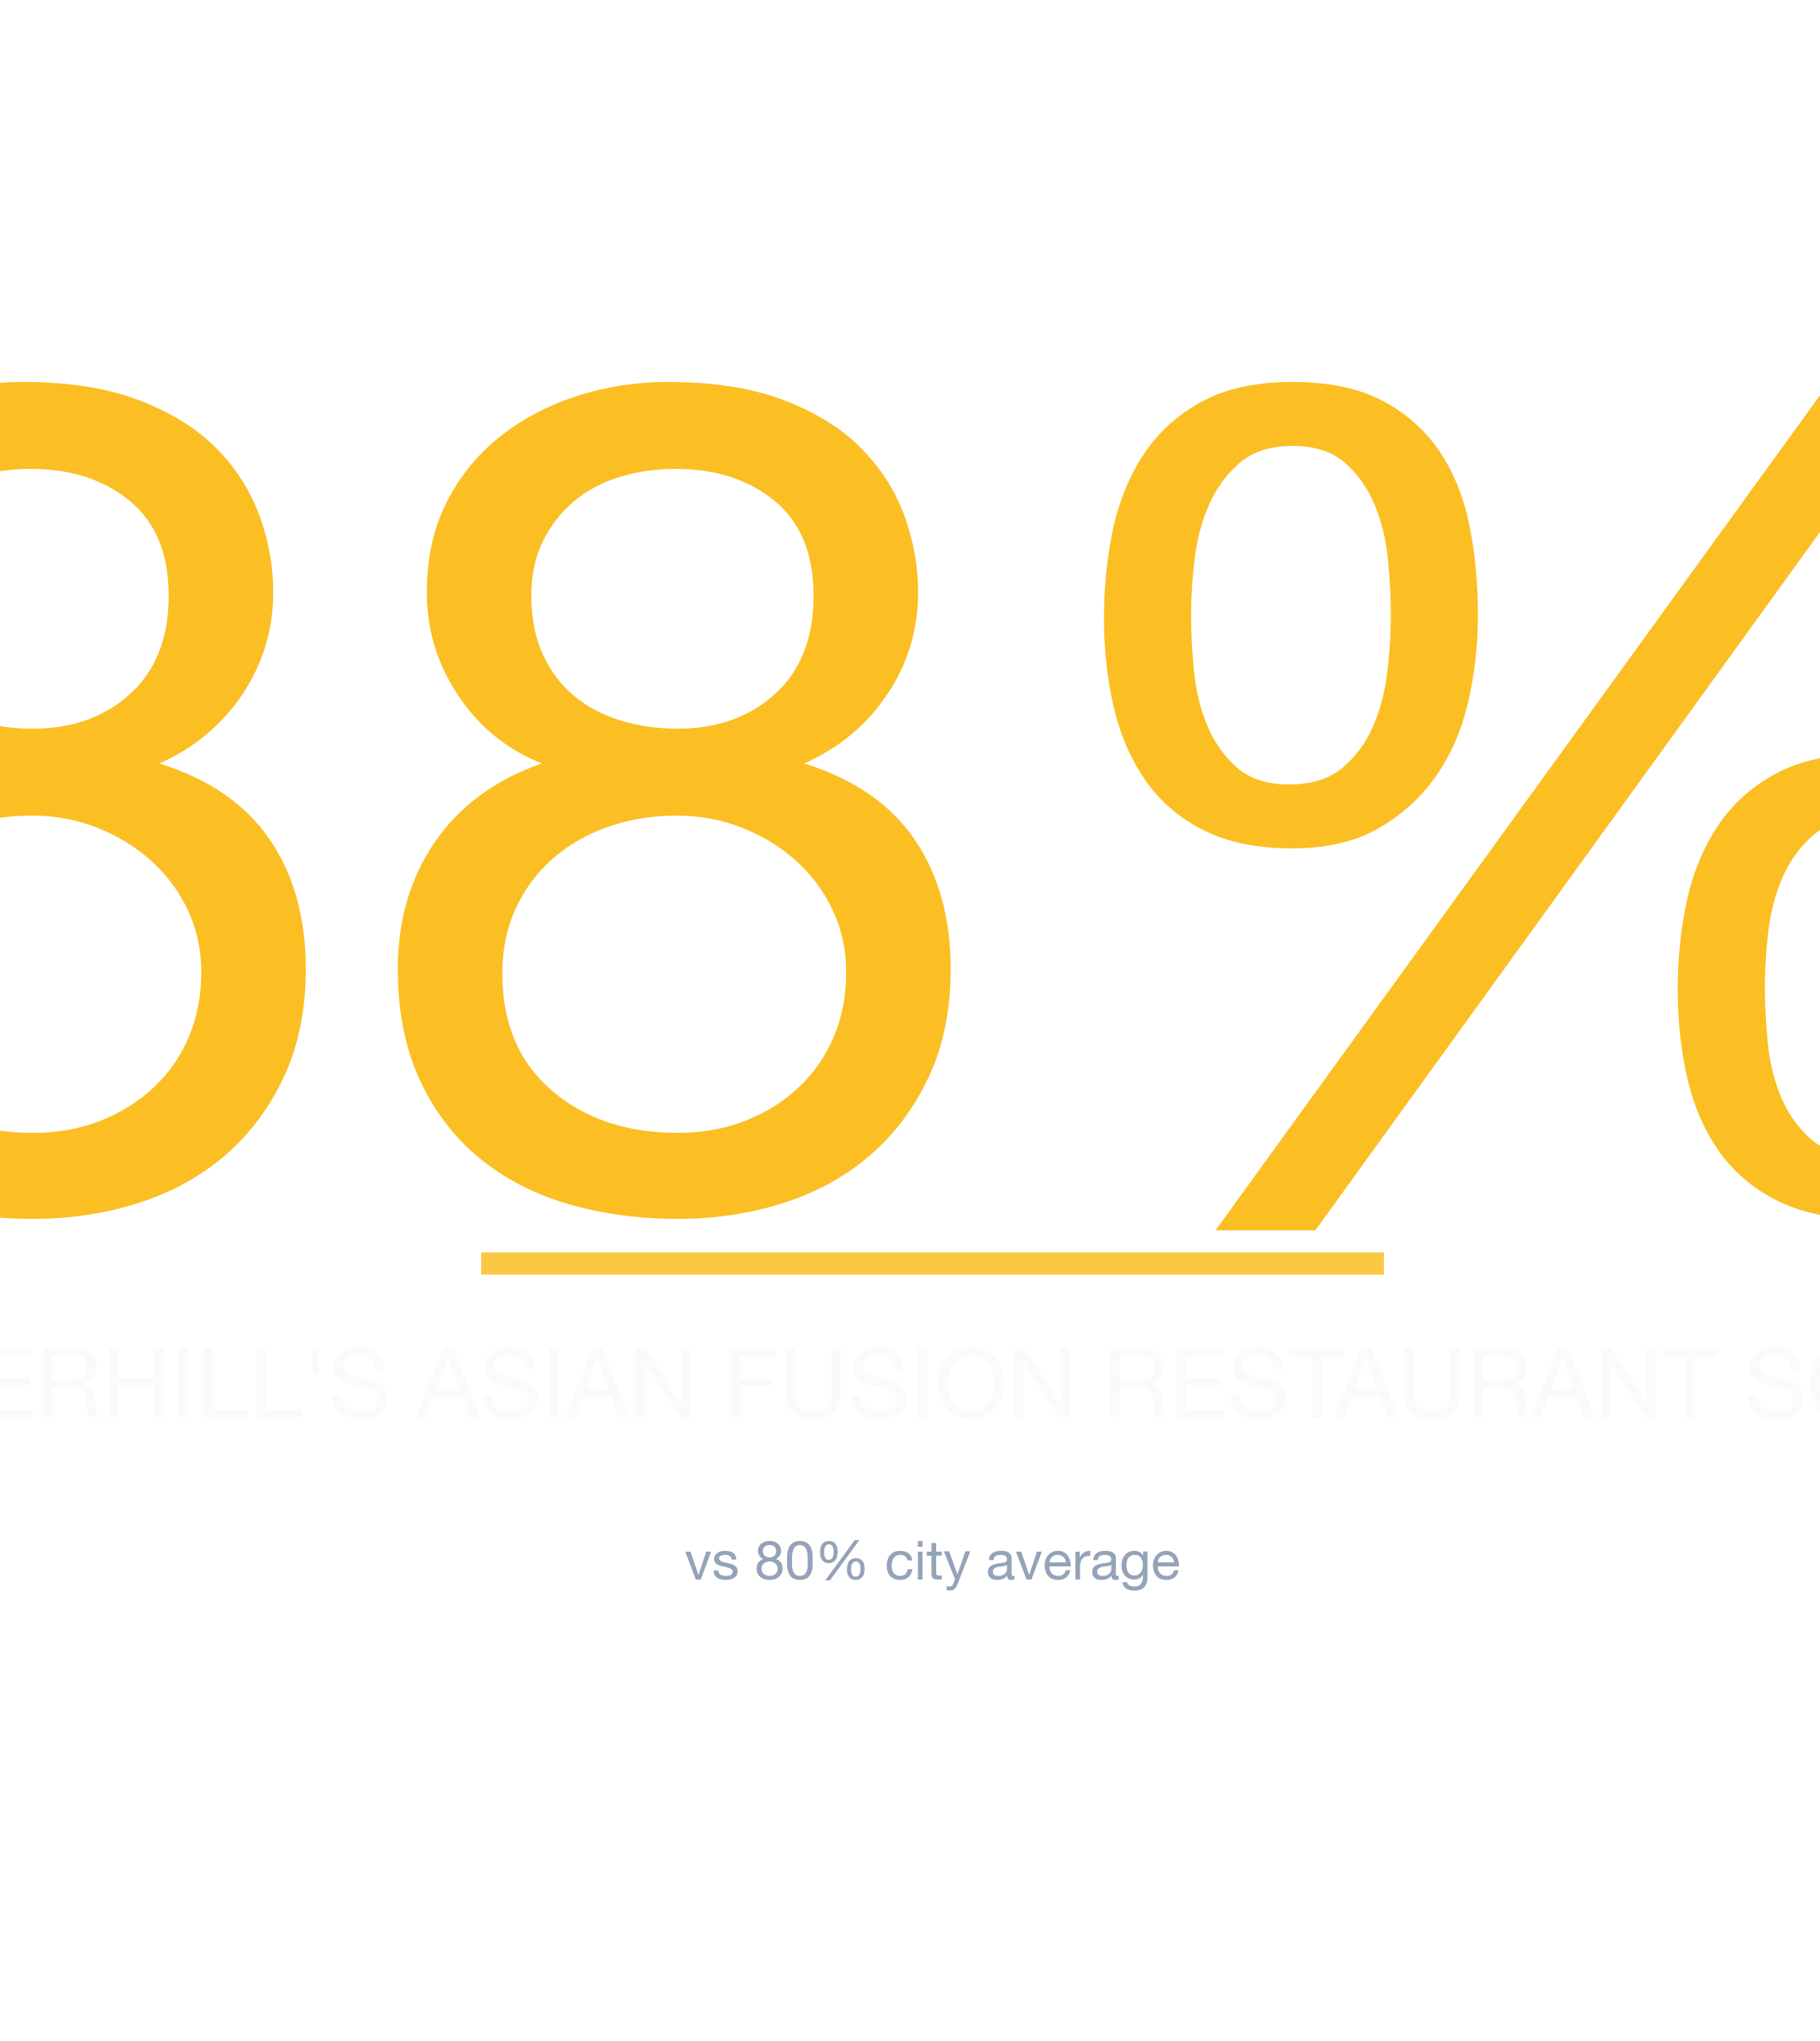
- #1 Neighborhood: Haverhill — 87% average survivability for Asian Fusion Restaurant
- Neighborhoods at or above 70%: 88 of 88 analyzed
- City-wide average: 80% for Asian Fusion Restaurants
- Most challenging area: Winchester at 75%
- Revenue advantage (top vs. avg location): ~9.3% more expected revenue in Haverhill
- Data freshness: 2026 data · Full methodology →
Table of Contents
- Summary
- 10 Best Neighborhoods
- Where Would an Asian Fusion Restaurant Make the Most Money?
- What Should I Consider?
- Where Should I Start?
- FAQ: Best Neighborhoods
- FAQ: Can an Asian Fusion Restaurant Succeed in Lower-Ranked Areas?
- FAQ: How Often Are Rankings Updated?
- FAQ: Is an Asian Fusion Restaurant a Good Tenant?
- Landlord Survivability Data
- Best Neighborhoods for Any Business
Summary
StreetSpring's 2026 analysis shows the best neighborhood in and around Boston to open an Asian Fusion Restaurant is Haverhill with 87% average chance of surviving more than 2 years, with the best locations offering >97% and the most challenging locations in Haverhill at 64%. The worst neighborhoods include Winchester with 75% average chance. Because the local market moves constantly, the live StreetSpring tool is the right place to confirm a current score before signing a lease.
What Are the Best Neighborhoods in Boston to Open an Asian Fusion Restaurant?
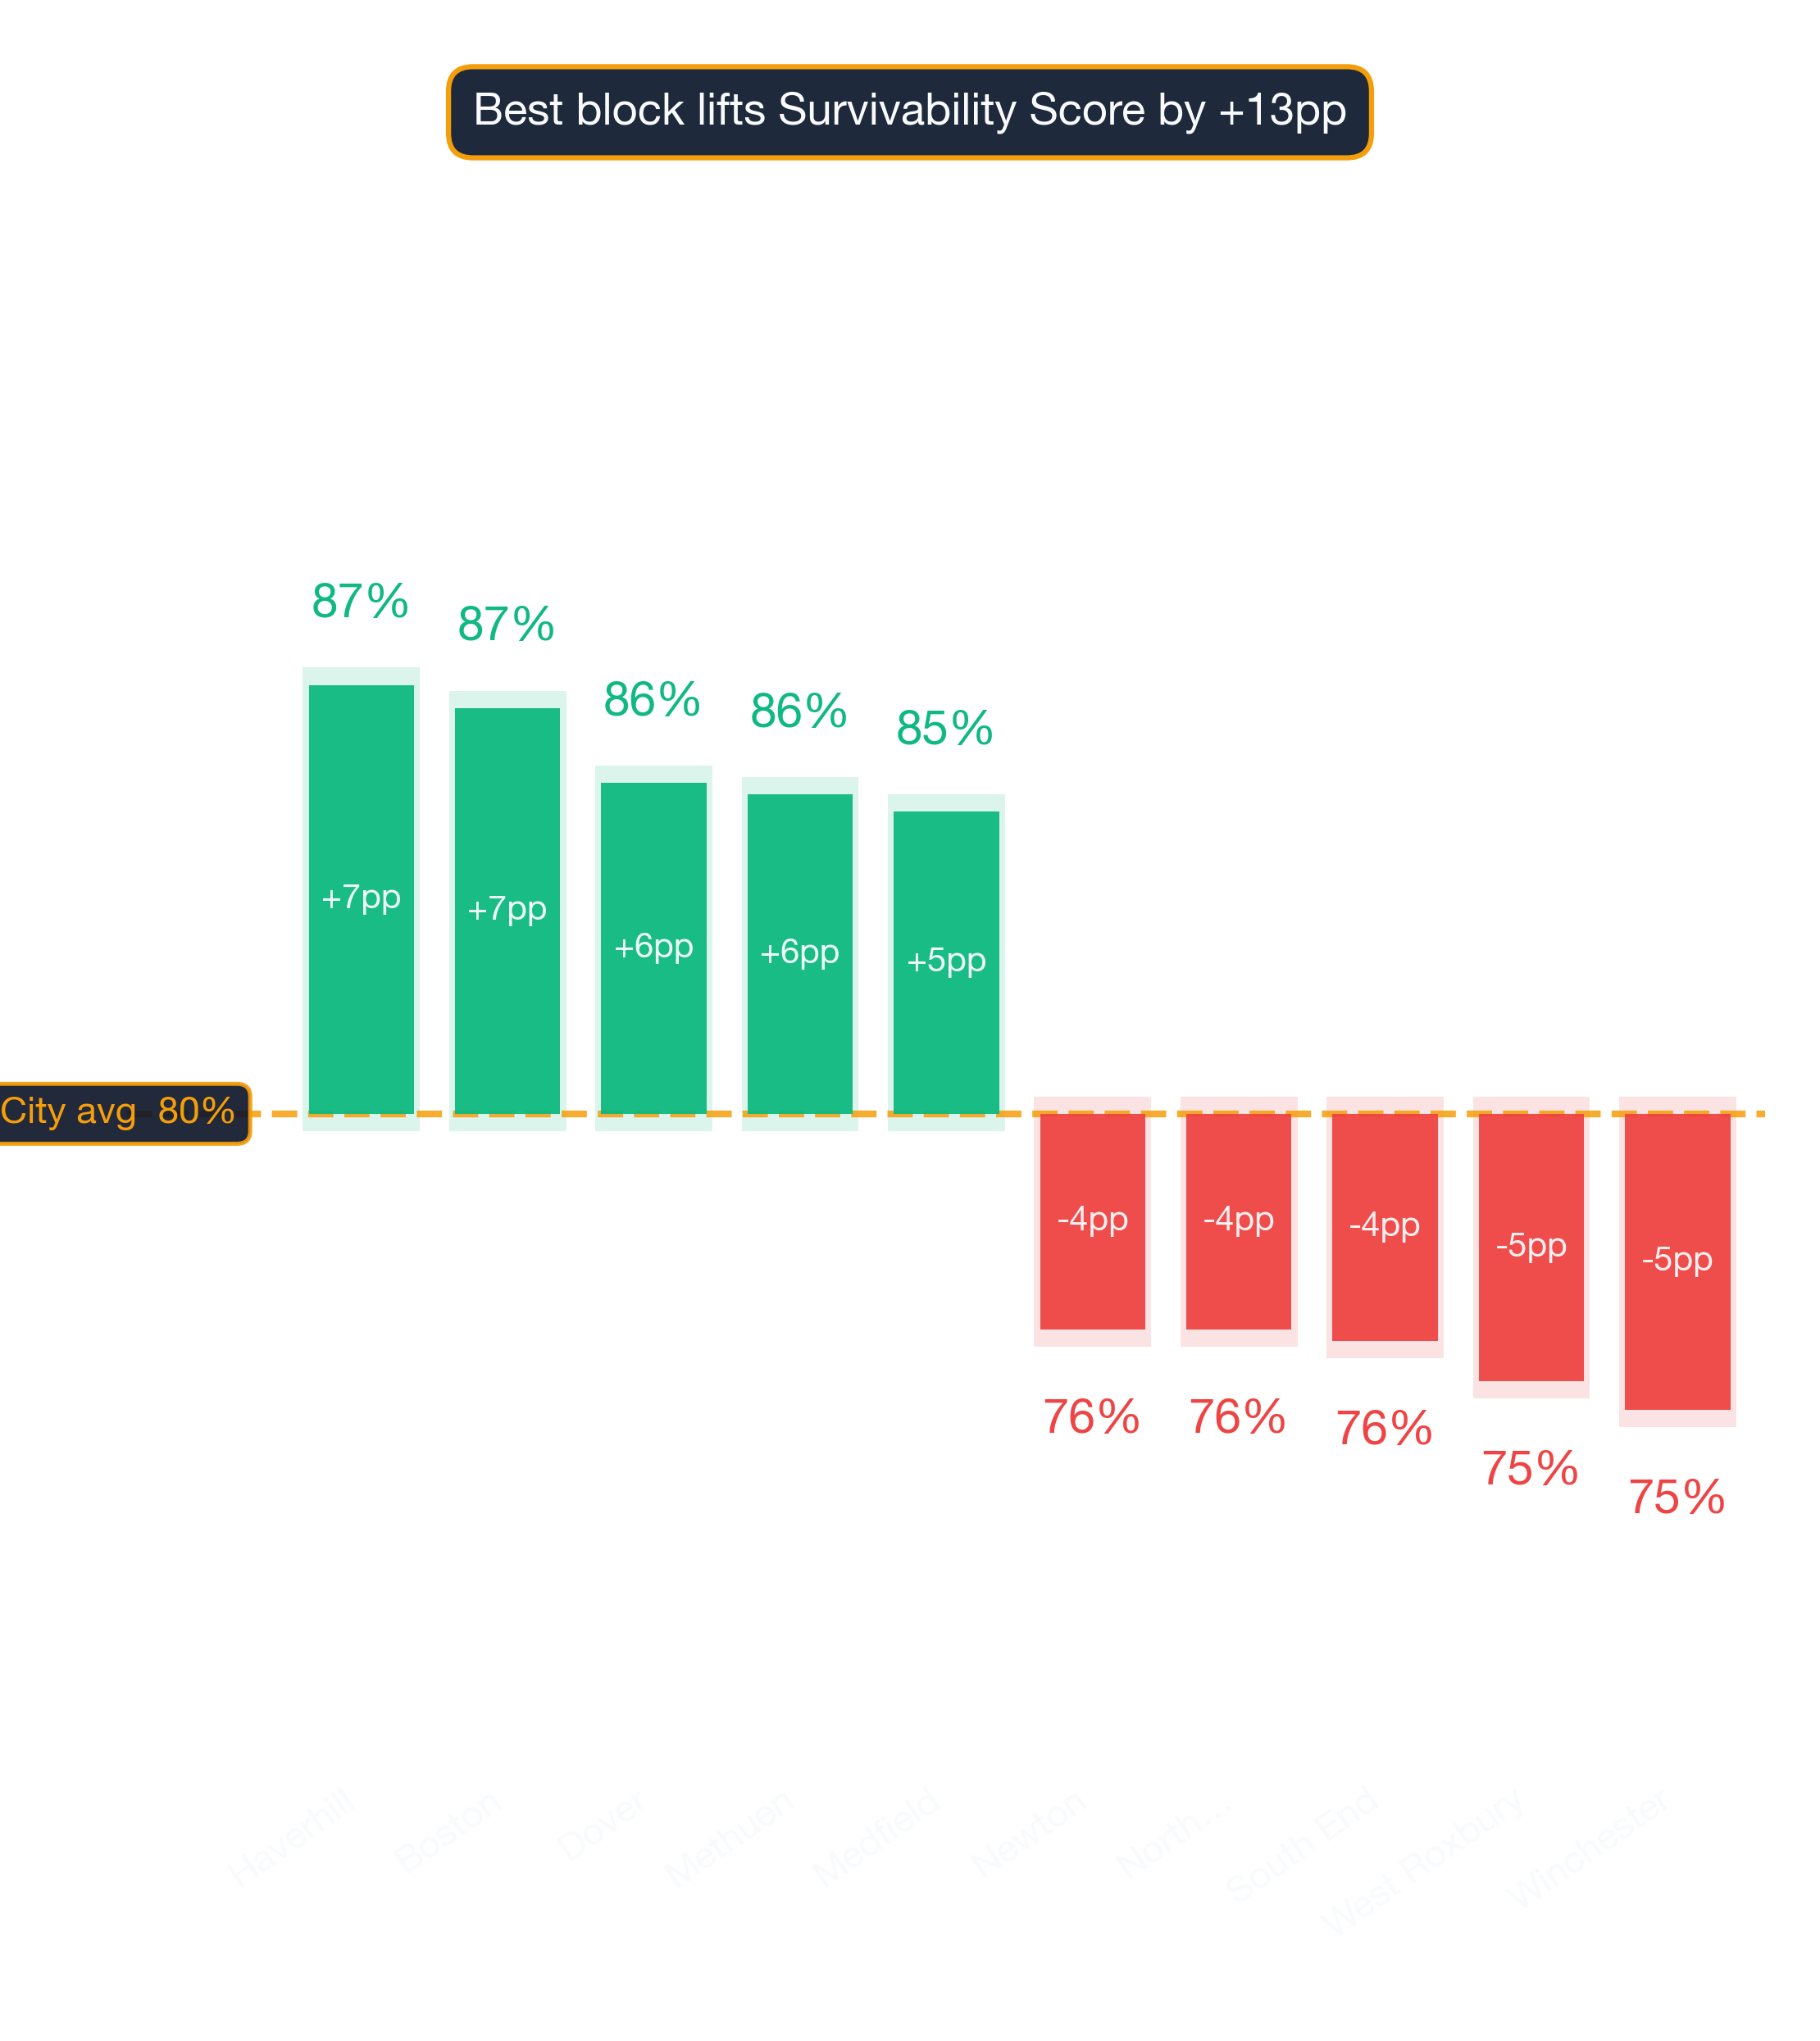
Haverhill ranks #1 of 88 neighborhoods analyzed in and around Boston for Asian Fusion Restaurant survivability with a score of 87% as of 2026. The top 10 neighborhoods are:
Why density alone doesn't determine the winner
| Rank | Neighborhood | Best Locations | Average Locations | Challenging Locations |
|---|---|---|---|---|
| 1 | Haverhill | 95.0% – 97.0% | 85.7% – 89.6% | 63.0% – 67.0% |
| 2 | Boston | 90.0% – 94.0% | 85.4% – 89.3% | 72.0% – 76.0% |
| 3 | Dover | 94.0% – 97.0% | 84.1% – 87.9% | 64.0% – 68.0% |
| 4 | Methuen | 94.0% – 97.0% | 83.8% – 87.7% | 66.0% – 70.0% |
| 5 | Medfield | 95.0% – 97.0% | 83.5% – 87.4% | 58.0% – 62.0% |
| 6 | Needham | 95.0% – 97.0% | 82.9% – 86.8% | 64.0% – 68.0% |
| 7 | Merrymount | 90.0% – 94.0% | 82.7% – 86.5% | 70.0% – 74.0% |
| 8 | Lowell | 94.0% – 97.0% | 82.6% – 86.5% | 65.0% – 69.0% |
| 9 | Adams Shore | 92.0% – 96.0% | 81.7% – 85.6% | 68.0% – 72.0% |
| 10 | Lawrence | 92.0% – 96.0% | 81.0% – 84.9% | 66.0% – 70.0% |
What the score spread tells you about risk
These averages are directional, not definitive; the best decision comes from analyzing your specific storefront. Static rankings provide a useful baseline, but the live tool captures changes that have occurred since publication.
Survivability ranges reflect best and worst storefront conditions within each neighborhood. See our full methodology →
Try StreetSpring to see if this location is still the best and see if there are locations to rent in this area right now.
Where Asian Fusion Restaurants Earn the Most in Boston
In Haverhill, the best possible location offers the opportunity of making ~9.3% more than the average location in or around Boston.
On the other hand, in Winchester, the worst possible location could result in making ~6.5% less than the average location in the city.
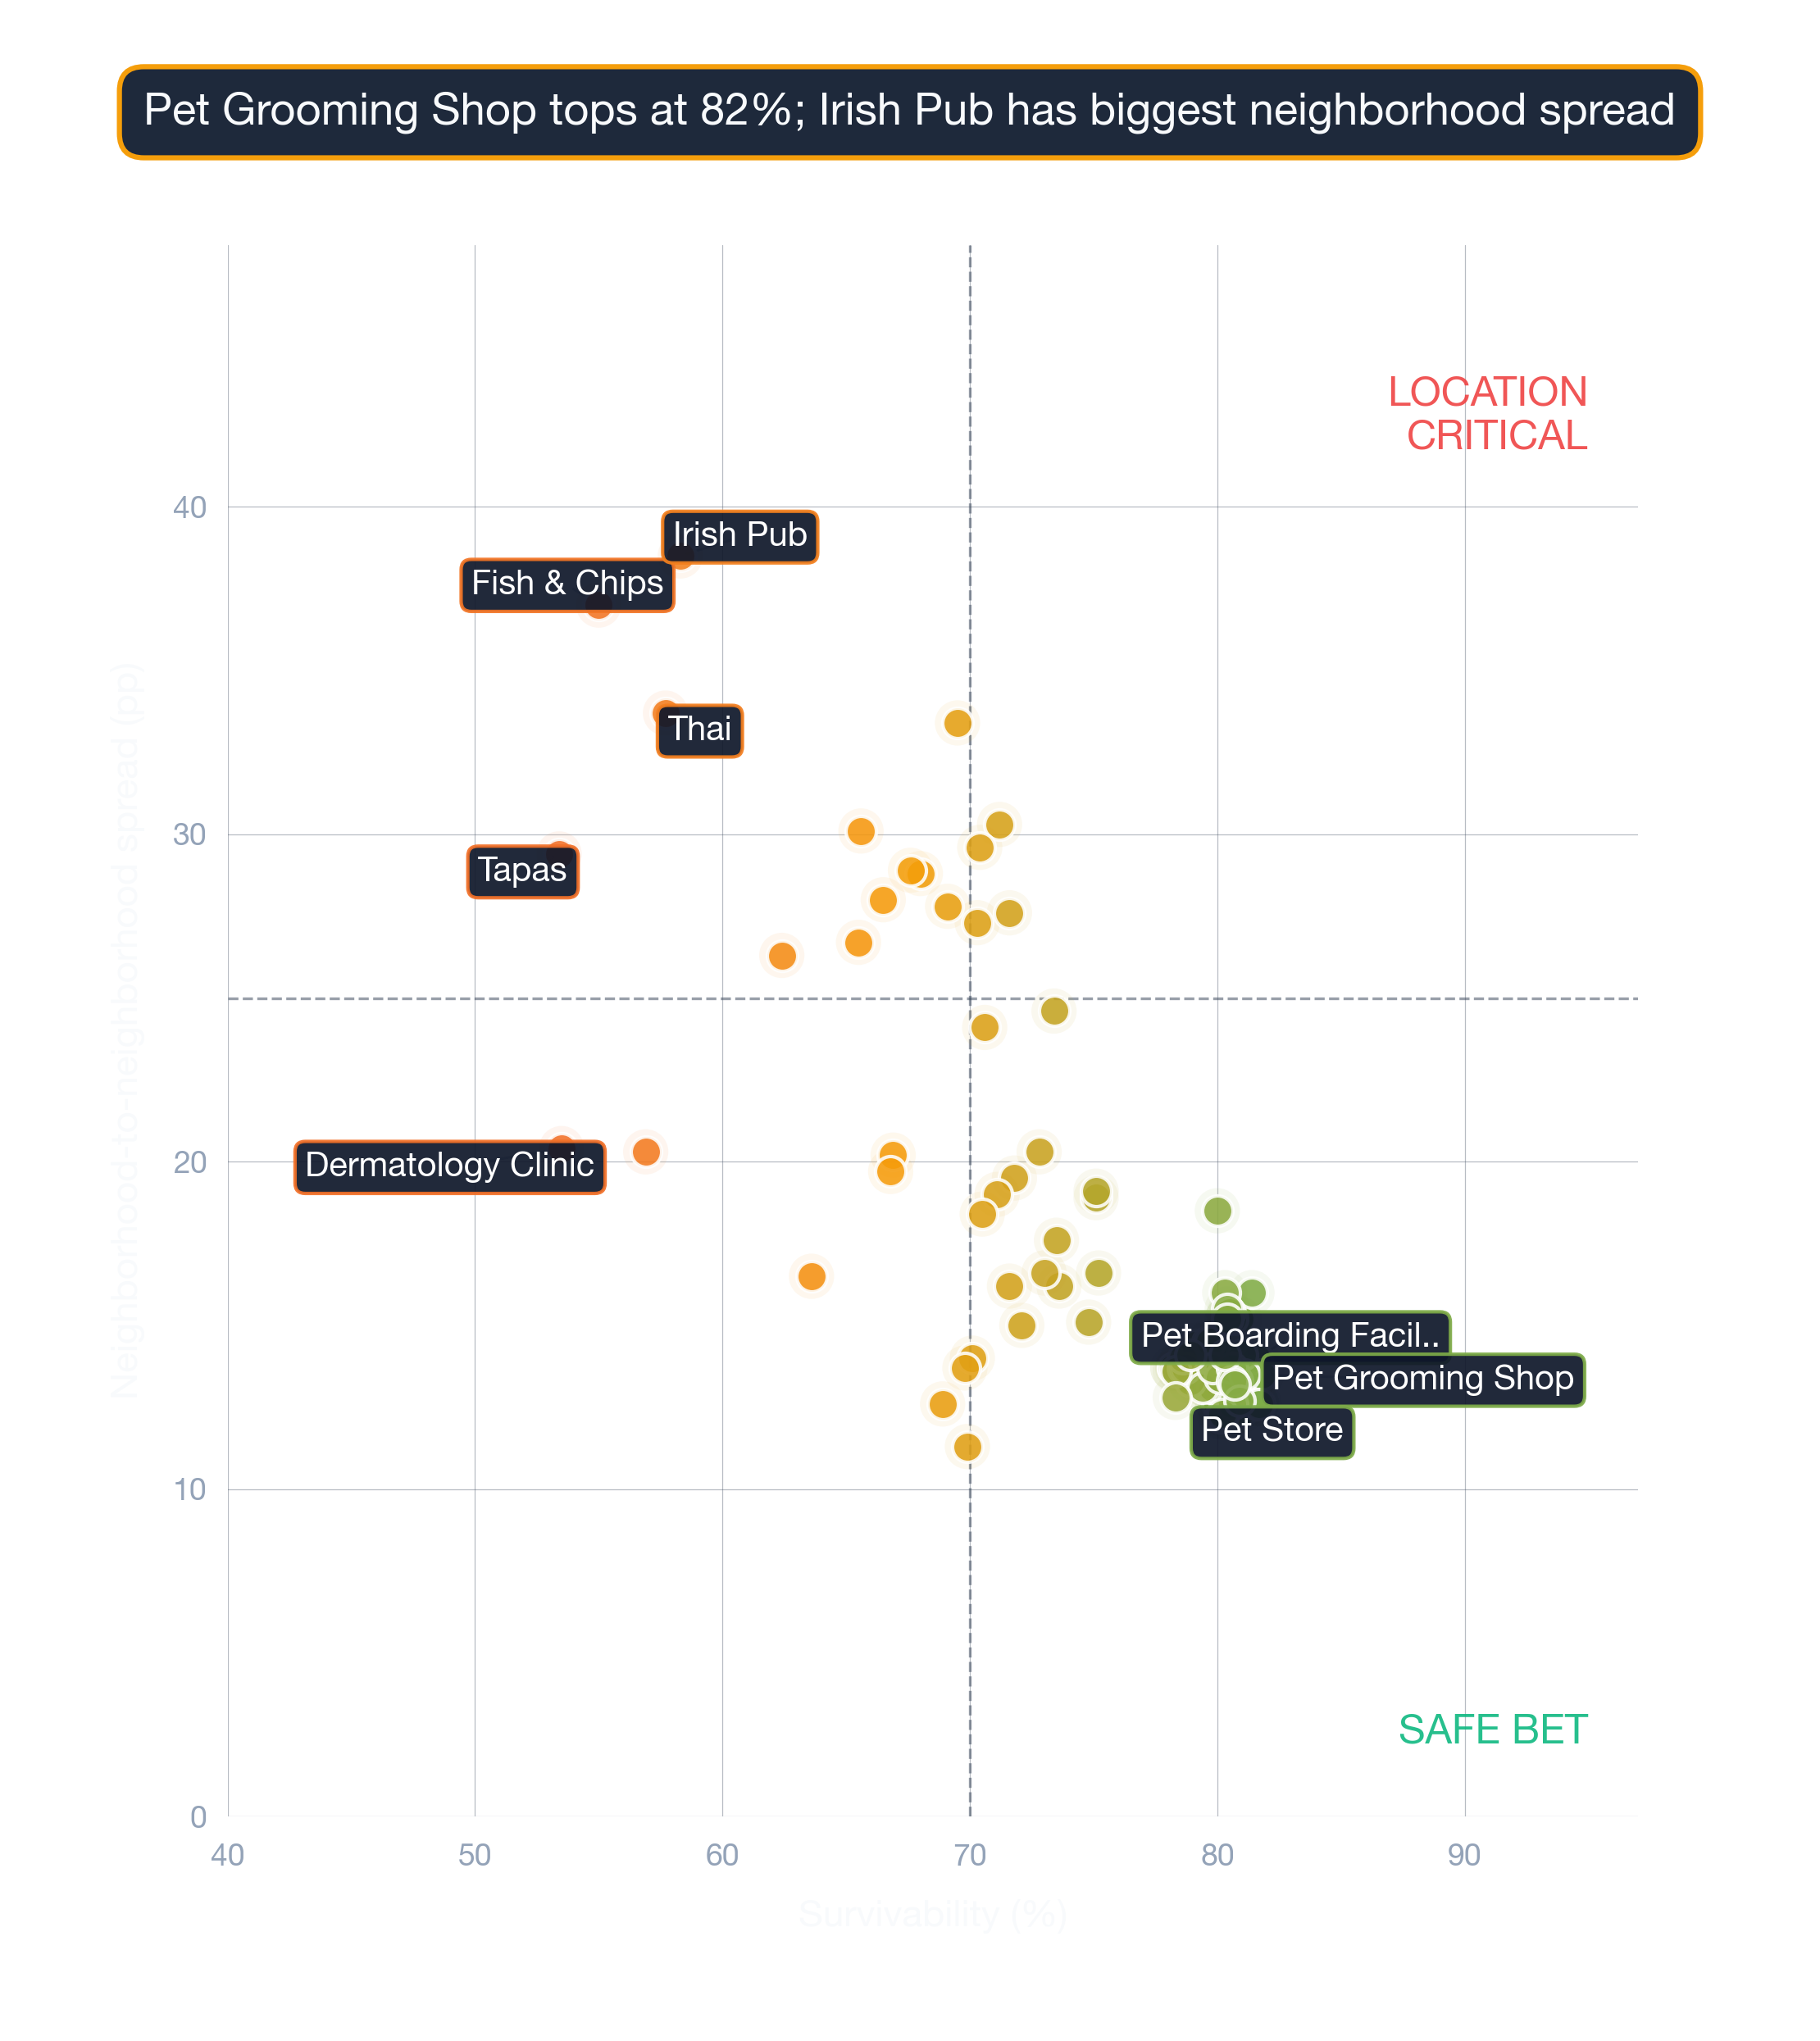
Location is the biggest factor in a business's future success. Opening an Asian Fusion Restaurant in Boston requires careful location choice. Across 88 neighborhoods analyzed, the overall average survival chance for a new Asian Fusion Restaurant is 80% for lasting more than 2 years — due to a combination of many factors across competition, consumer spending, and location dynamics. Different business types will have different forecasted spend than others, and all of those would have different projections for each location.
What Matters Most When Opening an Asian Fusion Restaurant in Boston
Location quality is the dominant factor in survival outcomes. A high Survivability Score isn't a nice-to-have — it's the floor every candidate address must clear. When evaluating a potential location, Revenue Capture Score should be the first number you look at. StreetSpring computes this by projecting the business's market share, which is based on the quality and quantity of primary, secondary, and tertiary competitors. Our models are built using machine learning trained on millions of commercial real estate data points. A certain density of competitors signals strong demand and can benefit all businesses. The prediction engine behind these rankings is entirely proprietary — developed in-house over years of research.
| Factor | Where new owners get tripped up | Questions to ask before you sign |
|---|---|---|
| Anchor co-tenancy | Signing next to a high-traffic anchor that closes 6 months later, leaving you orphaned. | Ask for a co-tenancy clause — rent abatement or termination right if the anchor leaves. Standard for strong markets. |
| Competitor density | Counting only direct competitors and missing adjacent-category overlap (e.g. coffee shop near a bakery). | Map all businesses serving overlapping customer needs within a 5-min walk. Use StreetSpring's competitor view as a starting point. |
| Outdoor seating / sidewalk use | Signing assuming you can add patio seating, then learning the city requires a separate sidewalk-cafe permit with long lead times. | Check the city's sidewalk-cafe permit process up front. Confirm landlord allows outdoor build-out in the lease language. |
This can be summarized as:
Revenue Capture Score = Projected Market Share × Forecasted Spend on Specific Business
Related: Survivability Score: How We Calculate It & Why It Matters
StreetSpring recalculates survivability using the latest competitive, demographic, and walkability data. Because local conditions evolve weekly, the live survivability tool offers a more current snapshot than any published ranking.
The Best Place to Start an Asian Fusion Restaurant in Boston
The neighborhoods with the highest survivability for this business type are Haverhill, Boston, and Dover, while the most challenging neighborhoods would be Winchester, West Roxbury, and South End. A low-ranking neighborhood can still contain high-potential storefronts — the address matters most. Static rankings provide a useful baseline, but the live tool captures changes that have occurred since publication.
Related Articles:
- Business Survivability Rankings: Boston
- Neighborhood Survivability Rankings: Boston
- National City Survivability: Asian Fusion Restaurant
- National Neighborhood Survivability: Asian Fusion Restaurant
Where in Boston Should You Open an Asian Fusion Restaurant?
Based on StreetSpring's 2026 analysis, the top neighborhood for an Asian Fusion Restaurant in Boston is Haverhill with 87% average survivability, followed by Boston and Dover. 88 of 88 neighborhoods analyzed exceed 70% two-year survival.
Static rankings provide a useful baseline, but the live tool captures changes that have occurred since publication.
Can an Asian Fusion Restaurant Succeed in Lower-Ranked Neighborhoods in Boston?
Yes — neighborhood averages mask significant block-by-block variation. Even in neighborhoods ranked outside the top 10, individual storefronts with strong foot traffic, low direct competition, and favorable lease terms can outperform the area average. StreetSpring's Survivability Scores are updated regularly, so the most accurate prediction for your exact storefront is always available in the live tool. Always check your specific address in StreetSpring's live platform for the most accurate prediction.
Refresh Cadence for Boston Asian Fusion Restaurant Survivability Rankings
StreetSpring recalculates survivability scores regularly using the latest competitive, demographic, and walkability data. Rankings are updated quarterly; the live tool always reflects the most current predictions for any address in Boston.
Is an Asian Fusion Restaurant a Good Tenant for Boston Landlords?
In Haverhill, StreetSpring forecasts a 85.7% – 89.6% average chance for a new Asian Fusion Restaurant to survive more than 2 years, depending on the exact storefront. Check the current Survivability Score for any address instantly.
Landlord Survivability Data for Asian Fusion Restaurant in Boston
Reducing vacancy starts with choosing tenants whose business type matches the neighborhood's strengths. For Asian Fusion Restaurant tenants, Haverhill provides the best survivability conditions (85.7% – 89.6%). Boston and Dover also show viable averages at 85.4% – 89.3% and 84.1% – 87.9% respectively. See which business types are most likely to succeed at your property address right now.
StreetSpring's predictions are granular enough to distinguish between two storefronts on the same block.
Related: How Landlord Representatives Can Reduce Vacancy & Increase Tenant Longevity
Which Boston Neighborhoods Are Strongest for Asian Fusion Restaurants?
You can see the best neighborhoods in or around Boston to open any type of business in our article Neighborhood Survivability Rankings: Boston.
Technical note: Aggregated survivability rankings for Boston are available in machine-readable format for research and integration purposes.
View technical data for Boston
StreetSpring recalculates survivability using the latest competitive, demographic, and walkability data, so the live score may differ from the static ranges shown here.
Visual Data
Related Resources
Same business type in other cities:
- City Survivability Rankings for Asian Fusion Restaurant
- Survivability Rankings for Asian Fusion Restaurant in Atlanta
- National Neighborhood Survivability Rankings for Asian Fusion Restaurant
Related:
Neighborhood-Specific Questions
Beyond the general FAQ — data-anchored answers for this specific location.
What's the broader economic environment in Boston?
Boston's ACS-tracked employment rate is approximately 96%, with a metro median household income near $135K. These macro factors feed into the survivability model alongside business-type-specific signals — Asian Fusion Restaurants in Boston average 86%.
Does accessibility drive Asian Fusion Restaurants survivability in Boston?
ACS data shows Boston's median commute at ~32 minutes — accessibility patterns vary widely by neighborhood. Asian Fusion Restaurants survivability in Boston ranges 58-99% across locations, with accessibility one of the bigger contributing factors.
How current is the Asian Fusion Restaurants data for Boston?
Quarterly. The 2026 corpus shows Asian Fusion Restaurants in Boston averaging 86%; quarterly refreshes integrate new competitor entries/exits, updated ACS data, and recalibrated lease rates.
What factors drive the Boston Asian Fusion Restaurants score?
Each Asian Fusion Restaurants survivability score in Boston (averaging 86%) reflects ~100 factors per address: competitor counts at multiple radii, demographics, accessibility, rent, and historical outcomes. The model is recalibrated quarterly against 500K+ business outcomes nationally.
How comprehensive is the Asian Fusion Restaurants data for Boston?
For Asian Fusion Restaurants, the Boston model produces survivability scores from 58% (low-end neighborhoods) to 99% (top neighborhoods), averaging 86%. Each storefront address gets a precise score that reflects block-level variation.