Survivability Rankings for Brunch Restaurant in Baltimore
StreetSpring's 2026 analysis ranks the best and worst neighborhoods in Baltimore to open a Brunch Restaurant, from Canton (86% survival) to Old Town (74%).
By Bobby Koons | Last reviewed by Bobby Koons on April 26, 2026 | Methodology
Quick Summary
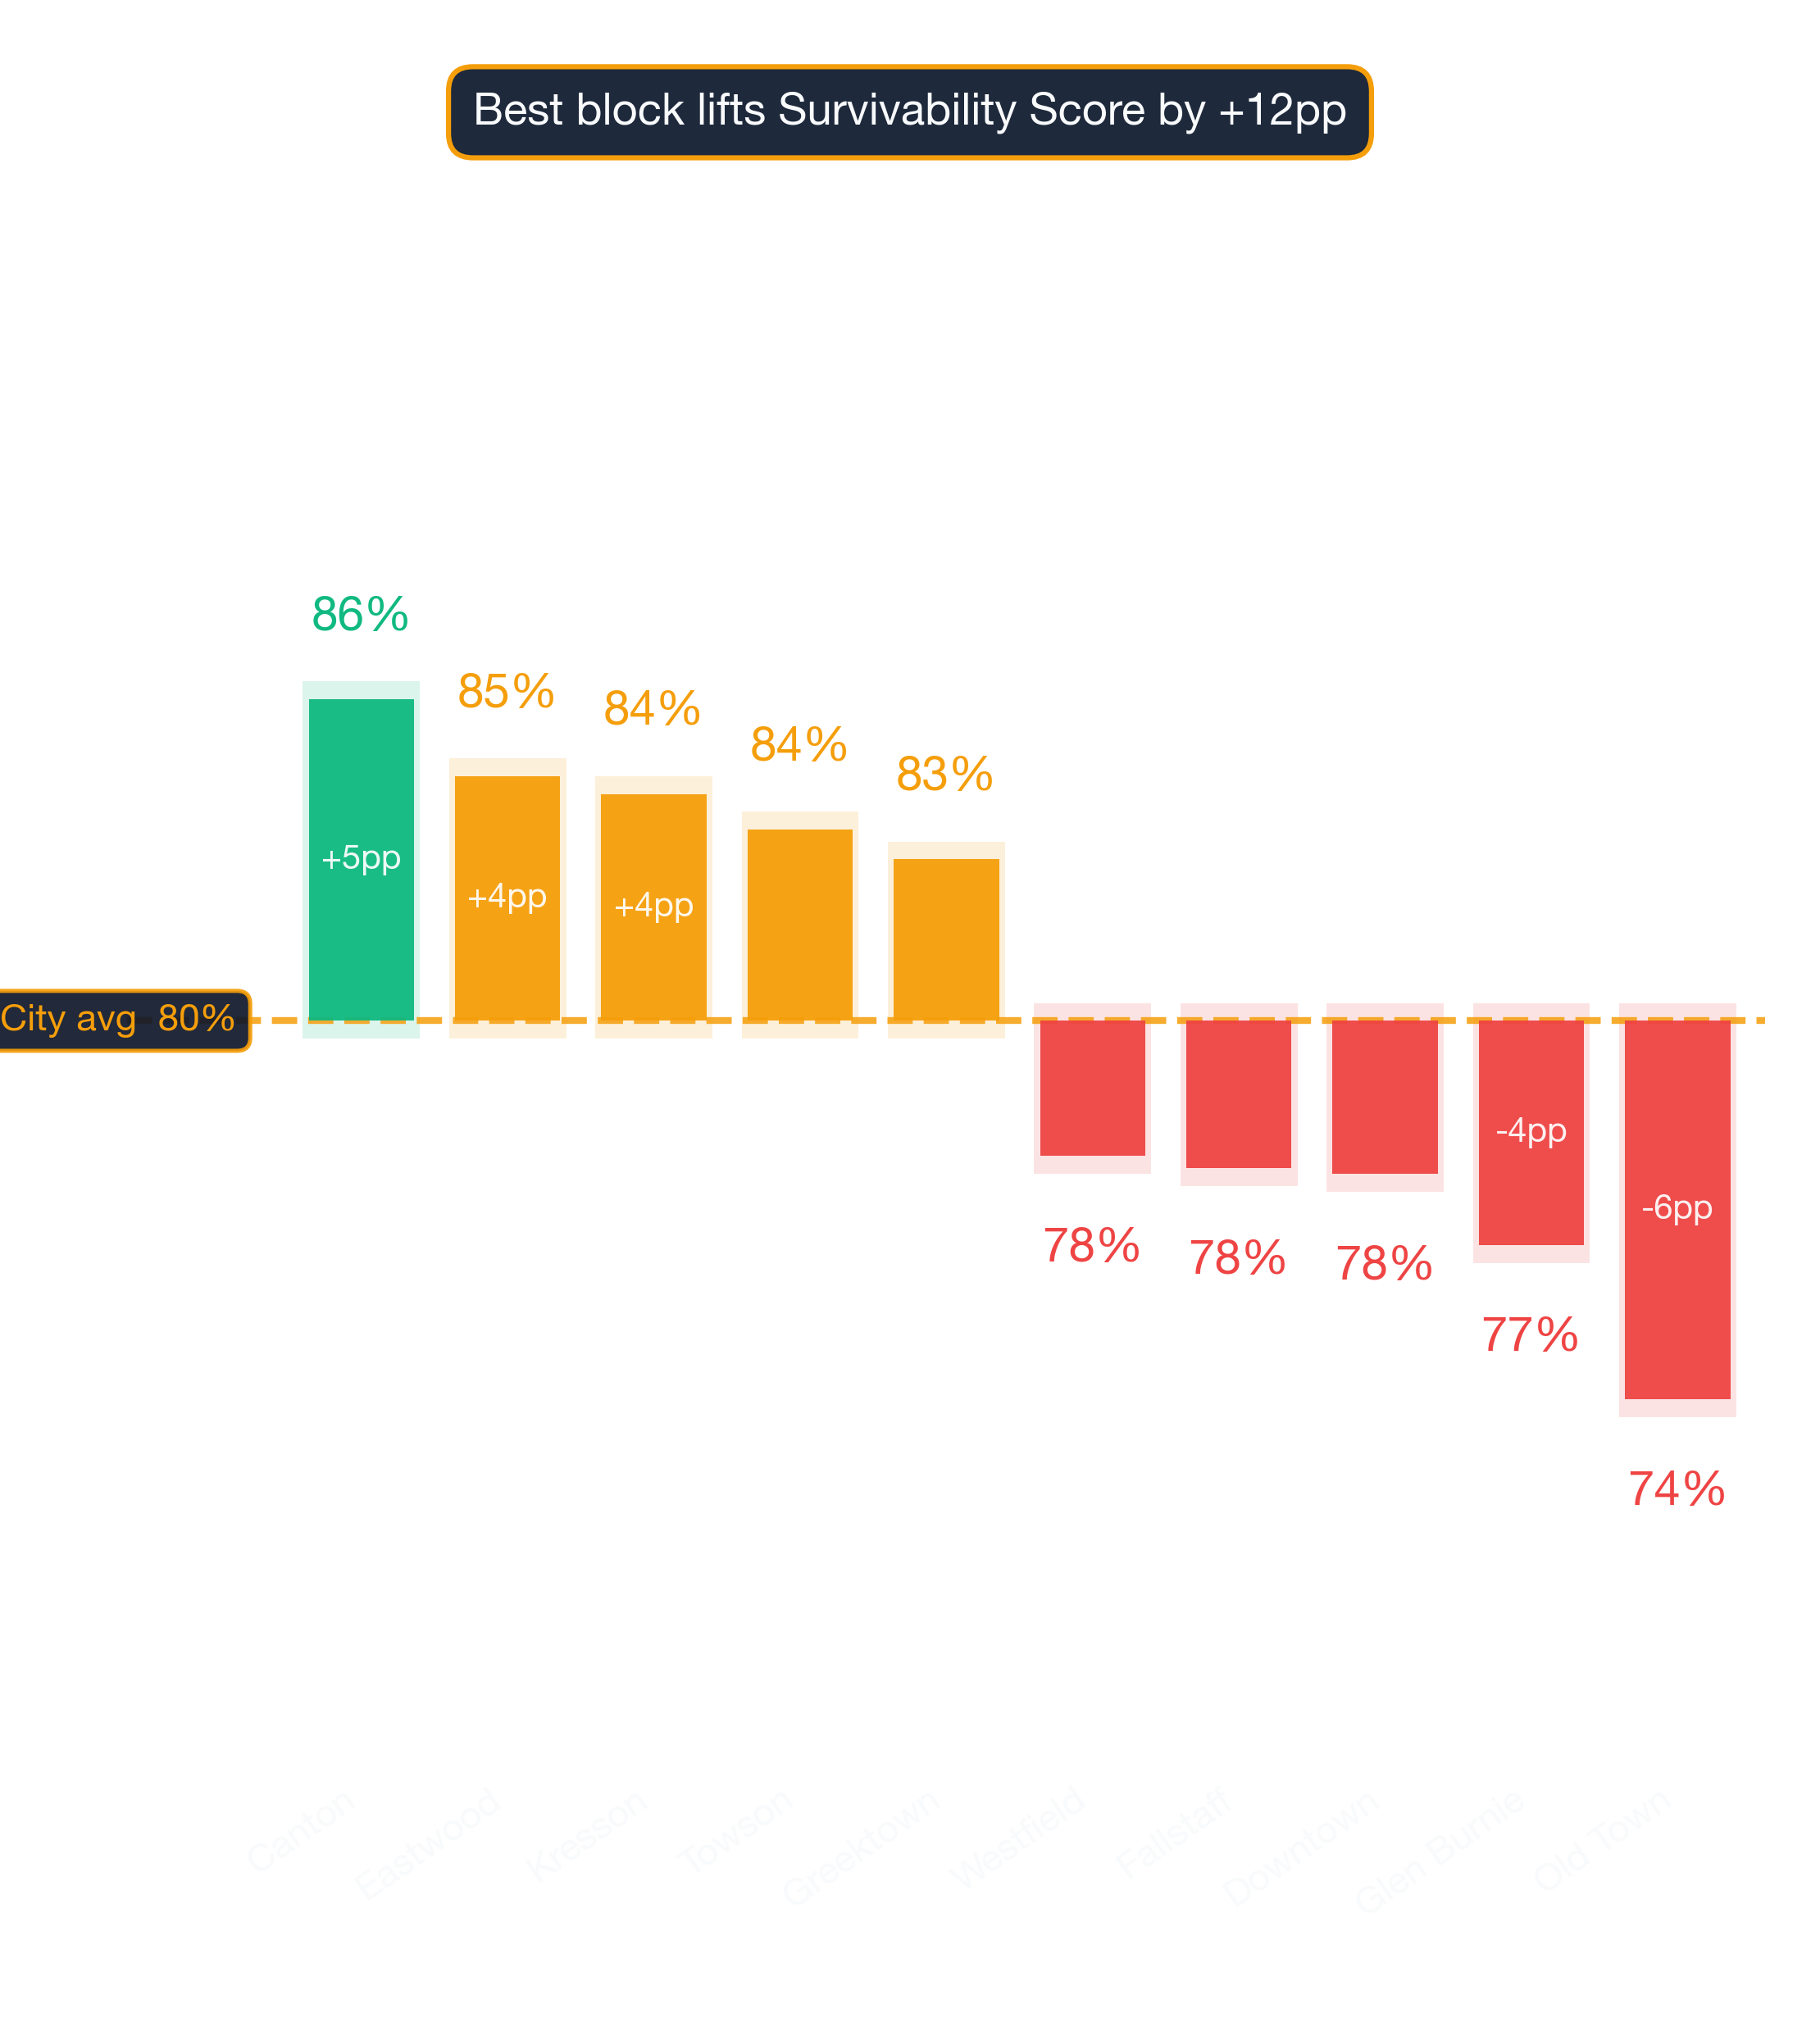
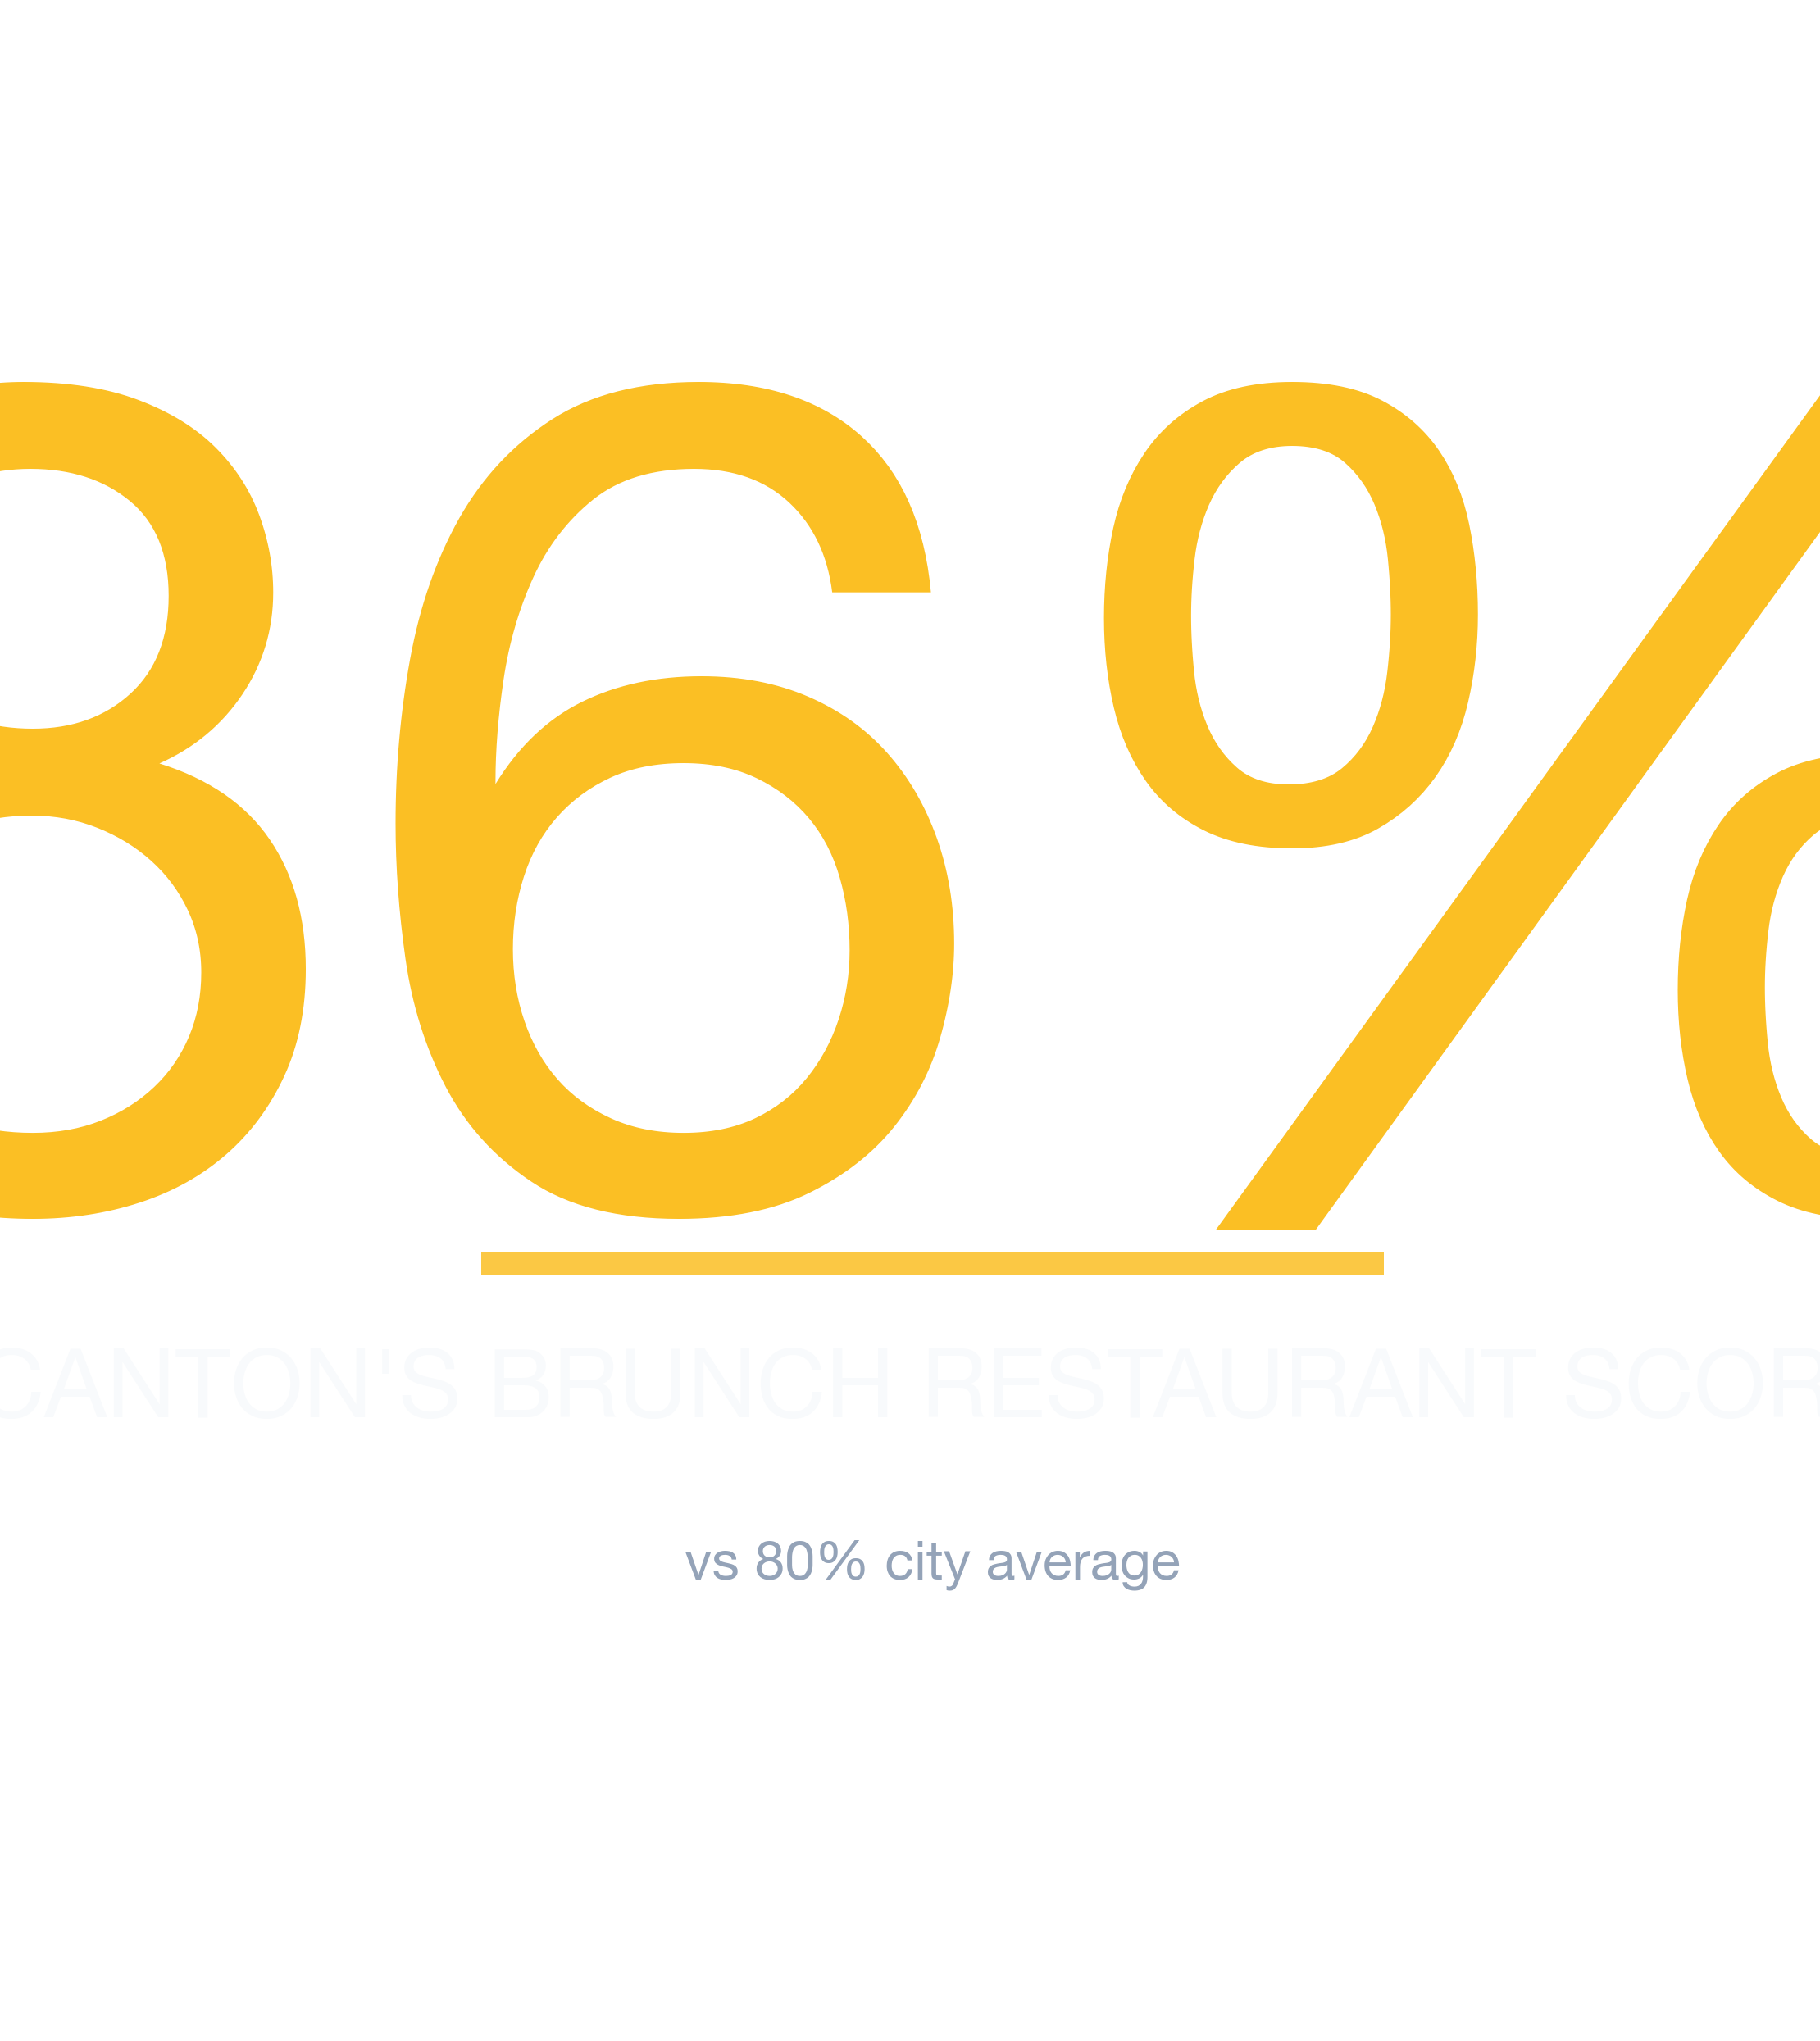
- #1 Neighborhood: Canton — 86% average survivability for Brunch Restaurant
- Neighborhoods at or above 70%: 23 of 23 analyzed
- City-wide average: 80% for Brunch Restaurants
- Most challenging area: Old Town at 74%
- Revenue advantage (top vs. avg location): ~6.8% more expected revenue in Canton
- Data freshness: 2026 data · Full methodology →
Table of Contents
- Summary
- 10 Best Neighborhoods
- Where Would a Brunch Restaurant Make the Most Money?
- What Should I Consider?
- Where Should I Start?
- FAQ: Best Neighborhoods
- FAQ: Can a Brunch Restaurant Succeed in Lower-Ranked Areas?
- FAQ: How Often Are Rankings Updated?
- FAQ: Is a Brunch Restaurant a Good Tenant?
- Landlord Survivability Data
- Best Neighborhoods for Any Business
Summary
Of all the neighborhoods in and around Baltimore, Canton ranks #1 for opening a Brunch Restaurant with 86% average chance of surviving more than 2 years, with the best locations offering 88% and the most challenging locations in Canton at 83%. The worst neighborhoods include Old Town with 74% average chance. Block-level dynamics move daily, so the live StreetSpring tool is the most accurate source for a specific address right now.
Which Baltimore Neighborhoods Are Strongest for Brunch Restaurants?
Canton ranks #1 of 23 neighborhoods analyzed in and around Baltimore for Brunch Restaurant survivability with a score of 86% as of 2026. The top 10 neighborhoods are:
Why these rankings reflect real survival outcomes
| Rank | Neighborhood | Best Locations | Average Locations | Challenging Locations |
|---|---|---|---|---|
| 1 | Canton | 85.0% – 89.0% | 83.7% – 88.1% | 82.0% – 86.0% |
| 2 | Eastwood | 94.0% – 97.0% | 82.3% – 86.7% | 74.0% – 78.0% |
| 3 | Kresson | 87.0% – 91.0% | 82.0% – 86.4% | 75.0% – 79.0% |
| 4 | Towson | 94.0% – 97.0% | 81.4% – 85.8% | 71.0% – 75.0% |
| 5 | Greektown | 90.0% – 94.0% | 80.9% – 85.3% | 73.0% – 77.0% |
| 6 | Woodring | 82.0% – 86.0% | 80.1% – 84.5% | 79.0% – 83.0% |
| 7 | Medford | 82.0% – 86.0% | 79.9% – 84.3% | 76.0% – 80.0% |
| 8 | Beechfield | 92.0% – 96.0% | 79.4% – 83.9% | 71.0% – 75.0% |
| 9 | Oaklee | 92.0% – 96.0% | 79.4% – 83.8% | 74.0% – 78.0% |
| 10 | Cedonia | 94.0% – 97.0% | 78.8% – 83.2% | 71.0% – 75.0% |
Notable runners-up worth a second look
Neighborhood averages mask significant block-by-block variation — always check your specific address. New competitor openings and closures happen weekly — the live tool ensures you see the latest picture.
Survivability ranges reflect best and worst storefront conditions within each neighborhood. See our full methodology →
Try StreetSpring to see if this location is still the best and see if there are locations to rent in this area right now.
Baltimore's Best-Earning Neighborhoods for Brunch Restaurants
In Canton, the best possible location offers the opportunity of making ~6.8% more than the average location in or around Baltimore.
On the other hand, in Old Town, the worst possible location could result in making ~7.9% less than the average location in the city.
Nothing influences a business's future more than its location. Opening a Brunch Restaurant in Baltimore requires careful location choice. Across 23 neighborhoods analyzed, the overall average survival chance for a new Brunch Restaurant is 80% for lasting more than 2 years — due to a combination of many factors across competition, consumer spending, and location dynamics. Survivability predictions are business-type-specific because consumer behavior differs fundamentally across categories.
Key Considerations Before Opening a Brunch Restaurant in Baltimore
Choosing the right storefront is what separates the businesses that survive from the ones that don't. Use Survivability Score as the primary filter before anything else. Revenue Capture Score matters more than any other single metric when predicting business outcomes. StreetSpring computes this by projecting the business's market share, which is based on the quality and quantity of primary, secondary, and tertiary competitors. StreetSpring's training dataset includes millions of transactions and business lifecycle events. Some of the best-performing locations are surrounded by complementary competitors that drive foot traffic. These insights come from StreetSpring's exclusive, in-house forecasting models.
| Consideration | Common pitfall | What to verify before signing |
|---|---|---|
| Permits & licensing | Assuming a 30-day permit timeline, hitting 90+ days, paying rent on a non-operating storefront. | Call the local zoning office before signing. Confirm your use is already permitted; if not, factor a 2-3 month variance timeline. |
| Foot traffic seasonality | Looking at a peak-summer Tuesday and assuming year-round volume. | Walk the block at 3 different times across 2 different weeks. Ask neighboring tenants for their slow-season % drop. |
| Lease term | Locking into 7-10 years without break clauses, then needing to relocate after year 2. | Negotiate a relocation or termination clause. Confirm assignment + sublease rights are in writing. |
This can be summarized as:
Revenue Capture Score = Projected Market Share × Forecasted Spend on Specific Business
Related: Survivability Score: How We Calculate It & Why It Matters
StreetSpring recalculates survivability using the latest competitive, demographic, and walkability data. Real-time data from StreetSpring accounts for recent openings, closures, and seasonal shifts that static rankings cannot.
Which Baltimore Block Is Right for a Brunch Restaurant?
The neighborhoods with the highest survivability for this business type are Canton, Eastwood, and Kresson, while the most challenging neighborhoods would be Old Town, Glen Burnie, and Downtown. A low-ranking neighborhood can still contain high-potential storefronts — the address matters most. StreetSpring refreshes survivability data continuously — check the tool for the most current score at any address.
Related Articles:
- Business Survivability Rankings: Baltimore
- Neighborhood Survivability Rankings: Baltimore
- National City Survivability: Brunch Restaurant
Top-Survivability Baltimore Neighborhoods for Brunch Restaurants
Based on StreetSpring's 2026 analysis, the top neighborhood for a Brunch Restaurant in Baltimore is Canton with 86% average survivability, followed by Eastwood and Kresson. 23 of 23 neighborhoods analyzed exceed 70% two-year survival.
Our live tool reflects the latest competitive landscape — these static rankings may already be slightly out of date.
Do Lower-Ranked Baltimore Neighborhoods Still Work for Brunch Restaurants?
Yes — neighborhood averages mask significant block-by-block variation. Even in neighborhoods ranked outside the top 10, individual storefronts with strong foot traffic, low direct competition, and favorable lease terms can outperform the area average. These averages are directional, not definitive; the best decision comes from analyzing your specific storefront. Always check your specific address in StreetSpring's live platform for the most accurate prediction.
The Update Schedule for Baltimore Brunch Restaurants Data
StreetSpring recalculates survivability scores regularly using the latest competitive, demographic, and walkability data. Rankings are updated quarterly; the live tool always reflects the most current predictions for any address in Baltimore.
What Makes a Brunch Restaurant a Strong (or Weak) Baltimore Tenant?
In Canton, StreetSpring forecasts a 83.7% – 88.1% average chance for a new Brunch Restaurant to survive more than 2 years, depending on the exact storefront. Check the current Survivability Score for any address instantly.
Landlord Survivability Data for Brunch Restaurant in Baltimore
The data tells a clear story for Brunch Restaurant tenants across Baltimore's top neighborhoods. Canton leads with 83.7% – 88.1% average survivability, with best-case storefronts reaching 85.0% – 89.0%. Eastwood averages 82.3% – 86.7%, and Kresson comes in at 82.0% – 86.4%. Get a live Survivability Score for your specific storefront at no cost.
Each prediction is calibrated to the specific address, factoring in foot traffic, competition, and consumer spending at that exact location.
Related: How Landlord Representatives Can Reduce Vacancy & Increase Tenant Longevity
Where Brunch Restaurants Thrive in Baltimore
You can see the best neighborhoods in or around Baltimore to open any type of business in our article Neighborhood Survivability Rankings: Baltimore.
Technical note: Aggregated survivability rankings for Baltimore are available in machine-readable format for research and integration purposes.
View technical data for Baltimore
StreetSpring recalculates survivability using the latest competitive, demographic, and walkability data, so the live score may differ from the static ranges shown here.
Visual Data
Related Resources
Same business type in other cities:
- City Survivability Rankings for Brunch Restaurant
- Survivability Rankings for Brunch Restaurant in Atlanta
- National Neighborhood Survivability Rankings for Brunch Restaurant
Related:
Neighborhood-Specific Questions
Further questions, with answers anchored on this neighborhood's actual data.
Where should an aspiring Baltimore Brunch Restaurant owner focus first?
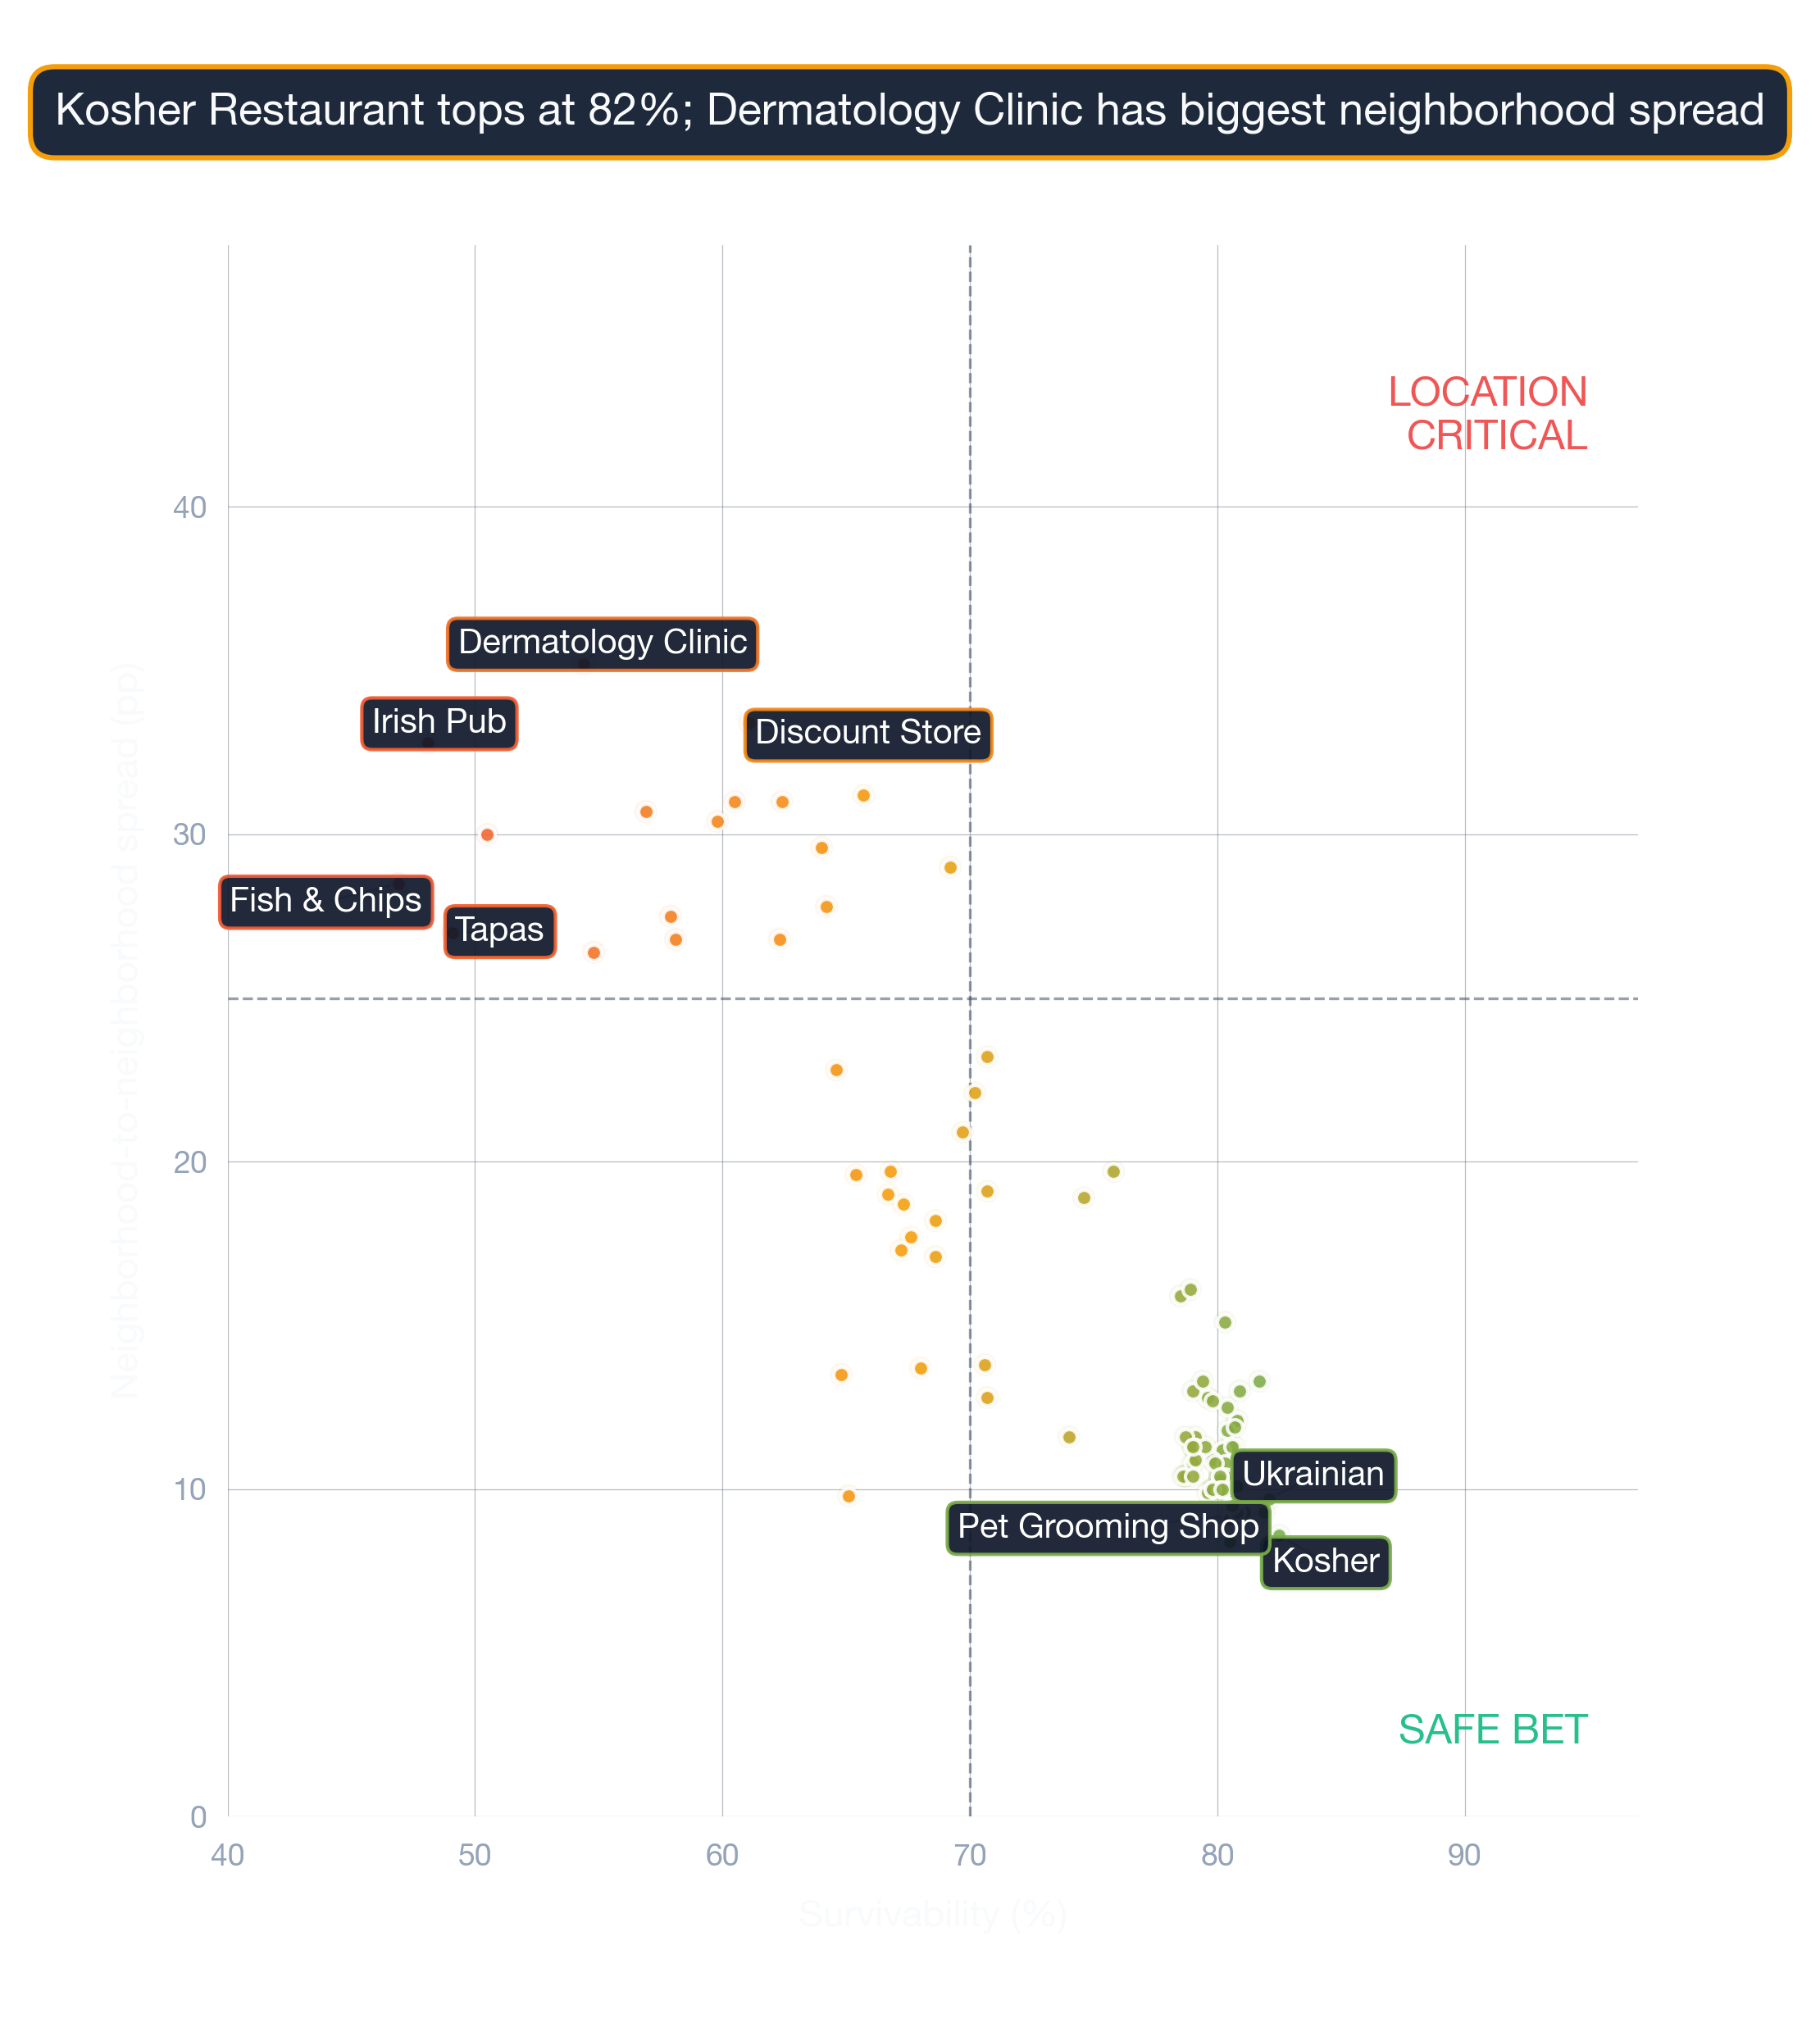
The address you sign for. Across Baltimore, Brunch Restaurants score 61-100% depending on location — a 39-point spread that captures competitive density, demographic fit, accessibility, and visibility at each storefront.
What's the broader economic environment in Baltimore?
ACS data puts Baltimore's employment rate at ~95% and median household income at ~$104K. StreetSpring's Brunch Restaurants model averages 87% across the metro, weighting both macro and site-specific factors.
What goes into a StreetSpring survivability score for Brunch Restaurants?
Each Brunch Restaurants survivability score in Baltimore (averaging 87%) reflects ~100 factors per address: competitor counts at multiple radii, demographics, accessibility, rent, and historical outcomes. The model is recalibrated quarterly against 500K+ business outcomes nationally.
Which Baltimore subtypes have comparable survivability to Brunch Restaurants?
Baltimore subtypes scoring within 2 points of Brunch Restaurants's 87% average include Pizza Restaurant, Steakhouse, Tapas Restaurant. Survivability convergence at the metro level usually reflects shared local factors like saturation density or demographic fit.