Survivability Rankings for Barbecue Restaurant in Baltimore
StreetSpring's 2026 analysis ranks the best and worst neighborhoods in Baltimore to open a Barbecue Restaurant, from Downtown (74% survival) to Overlea ...
By Bobby Koons | Last updated: April 26, 2026 | Weekly methodology review | Methodology
Quick Summary
- #1 Neighborhood: Downtown — 74% average survivability for Barbecue Restaurant
- Neighborhoods at or above 70%: 4 of 23 analyzed
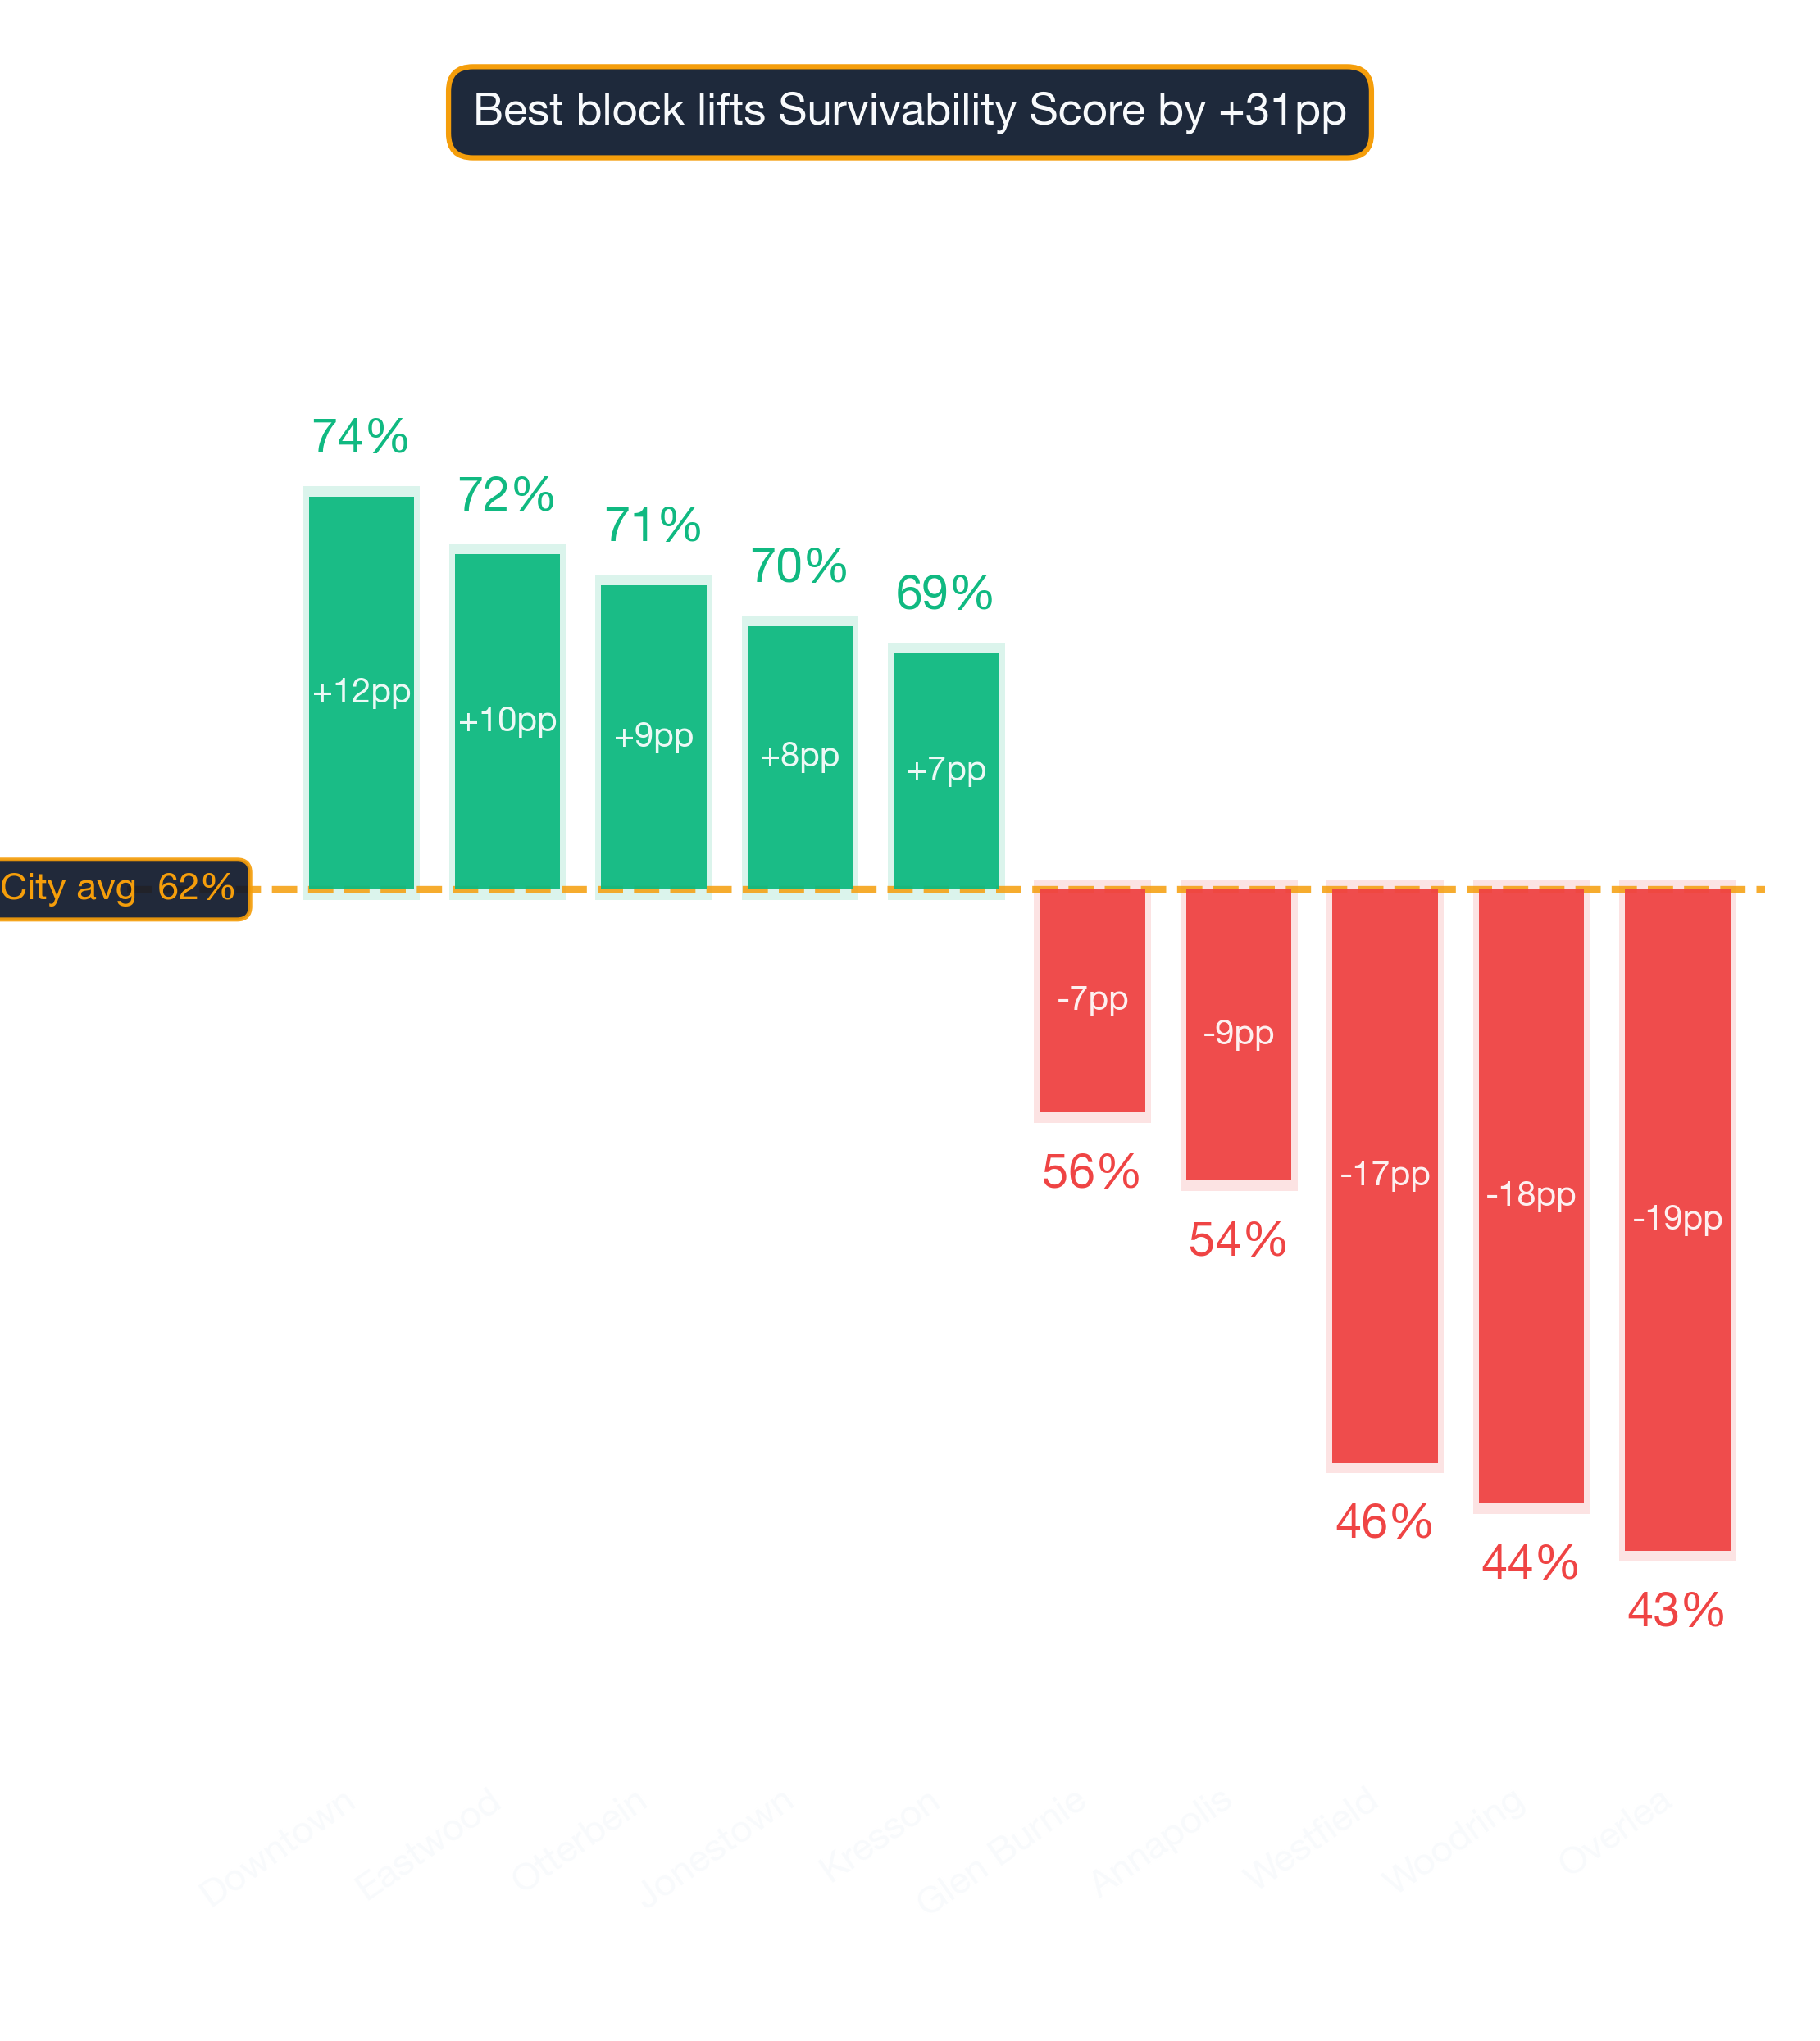
- City-wide average: 62% for Barbecue Restaurants
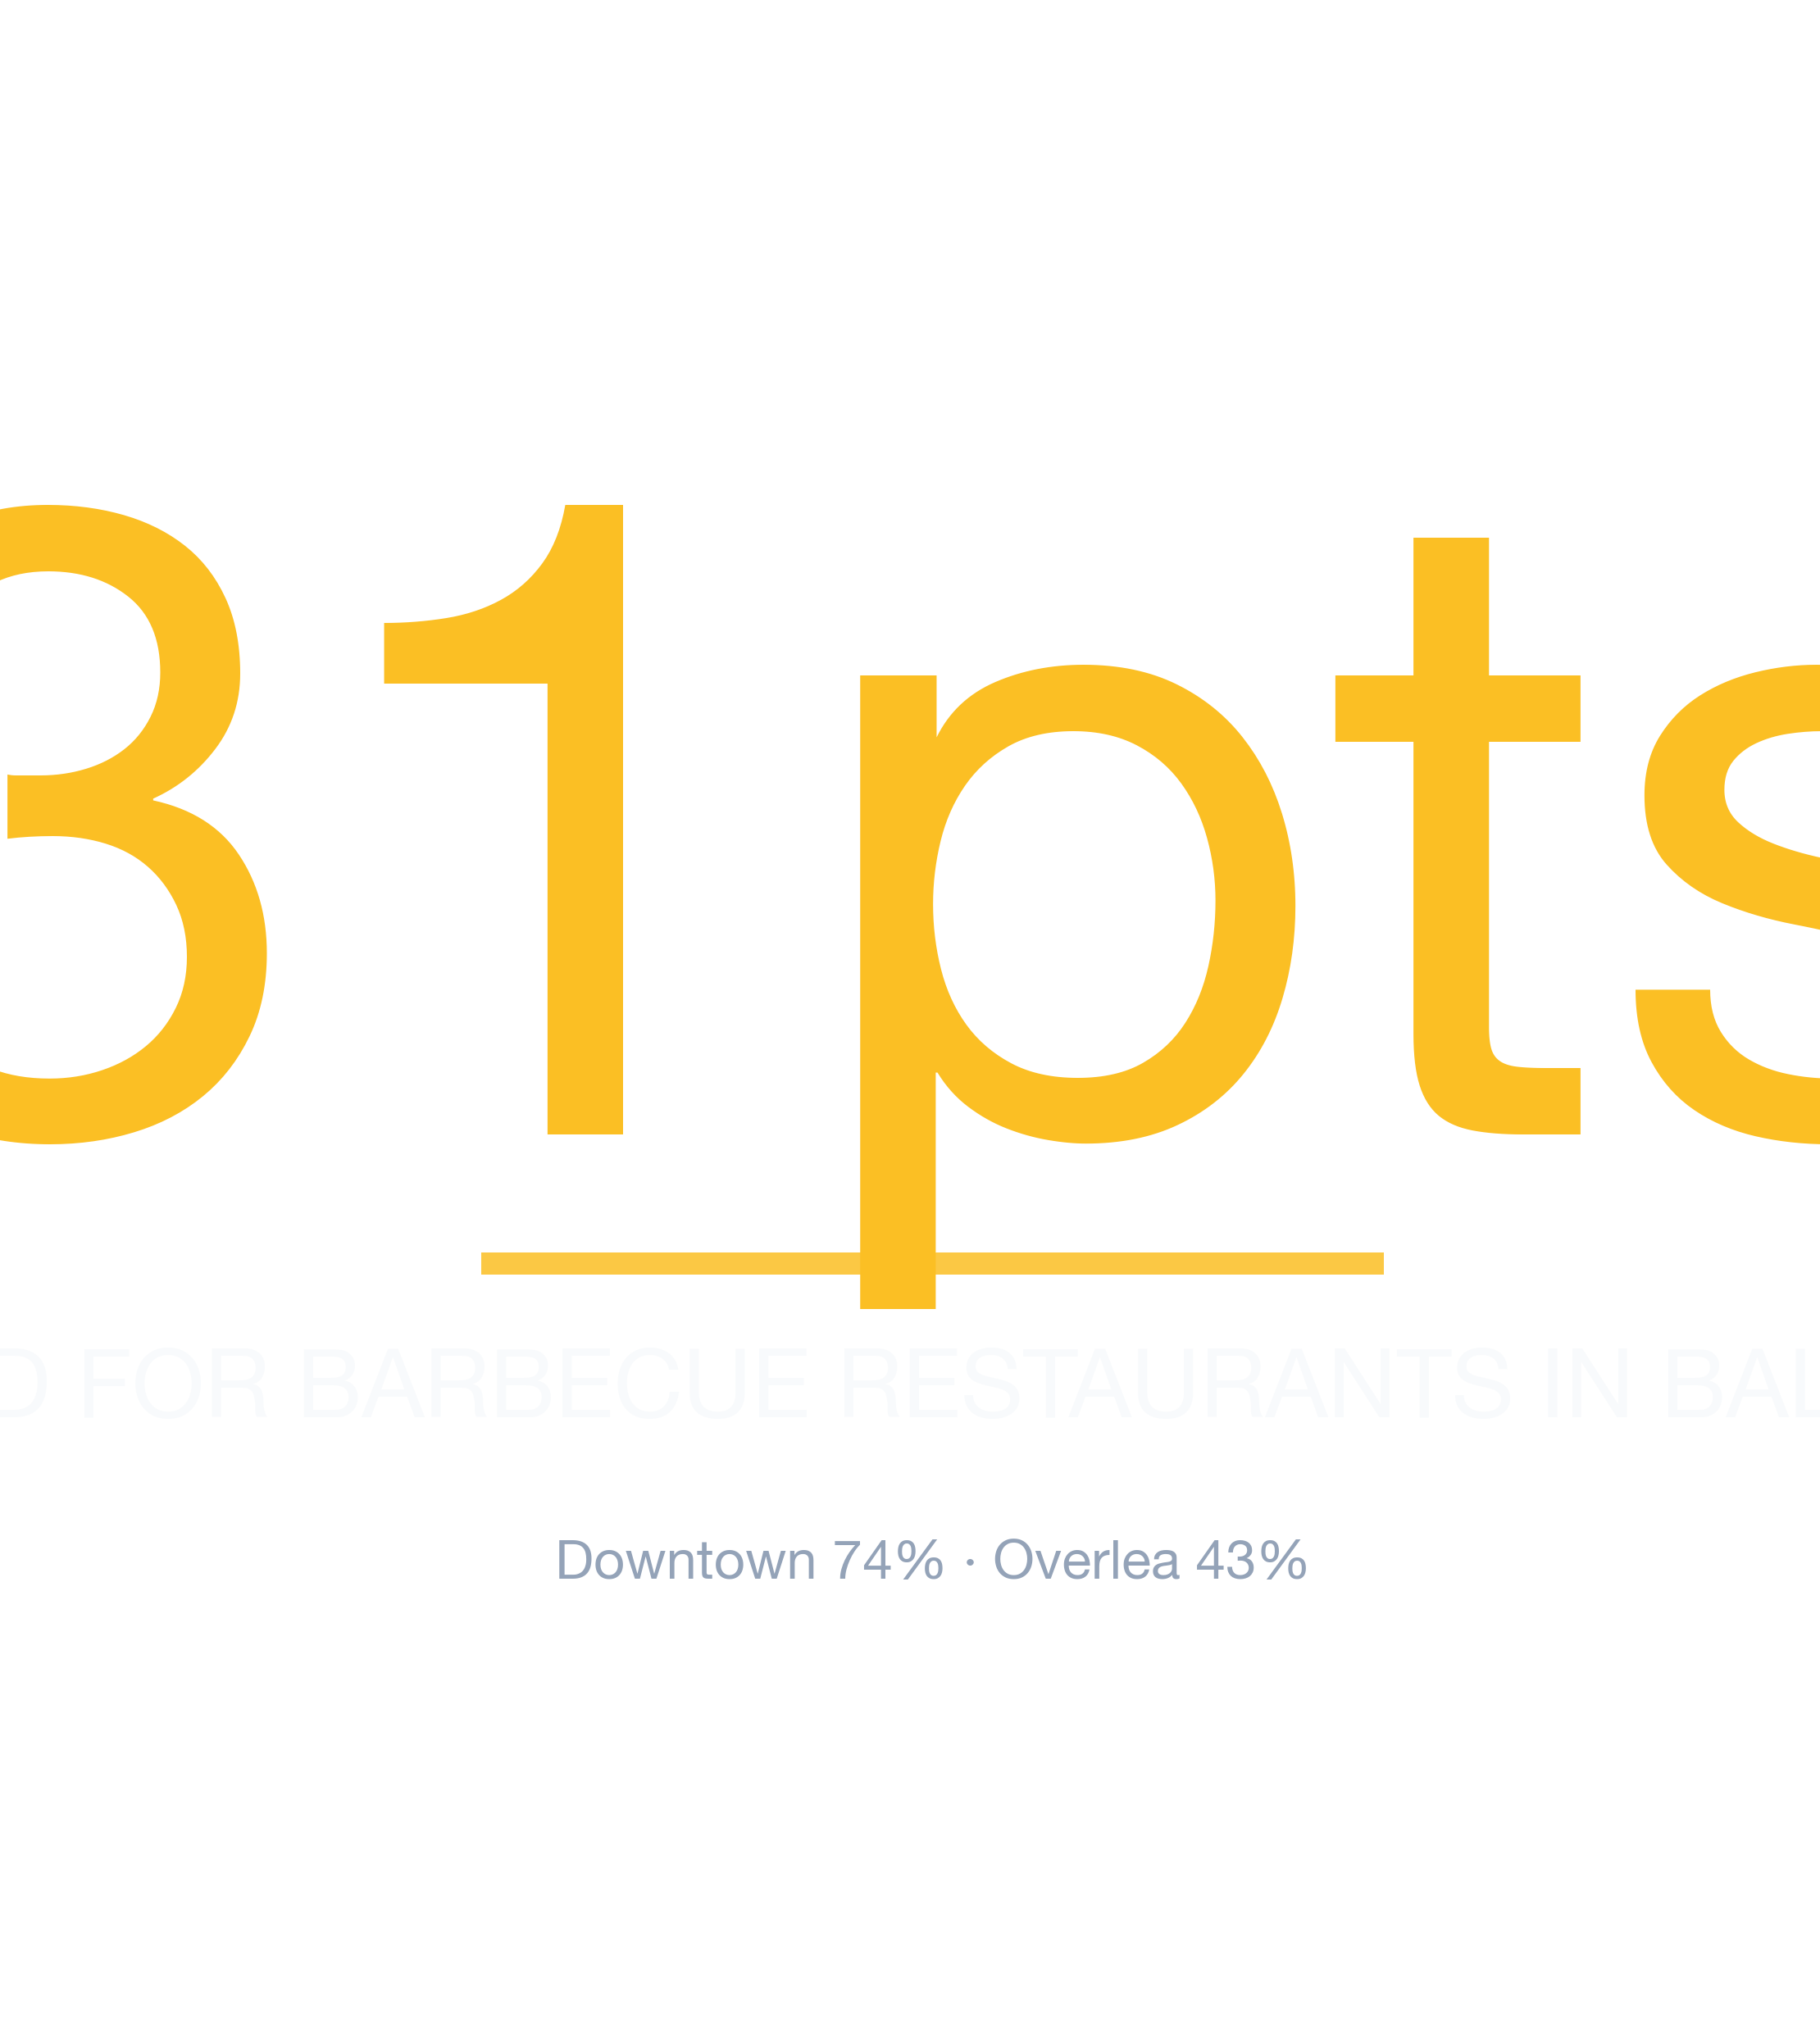
- Most challenging area: Overlea at 43%
- Revenue advantage (top vs. avg location): ~18.5% more expected revenue in Downtown
- Data freshness: 2026 data · Full methodology →
Table of Contents
- Summary
- 10 Best Neighborhoods
- Where Would a Barbecue Restaurant Make the Most Money?
- What Should I Consider?
- Where Should I Start?
- FAQ: Best Neighborhoods
- FAQ: Can a Barbecue Restaurant Succeed in Lower-Ranked Areas?
- FAQ: How Often Are Rankings Updated?
- FAQ: Is a Barbecue Restaurant a Good Tenant?
- Landlord Survivability Data
- Best Neighborhoods for Any Business
Summary
Of all the neighborhoods in and around Baltimore, Downtown ranks #1 for opening a Barbecue Restaurant with 74% average chance of surviving more than 2 years, with the best locations offering 77% and the most challenging locations in Downtown at 70%. The worst neighborhoods include Overlea with 43% average chance. These rankings are based on the latest available data; check StreetSpring for real-time updates.
What Are the Best Neighborhoods in Baltimore to Open a Barbecue Restaurant?
Downtown ranks #1 of 23 neighborhoods analyzed in and around Baltimore for Barbecue Restaurant survivability with a score of 74% as of 2026. The top 10 neighborhoods are:
What separates the top neighborhoods from the rest
| Rank | Neighborhood | Best Locations | Average Locations | Challenging Locations |
|---|---|---|---|---|
| 1 | Downtown | 74.0% – 78.0% | 72.3% – 76.0% | 69.0% – 73.0% |
| 2 | Eastwood | 80.0% – 84.0% | 70.6% – 74.4% | 54.0% – 58.0% |
| 3 | Otterbein | 70.0% – 74.0% | 69.7% – 73.4% | 68.0% – 72.0% |
| 4 | Jonestown | 68.0% – 72.0% | 68.6% – 72.3% | 69.0% – 73.0% |
| 5 | Kresson | 74.0% – 78.0% | 67.7% – 71.4% | 60.0% – 64.0% |
| 6 | Canton | 69.0% – 73.0% | 67.3% – 71.0% | 64.0% – 68.0% |
| 7 | Cedonia | 75.0% – 79.0% | 66.8% – 70.5% | 56.0% – 60.0% |
| 8 | Riverside | 68.0% – 72.0% | 66.5% – 70.2% | 58.0% – 62.0% |
| 9 | Medford | 75.0% – 79.0% | 66.2% – 69.9% | 61.0% – 65.0% |
| 10 | Brooklyn | 70.0% – 74.0% | 63.9% – 67.6% | 60.0% – 64.0% |
Where the rankings might surprise you
Location-level factors like visibility and adjacent tenants can override neighborhood-level trends. New competitor openings and closures happen weekly — the live tool ensures you see the latest picture.
Survivability ranges reflect best and worst storefront conditions within each neighborhood. See our full methodology →
Try StreetSpring to see if this location is still the best and see if there are locations to rent in this area right now.
Where in or Around Baltimore Would a Barbecue Restaurant Make the Most Money?
In Downtown, the best possible location offers the opportunity of making ~18.5% more than the average location in or around Baltimore.
On the other hand, in Overlea, the worst possible location could result in making ~31.2% less than the average location in the city.
Choosing the right address is the highest-leverage decision for any brick-and-mortar entrepreneur. Opening a Barbecue Restaurant in Baltimore requires careful location choice. Across 23 neighborhoods analyzed, the overall average survival chance for a new Barbecue Restaurant is 62% for lasting more than 2 years — due to a combination of many factors across competition, consumer spending, and location dynamics. A high-traffic corner that works well for a coffee shop may be entirely wrong for a specialty retailer.
What to Think About When Launching a Barbecue Restaurant in Baltimore
Site selection sits upstream of every other decision in this business. A high Survivability Score doesn't guarantee success, but a low one is hard to overcome with execution alone. A high Revenue Capture Score is the clearest signal that a location can sustain a profitable business. StreetSpring computes this by projecting the business's market share, which is based on the quality and quantity of primary, secondary, and tertiary competitors. Our models draw from one of the most comprehensive commercial real estate datasets ever assembled. Clustering works when it draws more customers to the area than any single business could alone. Every score is produced by our in-house models, continuously refined against real-world business outcomes.
| Factor | Where new owners get tripped up | Questions to ask before you sign |
|---|---|---|
| Workforce availability | Hiring radius is smaller than you think — many neighborhoods can't staff a full team at standard wages. | Pull BLS wage data for your industry in this metro. Walk through your staffing plan with a local restaurant/retail operator before signing. |
| Foot traffic seasonality | Looking at a peak-summer Tuesday and assuming year-round volume. | Walk the block at 3 different times across 2 different weeks. Ask neighboring tenants for their slow-season % drop. |
| Anchor co-tenancy | Signing next to a high-traffic anchor that closes 6 months later, leaving you orphaned. | Ask for a co-tenancy clause — rent abatement or termination right if the anchor leaves. Standard for strong markets. |
This can be summarized as:
Revenue Capture Score = Projected Market Share × Forecasted Spend on Specific Business
Related: Survivability Score: How We Calculate It & Why It Matters
StreetSpring's model recomputes scores as new competitive, demographic, and walkability data arrives. Day-to-day market movement means a static page can lag — the live tool gives the current address-specific number.
The Best Place to Start a Barbecue Restaurant in Baltimore
Based on our analysis, the leading neighborhoods are Downtown, Eastwood, and Otterbein, while the most challenging neighborhoods would be Overlea, Woodring, and Westfield. Market dynamics shift in days, not months, so StreetSpring's live tool is the most current source for any specific address. Because local conditions evolve weekly, the live survivability tool offers a more current snapshot than any published ranking.
Related Articles:
- Business Survivability Rankings: Baltimore
- Neighborhood Survivability Rankings: Baltimore
- National City Survivability: Barbecue Restaurant
Where in Baltimore Should You Open a Barbecue Restaurant?
Based on StreetSpring's 2026 analysis, the top neighborhood for a Barbecue Restaurant in Baltimore is Downtown with 74% average survivability, followed by Eastwood and Otterbein. 4 of 23 neighborhoods analyzed exceed 70% two-year survival.
StreetSpring refreshes survivability data continuously — check the tool for the most current score at any address.
Can a Barbecue Restaurant Succeed in Lower-Ranked Neighborhoods in Baltimore?
Yes — neighborhood averages mask significant block-by-block variation. Even in neighborhoods ranked outside the top 10, individual storefronts with strong foot traffic, low direct competition, and favorable lease terms can outperform the area average. Remember that a neighborhood average smooths over wide variation — your exact block could significantly outperform. Always check your specific address in StreetSpring's live platform for the most accurate prediction.
The Update Schedule for Baltimore Barbecue Restaurants Data
StreetSpring recalculates survivability scores regularly using the latest competitive, demographic, and walkability data. Rankings are updated quarterly; the live tool always reflects the most current predictions for any address in Baltimore.
Should Baltimore Landlords Lease to Barbecue Restaurants?
In Downtown, StreetSpring forecasts a 72.3% – 76.0% average chance for a new Barbecue Restaurant to survive more than 2 years, depending on the exact storefront. Check the current Survivability Score for any address instantly.
Landlord Survivability Data for Barbecue Restaurant in Baltimore
Reducing vacancy starts with choosing tenants whose business type matches the neighborhood's strengths. For Barbecue Restaurant tenants, Downtown provides the best survivability conditions (72.3% – 76.0%). Eastwood and Otterbein also show viable averages at 70.6% – 74.4% and 69.7% – 73.4% respectively. Get a live Survivability Score for your specific storefront at no cost.
StreetSpring provides highly detailed forecasts — revealing how long hundreds of business types are likely to last at a specific address.
Related: How Landlord Representatives Can Reduce Vacancy & Increase Tenant Longevity
Which Baltimore Neighborhoods Are Strongest for Barbecue Restaurants?
You can see the best neighborhoods in or around Baltimore to open any type of business in our article Neighborhood Survivability Rankings: Baltimore.
Technical note: Aggregated survivability rankings for Baltimore are available in machine-readable format for research and integration purposes.
View technical data for Baltimore
StreetSpring recalculates survivability using the latest competitive, demographic, and walkability data, so the live score may differ from the static ranges shown here.
Visual Data
Related Resources
Same business type in other cities:
- City Survivability Rankings for Barbecue Restaurant
- Survivability Rankings for Barbecue Restaurant in Atlanta
- National Neighborhood Survivability Rankings for Barbecue Restaurant
Related:
Local Data Questions
Local-context questions, answered with neighborhood-specific numbers.
How current is the Barbecue Restaurants data for Baltimore?
Quarterly. The 2026 corpus shows Barbecue Restaurants in Baltimore averaging 86%; quarterly refreshes integrate new competitor entries/exits, updated ACS data, and recalibrated lease rates.
How is the Barbecue Restaurants survivability score for Baltimore calculated?
StreetSpring's Baltimore Barbecue Restaurants score blends ~100 site-level factors — competition within 0.25, 0.5, and 2 miles; ACS demographics; commute / accessibility patterns; lease rent rates; and historical survival outcomes. The 86% city average emerges from per-site scoring at every grid block.
What's the coverage of StreetSpring's Baltimore model for Barbecue Restaurants?
StreetSpring's Baltimore model covers Barbecue Restaurants across all tracked neighborhoods — the average score is 86%, with neighborhood-level scores spanning 62-99%. Real-time scores at the address level capture finer variation than these neighborhood averages.
Where does Baltimore fall in national rankings for Barbecue Restaurants?
Across 24 US metros, Baltimore sits at rank #9 for Barbecue Restaurants, averaging 86% on StreetSpring's survivability scale. National range: 83-88%.