Survivability Rankings for Asian Fusion Restaurant in Baltimore
StreetSpring's 2026 analysis ranks the best and worst neighborhoods in Baltimore to open an Asian Fusion Restaurant, from Canton (85% survival) to Old T...
By Bobby Koons | Last reviewed: April 28, 2026 | Updated weekly | Methodology
Quick Summary
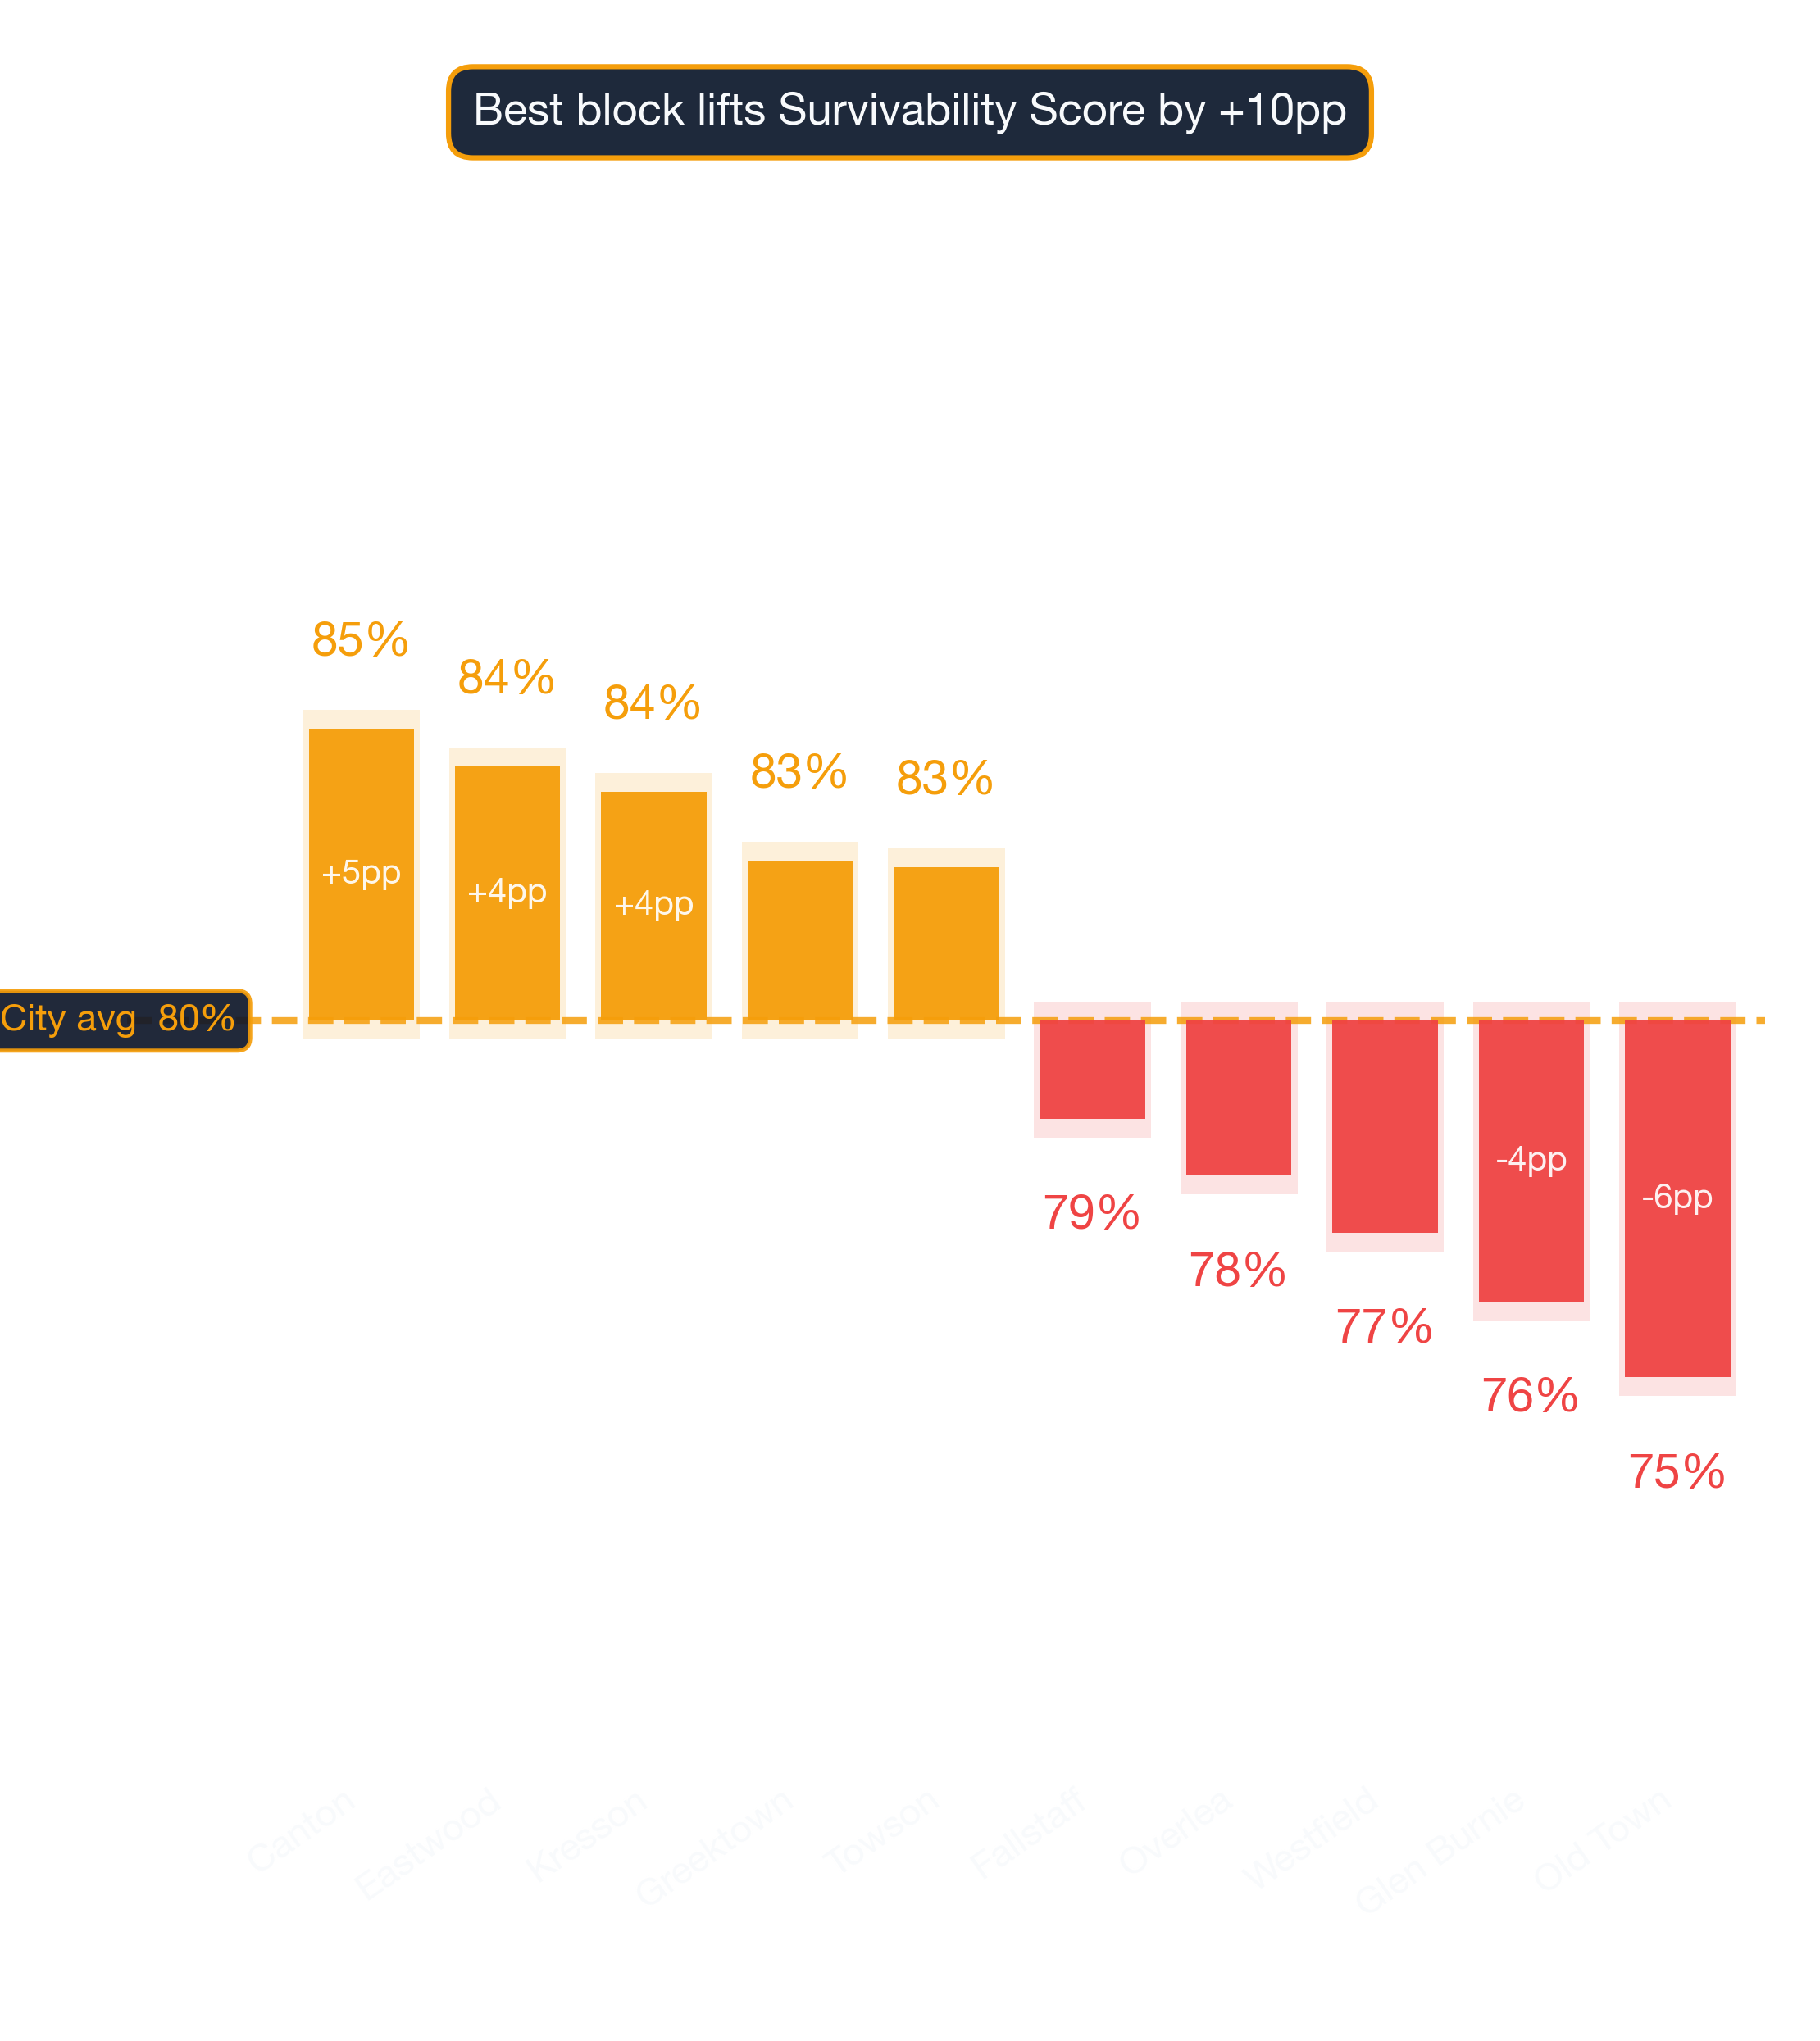
- #1 Neighborhood: Canton — 85% average survivability for Asian Fusion Restaurant
- Neighborhoods at or above 70%: 23 of 23 analyzed
- City-wide average: 80% for Asian Fusion Restaurants
- Most challenging area: Old Town at 74%
- Revenue advantage (top vs. avg location): ~5.8% more expected revenue in Canton
- Data freshness: 2026 data · Full methodology →
Table of Contents
- Summary
- 10 Best Neighborhoods
- Where Would an Asian Fusion Restaurant Make the Most Money?
- What Should I Consider?
- Where Should I Start?
- FAQ: Best Neighborhoods
- FAQ: Can an Asian Fusion Restaurant Succeed in Lower-Ranked Areas?
- FAQ: How Often Are Rankings Updated?
- FAQ: Is an Asian Fusion Restaurant a Good Tenant?
- Landlord Survivability Data
- Best Neighborhoods for Any Business
Summary
Canton leads Baltimore's 2026 survivability rankings for Asian Fusion Restaurant operators with 85% average chance of surviving more than 2 years, with the best locations offering 88% and the most challenging locations in Canton at 82%. The worst neighborhoods include Old Town with 74% average chance. For the most current predictions, visit StreetSpring to analyze your specific location in real-time.
Where in Baltimore Should You Open an Asian Fusion Restaurant?
Canton ranks #1 of 23 neighborhoods analyzed in and around Baltimore for Asian Fusion Restaurant survivability with a score of 85% as of 2026. The top 10 neighborhoods are:
Reading the gap between #1 and #10
| Rank | Neighborhood | Best Locations | Average Locations | Challenging Locations |
|---|---|---|---|---|
| 1 | Canton | 85.0% – 89.0% | 83.1% – 87.0% | 81.0% – 85.0% |
| 2 | Eastwood | 94.0% – 97.0% | 82.4% – 86.3% | 74.0% – 78.0% |
| 3 | Kresson | 87.0% – 91.0% | 82.1% – 85.9% | 75.0% – 79.0% |
| 4 | Greektown | 90.0% – 94.0% | 80.9% – 84.8% | 74.0% – 78.0% |
| 5 | Towson | 94.0% – 97.0% | 80.9% – 84.7% | 70.0% – 74.0% |
| 6 | Beechfield | 92.0% – 96.0% | 79.5% – 83.4% | 73.0% – 77.0% |
| 7 | Oaklee | 92.0% – 96.0% | 79.4% – 83.3% | 74.0% – 78.0% |
| 8 | Idlewood | 86.0% – 90.0% | 79.3% – 83.2% | 74.0% – 78.0% |
| 9 | Cedonia | 94.0% – 97.0% | 79.3% – 83.1% | 72.0% – 76.0% |
| 10 | Medford | 81.0% – 85.0% | 79.2% – 83.0% | 75.0% – 79.0% |
Notable runners-up worth a second look
Storefront-level conditions shift constantly; pulling StreetSpring's live data gives a more current read than any snapshot. However, market conditions change daily, and it's best to use StreetSpring's live data to check the Survivability Score for a specific address.
Survivability ranges reflect best and worst storefront conditions within each neighborhood. See our full methodology →
Try StreetSpring to see if this location is still the best and see if there are locations to rent in this area right now.
Which Baltimore Neighborhoods Drive the Highest Asian Fusion Restaurant Revenue?
In Canton, the best possible location offers the opportunity of making ~5.8% more than the average location in or around Baltimore.
On the other hand, in Old Town, the worst possible location could result in making ~7.1% less than the average location in the city.
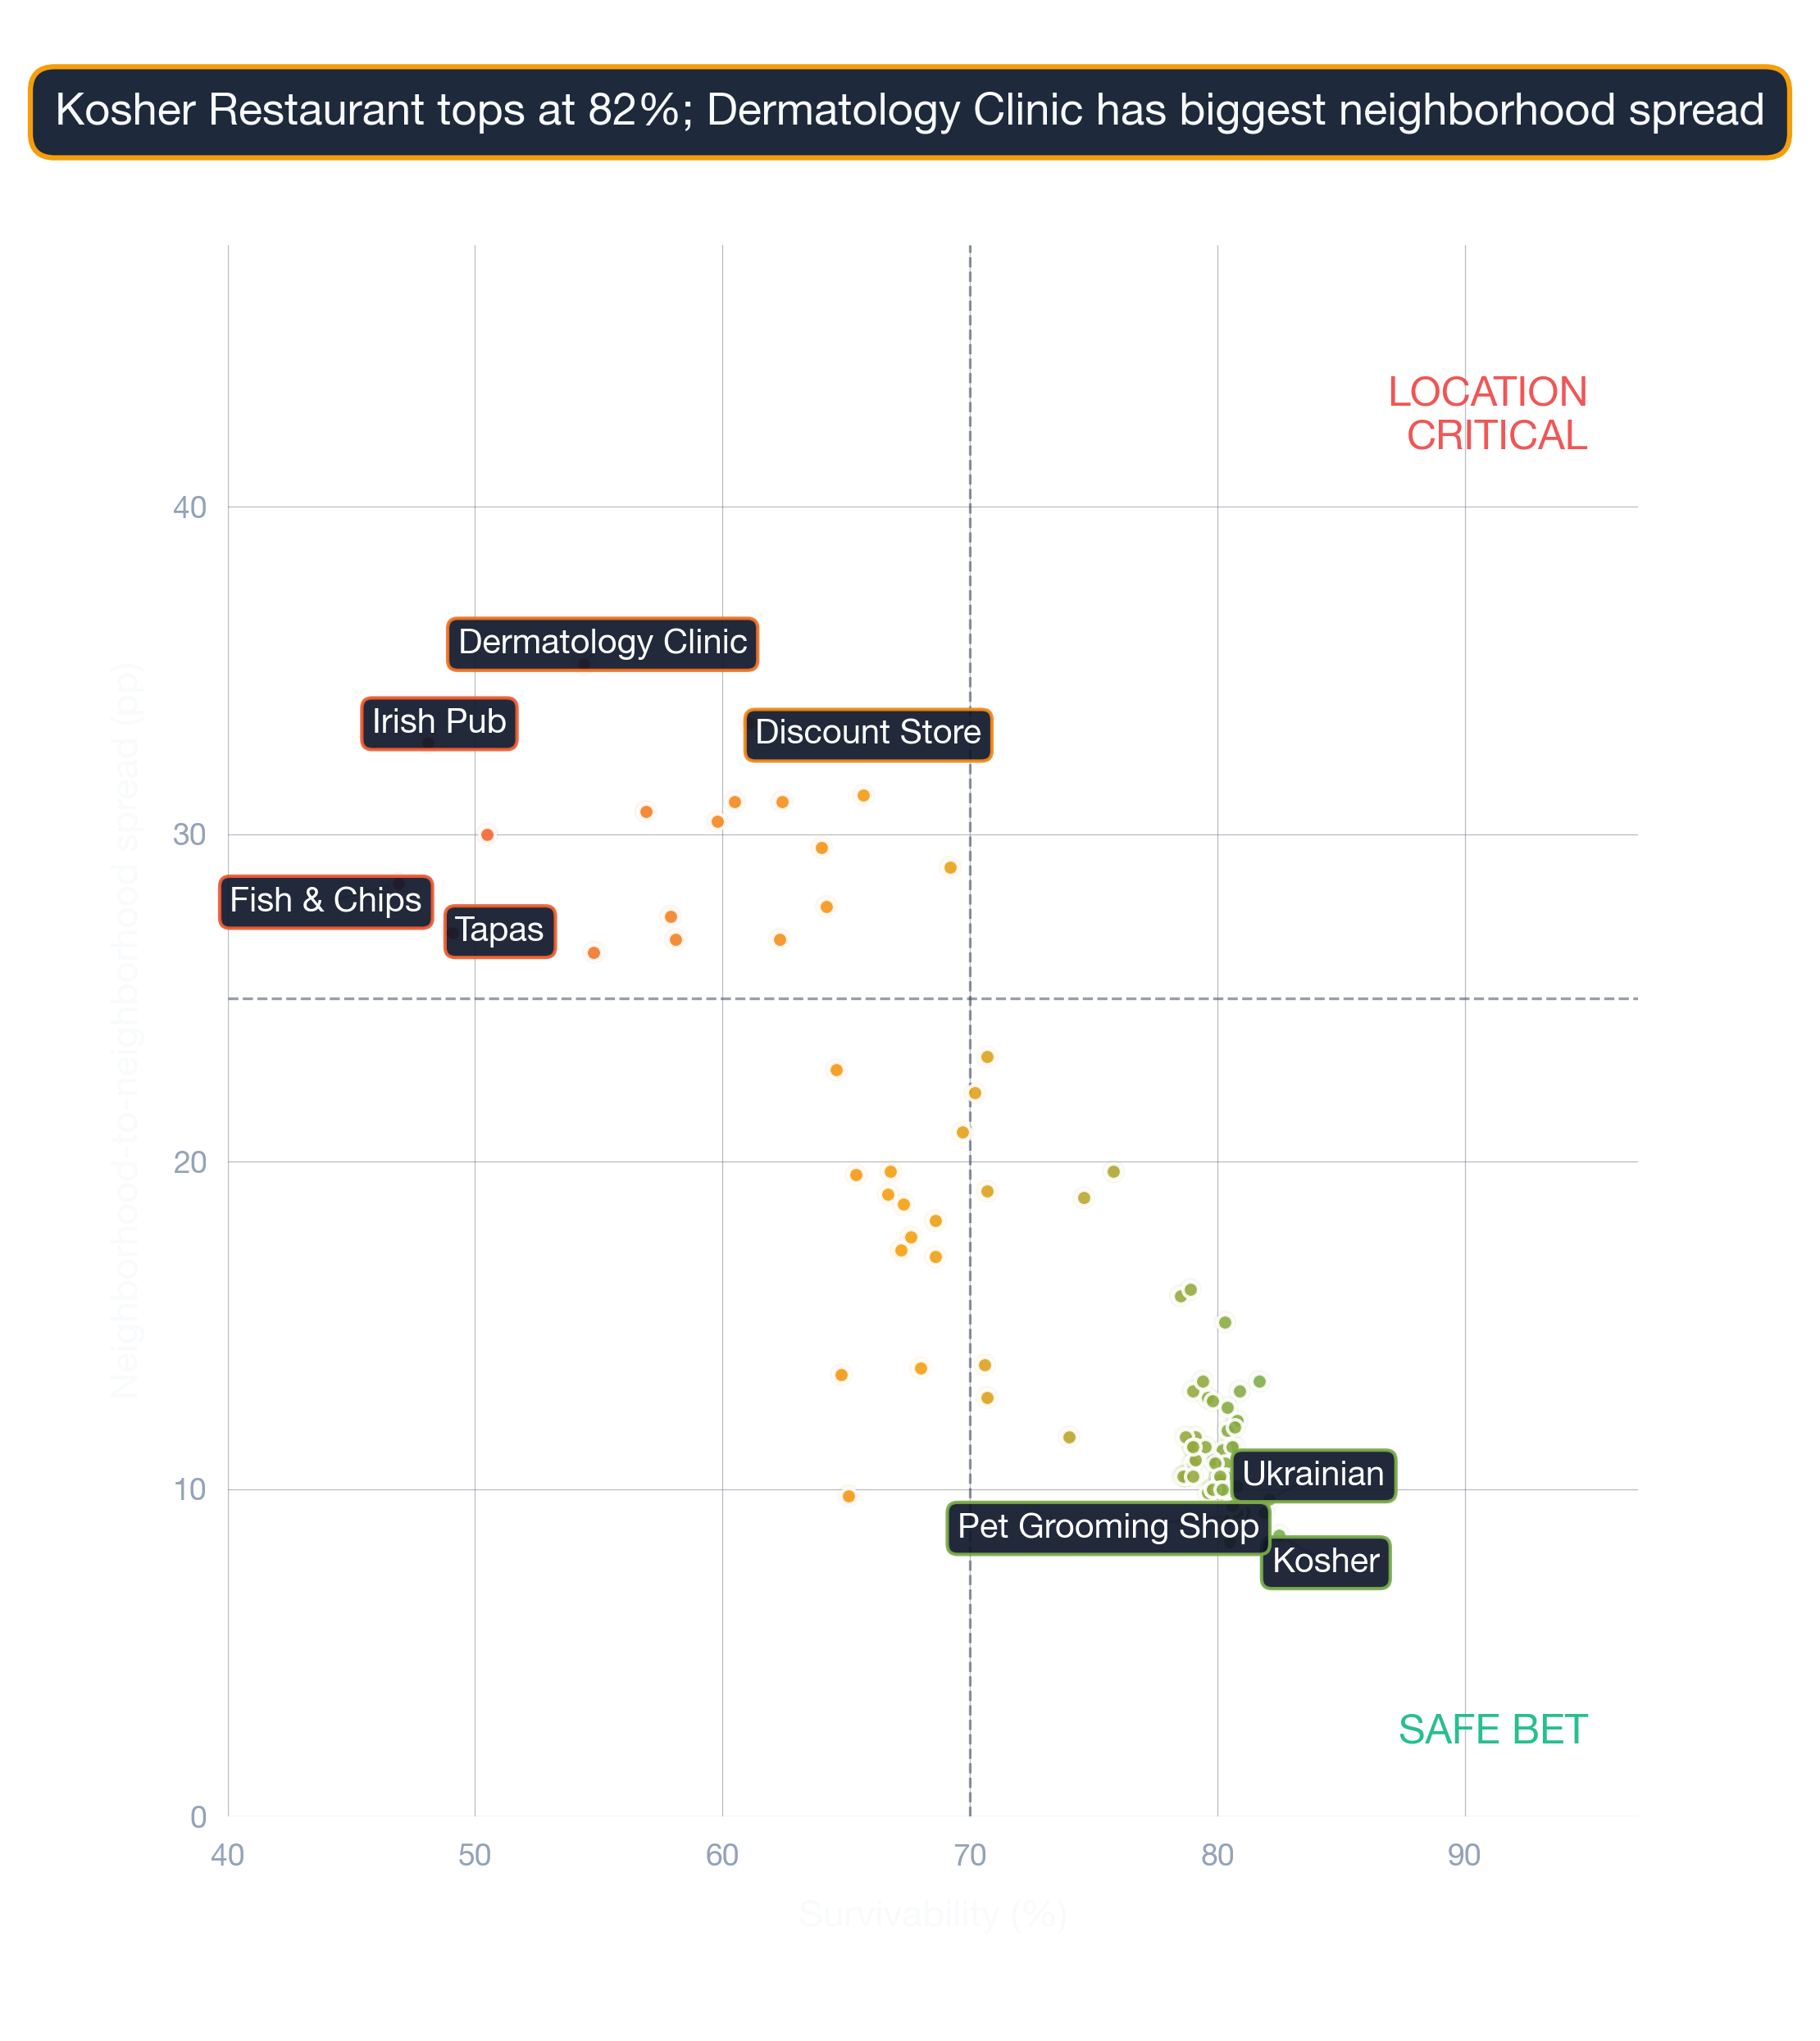
A great concept in the wrong location will almost always underperform a good concept in the right one. Opening an Asian Fusion Restaurant in Baltimore requires careful location choice. Across 23 neighborhoods analyzed, the overall average survival chance for a new Asian Fusion Restaurant is 80% for lasting more than 2 years — due to a combination of many factors across competition, consumer spending, and location dynamics. The interplay between location characteristics and business type produces unique survivability scores for every combination.
The Most Important Factors for an Asian Fusion Restaurant in Baltimore
The strongest predictor of whether this business survives two years is the quality of the location you pick — Survivability Score quantifies exactly that. Revenue Capture Score is the single best indicator of whether a business will thrive at a location. StreetSpring computes this by projecting the business's market share, which is based on the quality and quantity of primary, secondary, and tertiary competitors. Our platform incorporates data from thousands of neighborhoods nationwide. Our data shows that businesses in moderately competitive clusters survive longer than isolated storefronts on average. Our proprietary models incorporate data sources not available through any public platform.
| Consideration | Common pitfall | What to verify before signing |
|---|---|---|
| Outdoor seating / sidewalk use | Signing assuming you can add patio seating, then learning the city requires a separate sidewalk-cafe permit with long lead times. | Check the city's sidewalk-cafe permit process up front. Confirm landlord allows outdoor build-out in the lease language. |
| Competitor density | Counting only direct competitors and missing adjacent-category overlap (e.g. coffee shop near a bakery). | Map all businesses serving overlapping customer needs within a 5-min walk. Use StreetSpring's competitor view as a starting point. |
| Permits & licensing | Assuming a 30-day permit timeline, hitting 90+ days, paying rent on a non-operating storefront. | Call the local zoning office before signing. Confirm your use is already permitted; if not, factor a 2-3 month variance timeline. |
This can be summarized as:
Revenue Capture Score = Projected Market Share × Forecasted Spend on Specific Business
Related: Survivability Score: How We Calculate It & Why It Matters
StreetSpring recalculates survivability using the latest competitive, demographic, and walkability data. Because local conditions evolve weekly, the live survivability tool offers a more current snapshot than any published ranking.
Which Baltimore Block Is Right for an Asian Fusion Restaurant?
Our models highlight the following neighborhoods as top performers: Canton, Eastwood, and Kresson, while the most challenging neighborhoods would be Old Town, Glen Burnie, and Westfield. These rankings are based on the latest available data; check StreetSpring for real-time updates. Neighborhood rankings are useful, but the exact odds for your location can only be seen by running a current survivability check in StreetSpring.
Related Articles:
- Business Survivability Rankings: Baltimore
- Neighborhood Survivability Rankings: Baltimore
- National City Survivability: Asian Fusion Restaurant
- National Neighborhood Survivability: Asian Fusion Restaurant
Which Baltimore Neighborhoods Are Strongest for Asian Fusion Restaurants?
Based on StreetSpring's 2026 analysis, the top neighborhood for an Asian Fusion Restaurant in Baltimore is Canton with 85% average survivability, followed by Eastwood and Kresson. 23 of 23 neighborhoods analyzed exceed 70% two-year survival.
Because local conditions evolve weekly, the live survivability tool offers a more current snapshot than any published ranking.
Are Bottom-Tier Baltimore Neighborhoods a No-Go for Asian Fusion Restaurants?
Yes — neighborhood averages mask significant block-by-block variation. Even in neighborhoods ranked outside the top 10, individual storefronts with strong foot traffic, low direct competition, and favorable lease terms can outperform the area average. Location-level factors like visibility and adjacent tenants can override neighborhood-level trends. Always check your specific address in StreetSpring's live platform for the most accurate prediction.
The Update Schedule for Baltimore Asian Fusion Restaurants Data
StreetSpring recalculates survivability scores regularly using the latest competitive, demographic, and walkability data. Rankings are updated quarterly; the live tool always reflects the most current predictions for any address in Baltimore.
What Makes an Asian Fusion Restaurant a Strong (or Weak) Baltimore Tenant?
In Canton, StreetSpring forecasts a 83.1% – 87.0% average chance for a new Asian Fusion Restaurant to survive more than 2 years, depending on the exact storefront. Check the current Survivability Score for any address instantly.
Landlord Survivability Data for Asian Fusion Restaurant in Baltimore
Should you rent your storefront to an Asian Fusion Restaurant? The answer depends heavily on your neighborhood. Canton offers the strongest outlook at 83.1% – 87.0% average survivability, followed by Eastwood at 82.4% – 86.3%, and Kresson at 82.1% – 85.9%. See which business types are most likely to succeed at your property address right now.
Each prediction is calibrated to the specific address, factoring in foot traffic, competition, and consumer spending at that exact location.
Related: How Landlord Representatives Can Reduce Vacancy & Increase Tenant Longevity
Top-Survivability Baltimore Neighborhoods for Asian Fusion Restaurants
You can see the best neighborhoods in or around Baltimore to open any type of business in our article Neighborhood Survivability Rankings: Baltimore.
Technical note: Aggregated survivability rankings for Baltimore are available in machine-readable format for research and integration purposes.
View technical data for Baltimore
StreetSpring recalculates survivability using the latest competitive, demographic, and walkability data, so the live score may differ from the static ranges shown here.
Visual Data
Related Resources
Same business type in other cities:
- City Survivability Rankings for Asian Fusion Restaurant
- Survivability Rankings for Asian Fusion Restaurant in Atlanta
- National Neighborhood Survivability Rankings for Asian Fusion Restaurant
Related:
Beyond the Numbers: Local Context
More questions answered with neighborhood-specific data from our 2026 corpus.
Which Baltimore subtypes have comparable survivability to Asian Fusion Restaurants?
Per StreetSpring's Baltimore corpus, peers of Asian Fusion Restaurants (within 2 points of the 87% average) include Pizza Restaurant, Steakhouse, Tapas Restaurant.
How often is the Baltimore Asian Fusion Restaurants survivability data refreshed?
Quarterly. The 2026 corpus shows Asian Fusion Restaurants in Baltimore averaging 87%; quarterly refreshes integrate new competitor entries/exits, updated ACS data, and recalibrated lease rates.
What's the gap between the best and worst Baltimore locations for an Asian Fusion Restaurant?
Across Baltimore, StreetSpring's survivability score for Asian Fusion Restaurants ranges from 60% at the most challenging locations to 98% at the best — a 38-percentage-point gap that location selection alone can capture.
Where in the US do Asian Fusion Restaurants survive best?
Across 24 US metros, Portland, San Antonio, St. Louis top the rankings for Asian Fusion Restaurants. Baltimore comes in at #7 with an average score of 87%.