Survivability Rankings for South African Restaurant in Boston
StreetSpring's 2026 analysis ranks the best and worst neighborhoods in Boston to open a South African Restaurant, from Boston (88% survival) to Winchest...
By Bobby Koons | Last reviewed: April 25, 2026 | Updated weekly | Methodology
Quick Summary
- #1 Neighborhood: Boston — 88% average survivability for South African Restaurant
- Neighborhoods at or above 70%: 88 of 88 analyzed
- City-wide average: 81% for South African Restaurants
- Most challenging area: Winchester at 75%
- Revenue advantage (top vs. avg location): ~8.6% more expected revenue in Boston
- Data freshness: 2026 data · Full methodology →
Table of Contents
- Summary
- 10 Best Neighborhoods
- Where Would a South African Restaurant Make the Most Money?
- What Should I Consider?
- Where Should I Start?
- FAQ: Best Neighborhoods
- FAQ: Can a South African Restaurant Succeed in Lower-Ranked Areas?
- FAQ: How Often Are Rankings Updated?
- FAQ: Is a South African Restaurant a Good Tenant?
- Landlord Survivability Data
- Best Neighborhoods for Any Business
Summary
Boston leads Boston's 2026 survivability rankings for South African Restaurant operators with 88% average chance of surviving more than 2 years, with the best locations offering 93% and the most challenging locations in Boston at 73%. The worst neighborhoods include Winchester with 75% average chance. StreetSpring's Survivability Scores are updated regularly, so the most accurate prediction for your exact storefront is always available in the live tool.
Where in Boston Should You Open a South African Restaurant?
Boston ranks #1 of 88 neighborhoods analyzed in and around Boston for South African Restaurant survivability with a score of 88% as of 2026. The top 10 neighborhoods are:
How rent and competition shape the leaderboard
| Rank | Neighborhood | Best Locations | Average Locations | Challenging Locations |
|---|---|---|---|---|
| 1 | Boston | 90.0% – 94.0% | 86.2% – 88.8% | 72.0% – 76.0% |
| 2 | Haverhill | 94.0% – 97.0% | 85.7% – 88.4% | 64.0% – 68.0% |
| 3 | Medfield | 95.0% – 97.0% | 84.7% – 87.4% | 61.0% – 65.0% |
| 4 | Dover | 94.0% – 97.0% | 84.4% – 87.1% | 64.0% – 68.0% |
| 5 | Methuen | 94.0% – 97.0% | 84.1% – 86.8% | 66.0% – 70.0% |
| 6 | Merrymount | 91.0% – 95.0% | 83.5% – 86.2% | 70.0% – 74.0% |
| 7 | Needham | 95.0% – 97.0% | 83.3% – 85.9% | 65.0% – 69.0% |
| 8 | Lowell | 94.0% – 97.0% | 83.0% – 85.7% | 65.0% – 69.0% |
| 9 | Adams Shore | 92.0% – 96.0% | 82.8% – 85.4% | 69.0% – 73.0% |
| 10 | Davis Square | 82.0% – 86.0% | 81.7% – 84.4% | 76.0% – 80.0% |
Where the rankings might surprise you
Neighborhood averages mask significant block-by-block variation — always check your specific address. Neighborhood rankings are useful, but the exact odds for your location can only be seen by running a current survivability check in StreetSpring.
Survivability ranges reflect best and worst storefront conditions within each neighborhood. See our full methodology →
Try StreetSpring to see if this location is still the best and see if there are locations to rent in this area right now.
The Top Revenue Neighborhoods for South African Restaurants in Boston
In Boston, the best possible location offers the opportunity of making ~8.6% more than the average location in or around Boston.
On the other hand, in Winchester, the worst possible location could result in making ~7.0% less than the average location in the city.
A great concept in the wrong location will almost always underperform a good concept in the right one. Opening a South African Restaurant in Boston requires careful location choice. Across 88 neighborhoods analyzed, the overall average survival chance for a new South African Restaurant is 81% for lasting more than 2 years — due to a combination of many factors across competition, consumer spending, and location dynamics. A high-traffic corner that works well for a coffee shop may be entirely wrong for a specialty retailer.
What Matters Most When Opening a South African Restaurant in Boston
The strongest predictor of whether this business survives two years is the quality of the location you pick — Survivability Score quantifies exactly that. No other single metric predicts business longevity as reliably as Revenue Capture Score. StreetSpring computes this by projecting the business's market share, which is based on the quality and quantity of primary, secondary, and tertiary competitors. Our models draw from one of the most comprehensive commercial real estate datasets ever assembled. Some of the best-performing locations are surrounded by complementary competitors that drive foot traffic. StreetSpring leverages exclusive data sources and custom models for these projections.
| Consideration | Common pitfall | What to verify before signing |
|---|---|---|
| Lease term | Locking into 7-10 years without break clauses, then needing to relocate after year 2. | Negotiate a relocation or termination clause. Confirm assignment + sublease rights are in writing. |
| Foot traffic seasonality | Looking at a peak-summer Tuesday and assuming year-round volume. | Walk the block at 3 different times across 2 different weeks. Ask neighboring tenants for their slow-season % drop. |
| Permits & licensing | Assuming a 30-day permit timeline, hitting 90+ days, paying rent on a non-operating storefront. | Call the local zoning office before signing. Confirm your use is already permitted; if not, factor a 2-3 month variance timeline. |
This can be summarized as:
Revenue Capture Score = Projected Market Share × Forecasted Spend on Specific Business
Related: Survivability Score: How We Calculate It & Why It Matters
StreetSpring refreshes its survivability model weekly with the latest competitive, demographic, and walkability inputs. Conditions still shift day to day, so the live tool is the most reliable source for an address-specific score.
Where to Launch a South African Restaurant in or Around Boston
The highest-performing areas for this business type are Boston, Haverhill, and Medfield, while the most challenging neighborhoods would be Winchester, West Roxbury, and Arlington. However, individual locations vary widely, and even in lower-scoring neighborhoods there are pockets that perform exceptionally well. Static rankings provide a useful baseline, but the live tool captures changes that have occurred since publication.
Related Articles:
Which Boston Neighborhoods Are Strongest for South African Restaurants?
Based on StreetSpring's 2026 analysis, the top neighborhood for a South African Restaurant in Boston is Boston with 88% average survivability, followed by Haverhill and Medfield. 88 of 88 neighborhoods analyzed exceed 70% two-year survival.
StreetSpring's Survivability Scores are updated regularly, so the most accurate prediction for your exact storefront is always available in the live tool.
Can a South African Restaurant Succeed in Lower-Ranked Neighborhoods in Boston?
Yes — neighborhood averages mask significant block-by-block variation. Even in neighborhoods ranked outside the top 10, individual storefronts with strong foot traffic, low direct competition, and favorable lease terms can outperform the area average. A low-ranking neighborhood can still contain high-potential storefronts — the address matters most. Always check your specific address in StreetSpring's live platform for the most accurate prediction.
How Often Are South African Restaurant Rankings in Boston Updated?
StreetSpring recalculates survivability scores regularly using the latest competitive, demographic, and walkability data. Rankings are updated quarterly; the live tool always reflects the most current predictions for any address in Boston.
Is a South African Restaurant a Good Tenant for Boston Landlords?
In Boston, StreetSpring forecasts a 86.2% – 88.8% average chance for a new South African Restaurant to survive more than 2 years, depending on the exact storefront. Check the current Survivability Score for any address instantly.
Landlord Survivability Data for South African Restaurant in Boston
For landlords evaluating tenant applications, StreetSpring's data provides a clear comparison across the top neighborhoods. In Boston, a South African Restaurant has a 86.2% – 88.8% average chance of surviving more than 2 years. In Haverhill, the range shifts to 85.7% – 88.4%, and in Medfield, it is 84.7% – 87.4%. Get a live Survivability Score for your specific storefront at no cost.
Our tool delivers pinpoint accuracy down to the exact storefront location for any business category.
Related: How Landlord Representatives Can Reduce Vacancy & Increase Tenant Longevity
Top-Survivability Boston Neighborhoods for South African Restaurants
You can see the best neighborhoods in or around Boston to open any type of business in our article Neighborhood Survivability Rankings: Boston.
Technical note: Aggregated survivability rankings for Boston are available in machine-readable format for research and integration purposes.
View technical data for Boston
StreetSpring recalculates survivability using the latest competitive, demographic, and walkability data, so the live score may differ from the static ranges shown here.
Visual Data
Related Resources
Related:
Related:
- Survivability Rankings for Acupuncture Clinic in Atlanta
- Survivability Rankings for Afghan Restaurant in Atlanta
- Survivability Rankings for African Restaurant in Atlanta
Local Data Questions
More questions answered with neighborhood-specific data from our 2026 corpus.
What's the broader economic environment in Boston?
Broader metro: ~96% employment rate, ~$135K median income per ACS. South African Restaurants survivability in Boston averages 83%, with the model layering business-specific and site-specific factors on top.
Where should an aspiring Boston South African Restaurant owner focus first?
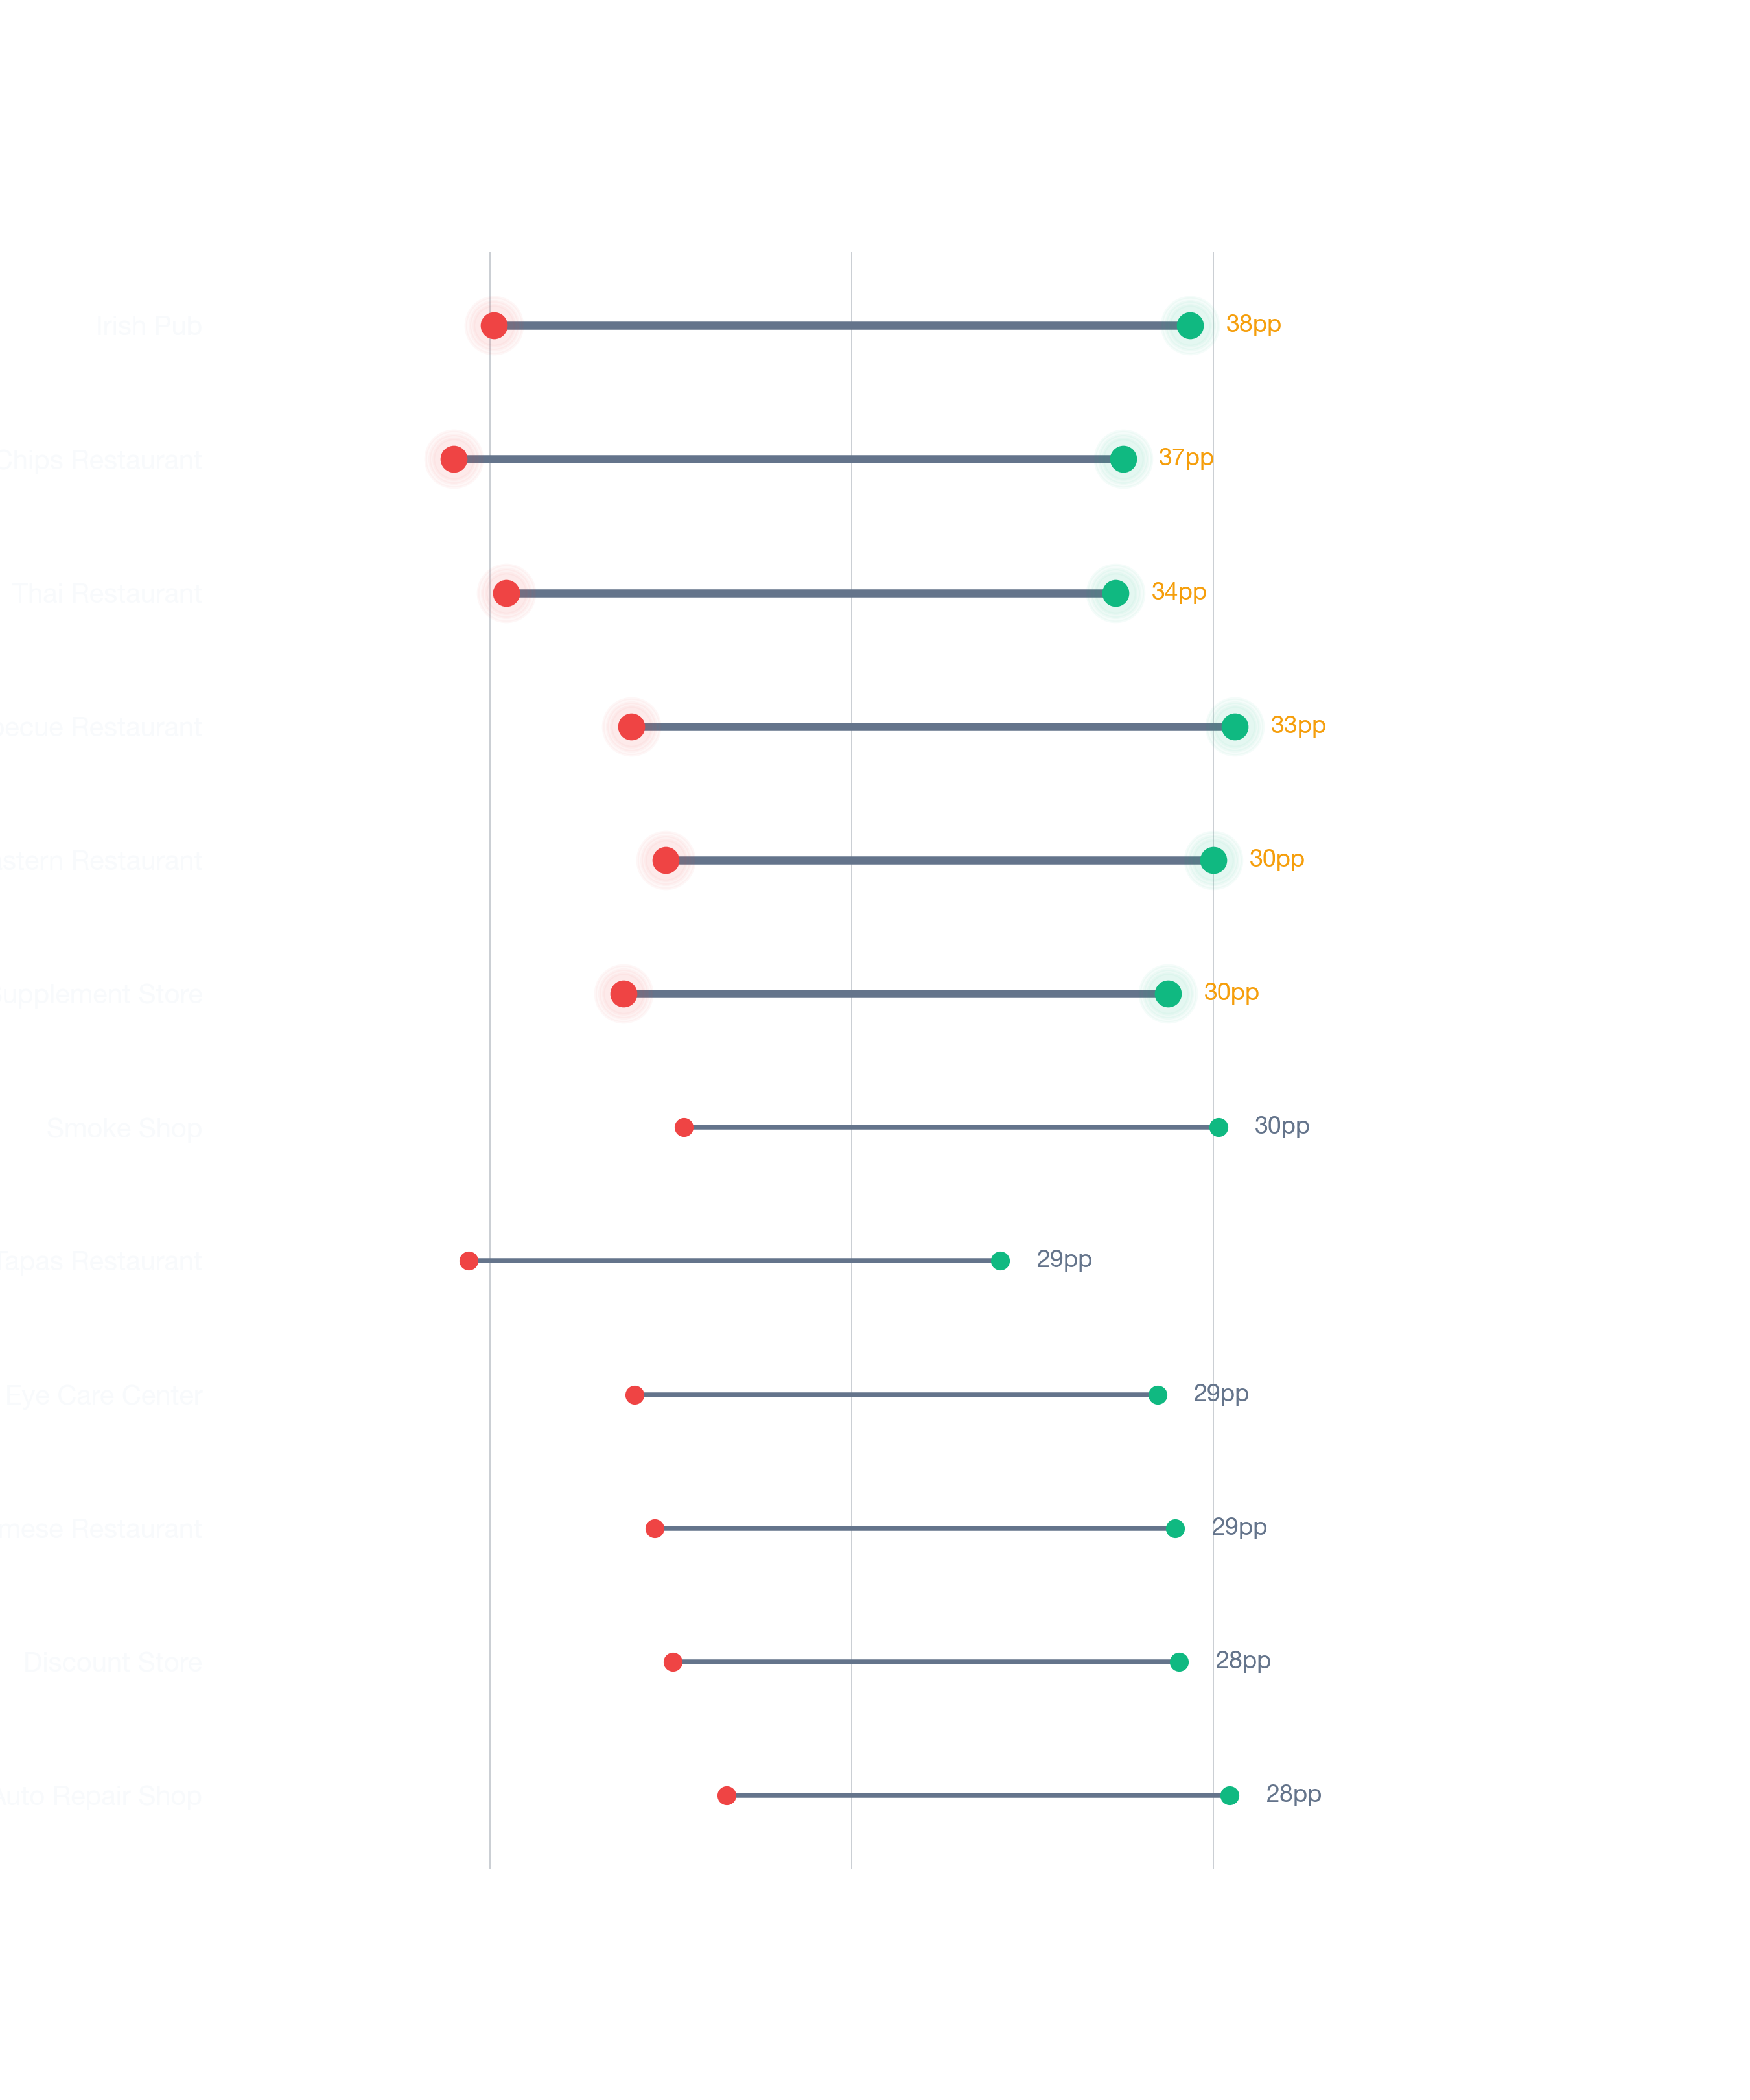
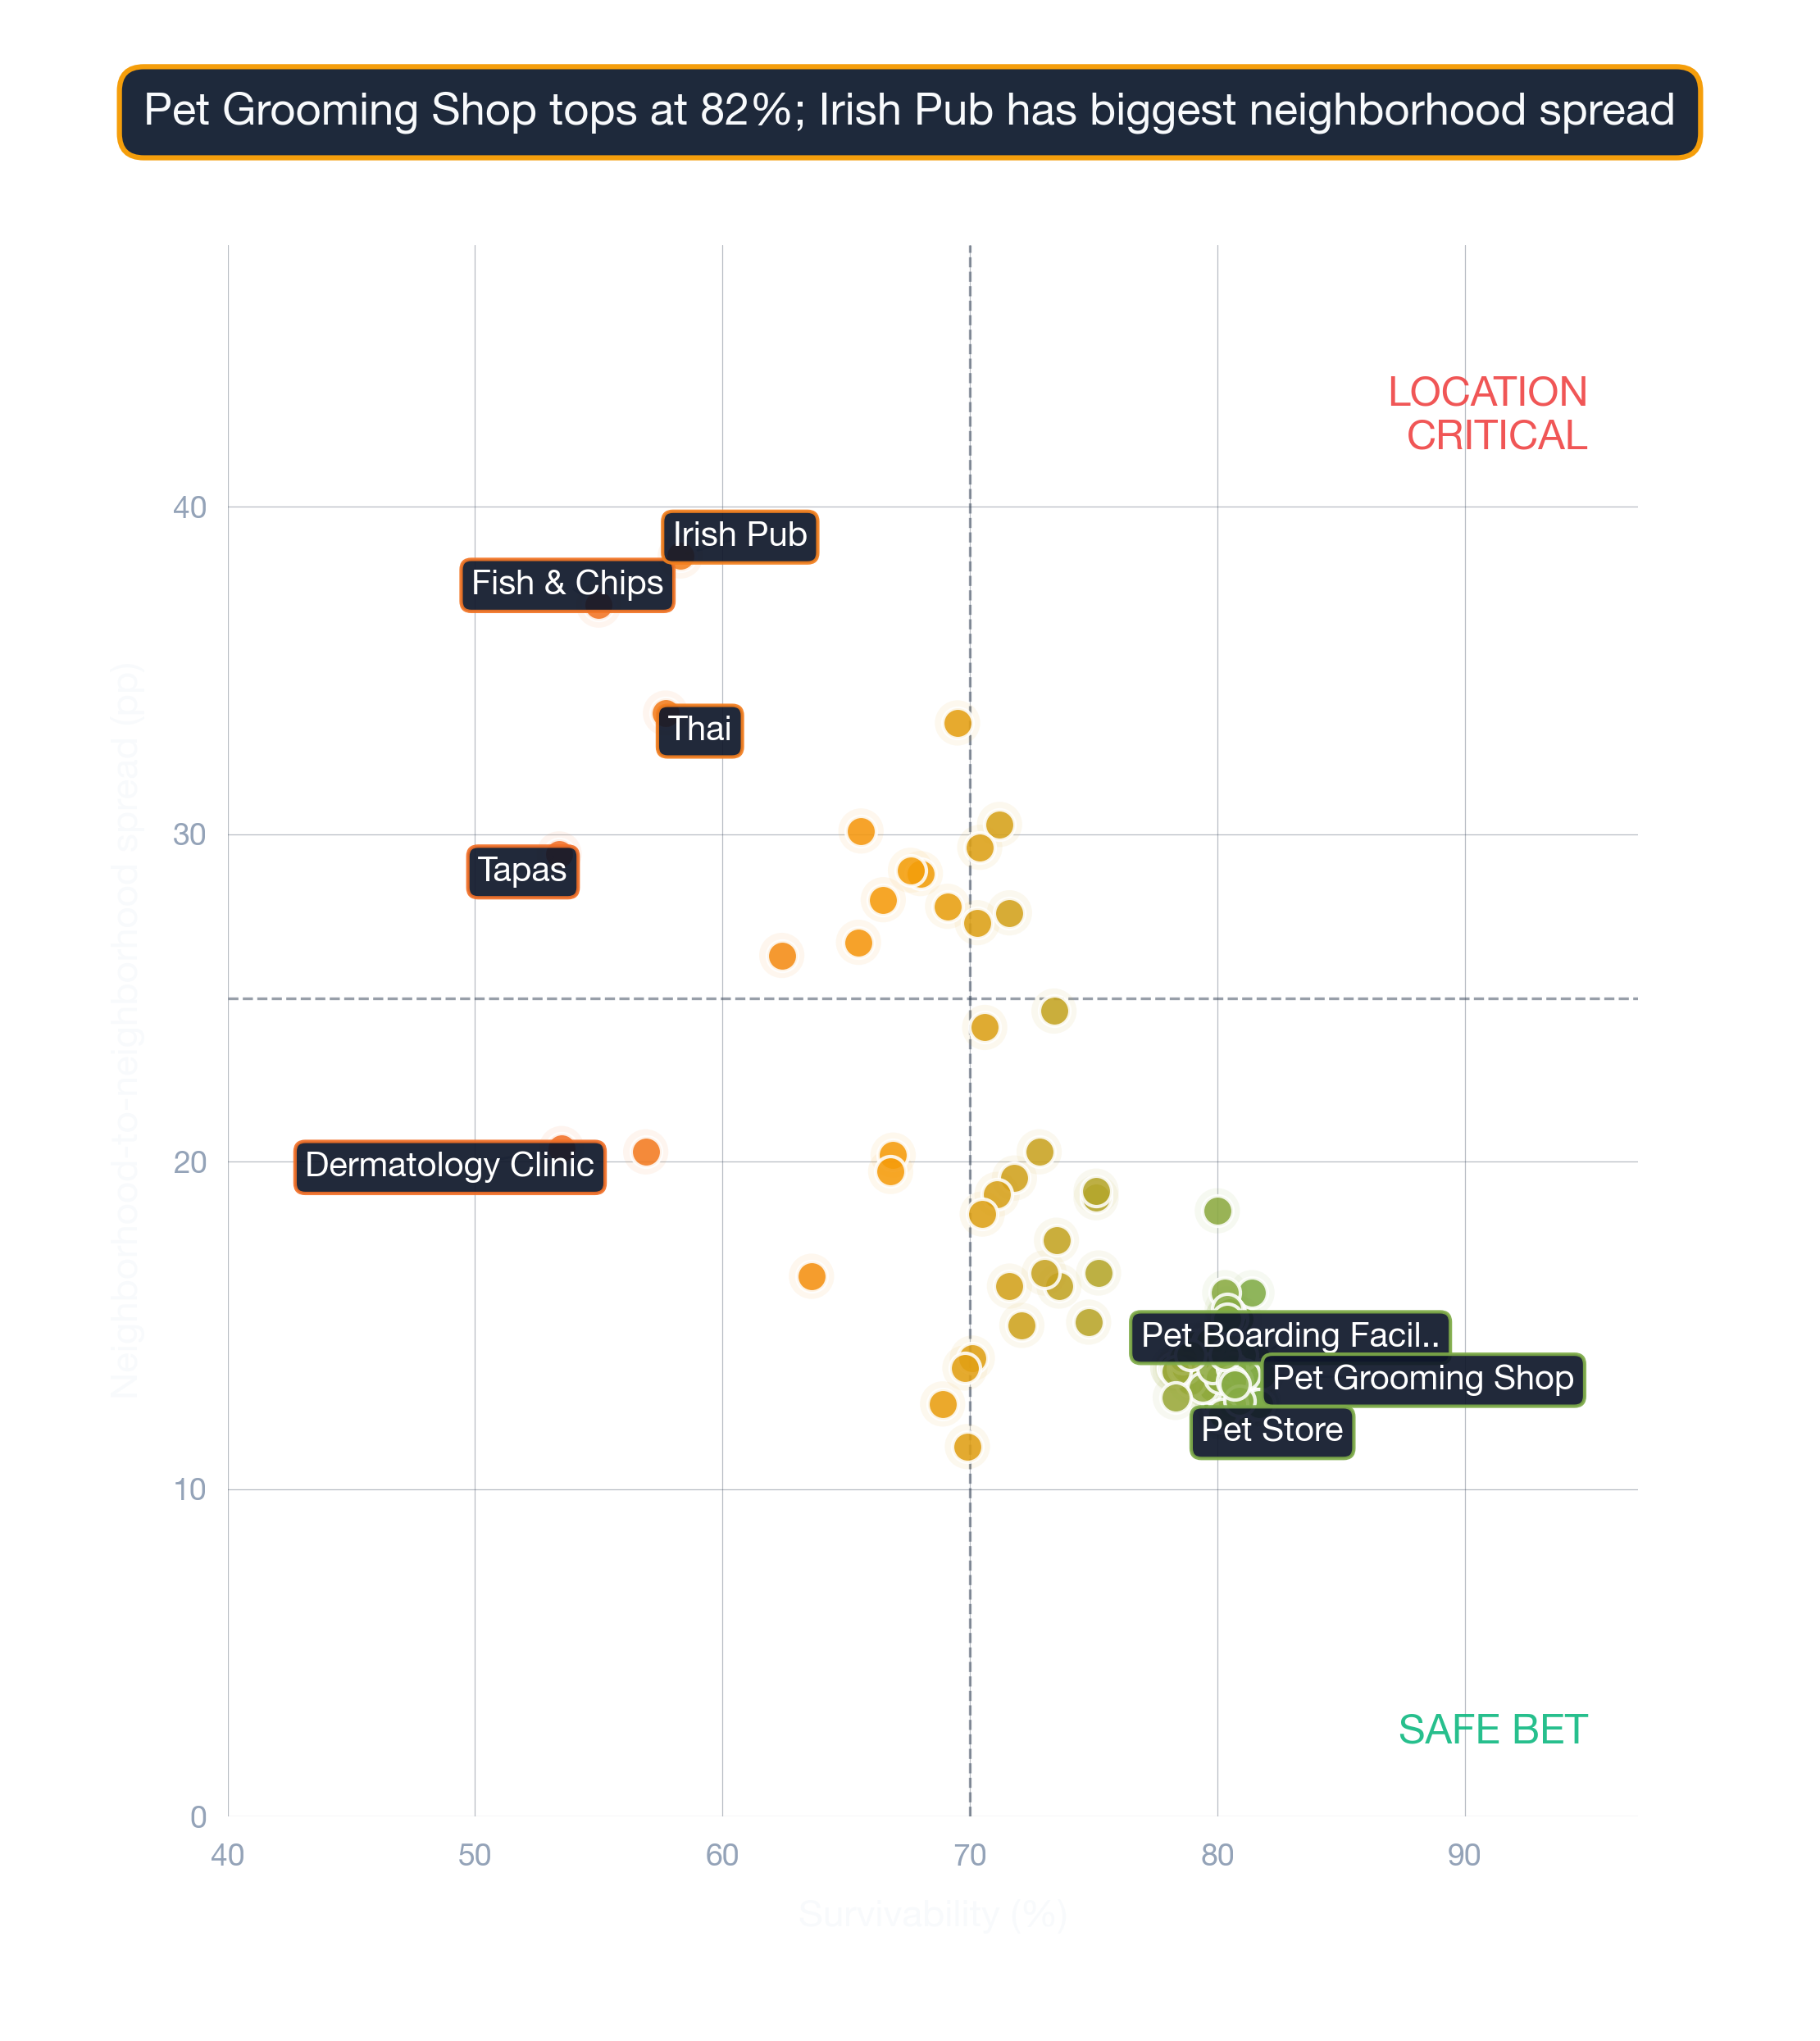
Location selection. StreetSpring's data shows a 38-point survivability gap between best- and worst-case Boston locations for South African Restaurants (60-98%). That's a larger gap than most operators can close through marketing or operations improvements.
What are the top metros nationally for opening a South African Restaurant?
Across 24 US metros, San Antonio, Portland, St. Louis top the rankings for South African Restaurants. Boston comes in at #22 with an average score of 83%.
What goes into a StreetSpring survivability score for South African Restaurants?
The Boston survivability score for South African Restaurants (83% average) combines ~100 location factors: competitive density, demographic fit, accessibility, visibility, lease economics, and historical business outcomes. The score is calibrated against 500K+ historical business outcomes and refreshed quarterly.
How important is foot traffic / accessibility for a South African Restaurant in Boston?
Median Boston commute is ~32 minutes. Accessibility-driven foot-traffic variation contributes to the 60-98% survivability range South African Restaurants see across the metro.