Survivability Rankings for Smoke Shop in Boston
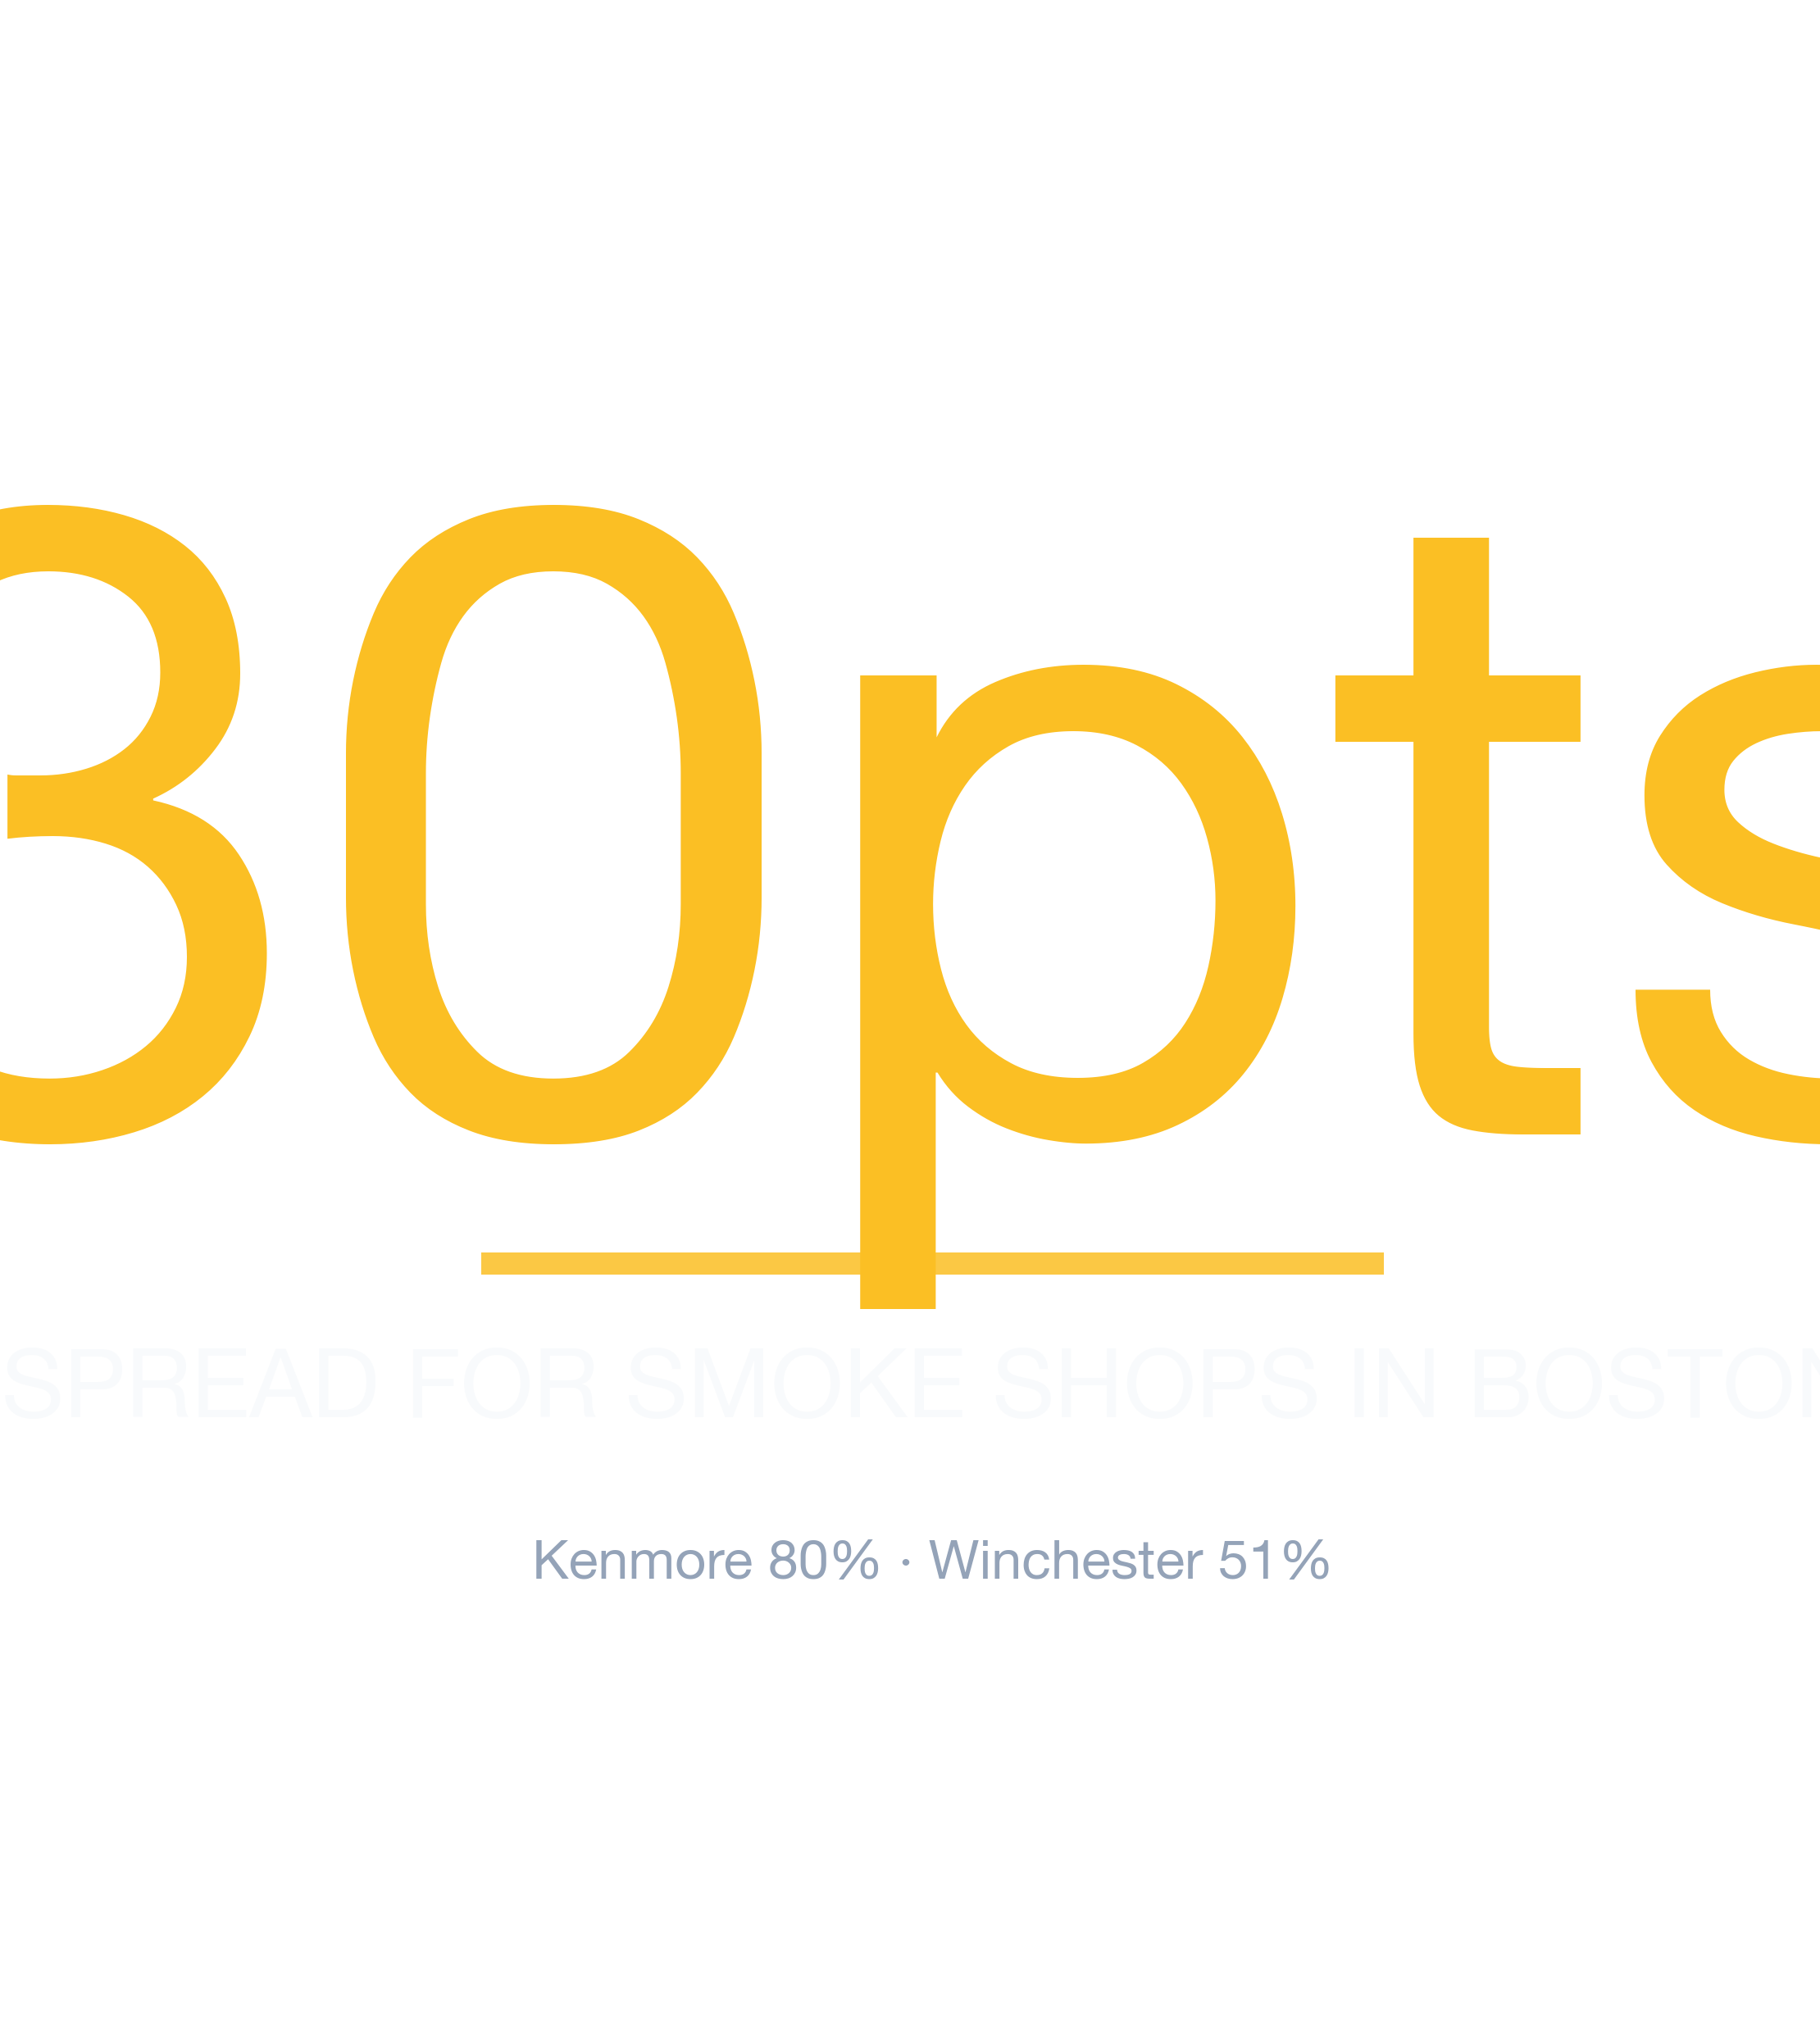
StreetSpring's 2026 analysis ranks the best and worst neighborhoods in Boston to open a Smoke Shop, from Kenmore (80% survival) to Winchester (51%).
By Bobby Koons | Last reviewed: May 14, 2026 | New data weekly | Methodology
Quick Summary
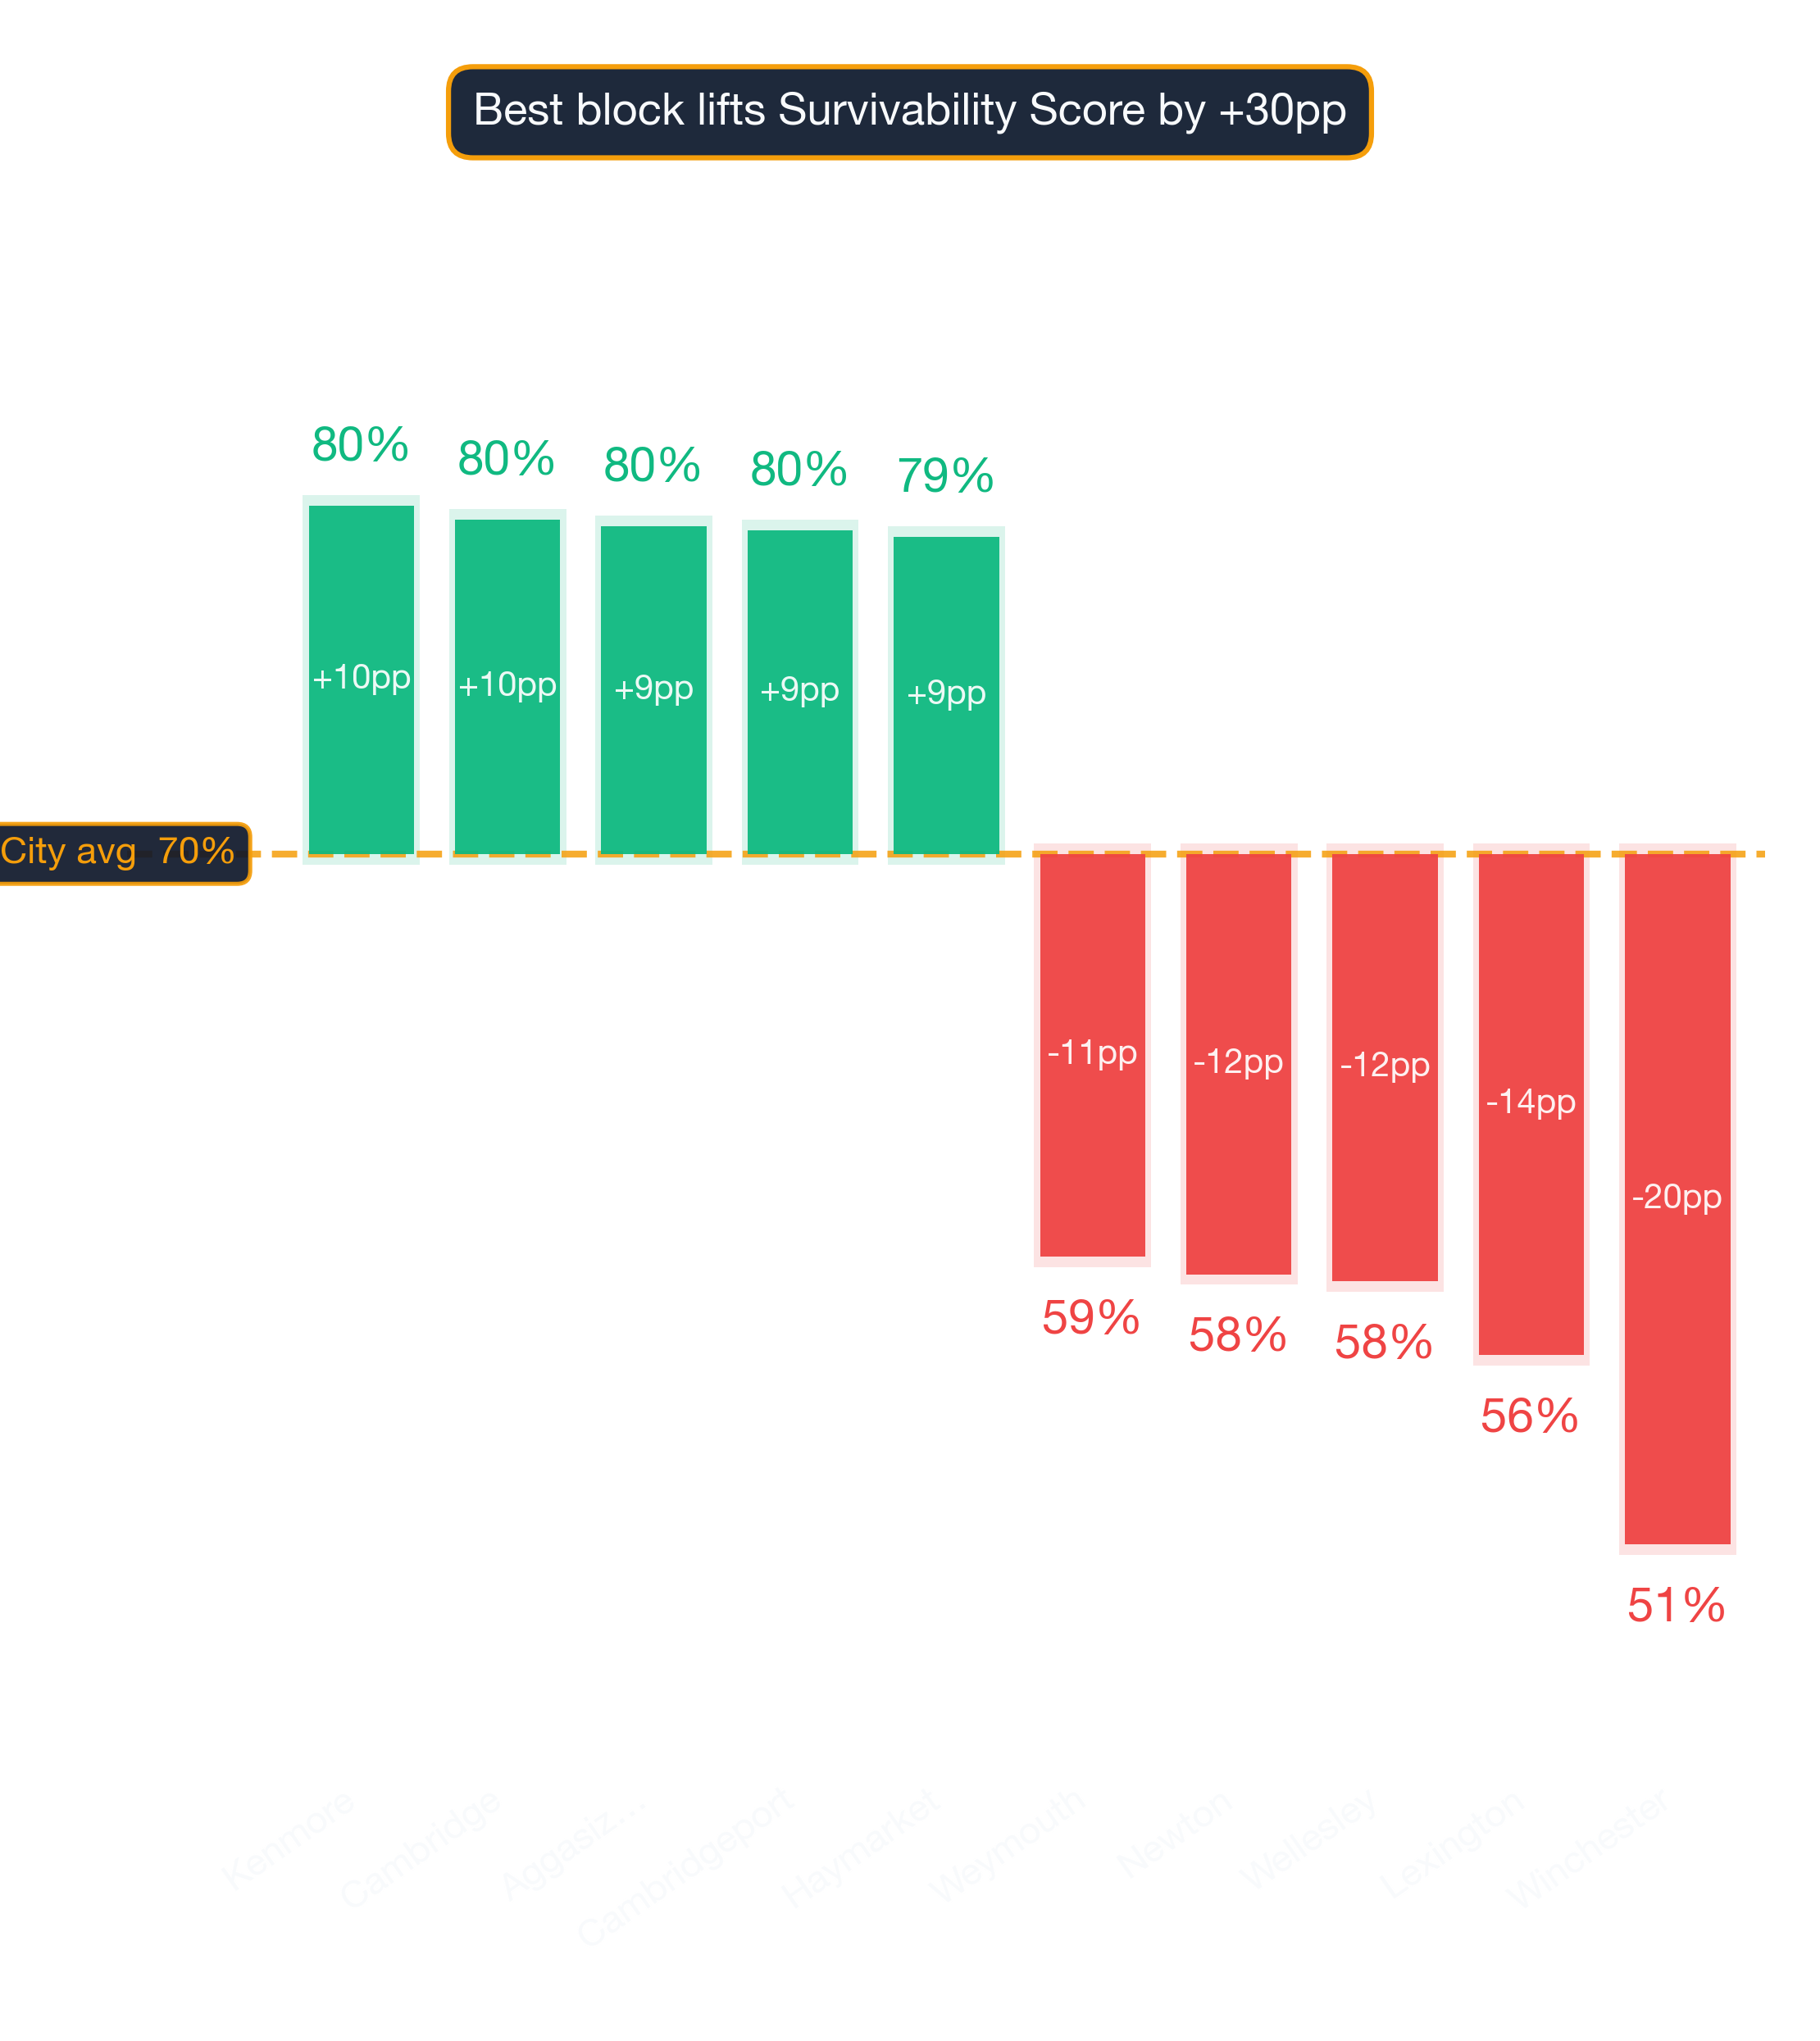
- #1 Neighborhood: Kenmore — 80% average survivability for Smoke Shop
- Neighborhoods at or above 70%: 51 of 88 analyzed
- City-wide average: 70% for Smoke Shops
- Most challenging area: Winchester at 51%
- Revenue advantage (top vs. avg location): ~14.0% more expected revenue in Kenmore
- Data freshness: 2026 data · Full methodology →
Table of Contents
- Summary
- 10 Best Neighborhoods
- Where Would a Smoke Shop Make the Most Money?
- What Should I Consider?
- Where Should I Start?
- FAQ: Best Neighborhoods
- FAQ: Can a Smoke Shop Succeed in Lower-Ranked Areas?
- FAQ: How Often Are Rankings Updated?
- FAQ: Is a Smoke Shop a Good Tenant?
- Landlord Survivability Data
- Best Neighborhoods for Any Business
Summary
Of all the neighborhoods in and around Boston, Kenmore ranks #1 for opening a Smoke Shop with 80% average chance of surviving more than 2 years, with the best locations offering 84% and the most challenging locations in Kenmore at 75%. The worst neighborhoods include Winchester with 51% average chance. For the most current predictions, visit StreetSpring to analyze your specific location in real-time.
What Are the Best Neighborhoods in Boston to Open a Smoke Shop?
Kenmore ranks #1 of 88 neighborhoods analyzed in and around Boston for Smoke Shop survivability with a score of 80% as of 2026. The top 10 neighborhoods are:
What separates the top neighborhoods from the rest
| Rank | Neighborhood | Best Locations | Average Locations | Challenging Locations |
|---|---|---|---|---|
| 1 | Kenmore | 81.0% – 85.0% | 78.5% – 82.7% | 74.0% – 78.0% |
| 2 | Cambridge | 84.0% – 88.0% | 78.1% – 82.4% | 68.0% – 72.0% |
| 3 | Aggasiz - Harvard North | 80.0% – 84.0% | 77.9% – 82.2% | 73.0% – 77.0% |
| 4 | Cambridgeport | 80.0% – 84.0% | 77.8% – 82.0% | 72.0% – 76.0% |
| 5 | Haymarket | 80.0% – 84.0% | 77.6% – 81.9% | 76.0% – 80.0% |
| 6 | Riverside | 83.0% – 87.0% | 77.5% – 81.8% | 69.0% – 73.0% |
| 7 | Government Center | 79.0% – 83.0% | 76.5% – 80.7% | 73.0% – 77.0% |
| 8 | Back Bay | 79.0% – 83.0% | 76.1% – 80.3% | 73.0% – 77.0% |
| 9 | Mission Hill | 80.0% – 84.0% | 76.0% – 80.3% | 70.0% – 74.0% |
| 10 | Peabody | 84.0% – 88.0% | 76.0% – 80.3% | 70.0% – 74.0% |
The data signals behind these scores
However, individual locations vary widely, and even in lower-scoring neighborhoods there are pockets that perform exceptionally well. The live platform incorporates the most recent foot traffic, competitor, and spending data for your exact address.
Survivability ranges reflect best and worst storefront conditions within each neighborhood. See our full methodology →
Try StreetSpring to see if this location is still the best and see if there are locations to rent in this area right now.
Boston's Best-Earning Neighborhoods for Smoke Shops
In Kenmore, the best possible location offers the opportunity of making ~14.0% more than the average location in or around Boston.
On the other hand, in Winchester, the worst possible location could result in making ~27.9% less than the average location in the city.
Choosing the right address is the highest-leverage decision for any brick-and-mortar entrepreneur. Opening a Smoke Shop in Boston requires careful location choice. Across 88 neighborhoods analyzed, the overall average survival chance for a new Smoke Shop is 70% for lasting more than 2 years — due to a combination of many factors across competition, consumer spending, and location dynamics. What makes a location ideal varies by business type — foot traffic patterns, competitor proximity, and consumer demographics all play different roles.
What Should I Consider When Opening a Smoke Shop in or Around Boston?
Choosing the right storefront is what separates the businesses that survive from the ones that don't. Use Survivability Score as the primary filter before anything else. The most important factor for a business's success is the Revenue Capture Score for the business at the location it selects. StreetSpring computes this by projecting the business's market share, which is based on the quality and quantity of primary, secondary, and tertiary competitors. StreetSpring's training dataset includes millions of transactions and business lifecycle events. Clustering works when it draws more customers to the area than any single business could alone. Our prediction system is built from scratch using proprietary data pipelines and validated against actual business lifecycles.
| Consideration | Common pitfall | What to verify before signing |
|---|---|---|
| Parking & visibility | Storefront looks great from the sidewalk but is invisible from the road. | Drive past at 30 mph from both directions. Count street parking + nearest paid lot capacity at peak hours. |
| Permitted hours | Late-night or early-morning ops blocked by zoning, neighborhood association, or shared-wall restrictions. | Confirm the permitted hours-of-operation are in your lease AND in the local code. Pull recent variances or complaints from the zoning portal. |
| Workforce availability | Hiring radius is smaller than you think — many neighborhoods can't staff a full team at standard wages. | Pull BLS wage data for your industry in this metro. Walk through your staffing plan with a local restaurant/retail operator before signing. |
This can be summarized as:
Revenue Capture Score = Projected Market Share × Forecasted Spend on Specific Business
Related: Survivability Score: How We Calculate It & Why It Matters
StreetSpring recalculates survivability using the latest competitive, demographic, and walkability data. The live platform incorporates the most recent foot traffic, competitor, and spending data for your exact address.
Pinpointing the Right Neighborhood for a Smoke Shop in Boston
The highest-performing areas for this business type are Kenmore, Cambridge, and Aggasiz - Harvard North, while the most challenging neighborhoods would be Winchester, Lexington, and Wellesley. These averages are directional, not definitive; the best decision comes from analyzing your specific storefront. Static rankings provide a useful baseline, but the live tool captures changes that have occurred since publication.
Related Articles:
Where in Boston Should You Open a Smoke Shop?
Based on StreetSpring's 2026 analysis, the top neighborhood for a Smoke Shop in Boston is Kenmore with 80% average survivability, followed by Cambridge and Aggasiz - Harvard North. 51 of 88 neighborhoods analyzed exceed 70% two-year survival.
However, market conditions change daily, and it's best to use StreetSpring's live data to check the Survivability Score for a specific address.
Are Bottom-Tier Boston Neighborhoods a No-Go for Smoke Shops?
Yes — neighborhood averages mask significant block-by-block variation. Even in neighborhoods ranked outside the top 10, individual storefronts with strong foot traffic, low direct competition, and favorable lease terms can outperform the area average. However, individual locations vary widely, and even in lower-scoring neighborhoods there are pockets that perform exceptionally well. Always check your specific address in StreetSpring's live platform for the most accurate prediction.
The Update Schedule for Boston Smoke Shops Data
StreetSpring recalculates survivability scores regularly using the latest competitive, demographic, and walkability data. Rankings are updated quarterly; the live tool always reflects the most current predictions for any address in Boston.
Is a Smoke Shop a Good Tenant for Boston Landlords?
In Kenmore, StreetSpring forecasts a 78.5% – 82.7% average chance for a new Smoke Shop to survive more than 2 years, depending on the exact storefront. Check the current Survivability Score for any address instantly.
Landlord Survivability Data for Smoke Shop in Boston
From a risk-assessment perspective, a Smoke Shop tenant in Kenmore carries the lowest risk with average survivability of 78.5% – 82.7%. Cambridge presents moderate risk (78.1% – 82.4%), and Aggasiz - Harvard North carries comparatively higher risk at 77.9% – 82.2%. Check the current Survivability Score for any address instantly.
StreetSpring provides address-specific survivability predictions for over 700 business types.
Related: How Landlord Representatives Can Reduce Vacancy & Increase Tenant Longevity
Which Boston Neighborhoods Are Strongest for Smoke Shops?
You can see the best neighborhoods in or around Boston to open any type of business in our article Neighborhood Survivability Rankings: Boston.
Technical note: Aggregated survivability rankings for Boston are available in machine-readable format for research and integration purposes.
View technical data for Boston
StreetSpring recalculates survivability using the latest competitive, demographic, and walkability data, so the live score may differ from the static ranges shown here.
Visual Data
Related Resources
Related:
Related:
- Survivability Rankings for Acupuncture Clinic in Atlanta
- Survivability Rankings for Afghan Restaurant in Atlanta
- Survivability Rankings for African Restaurant in Atlanta
Local Context FAQ
More questions answered with neighborhood-specific data from our 2026 corpus.
Which Boston subtypes have comparable survivability to Smoke Shops?
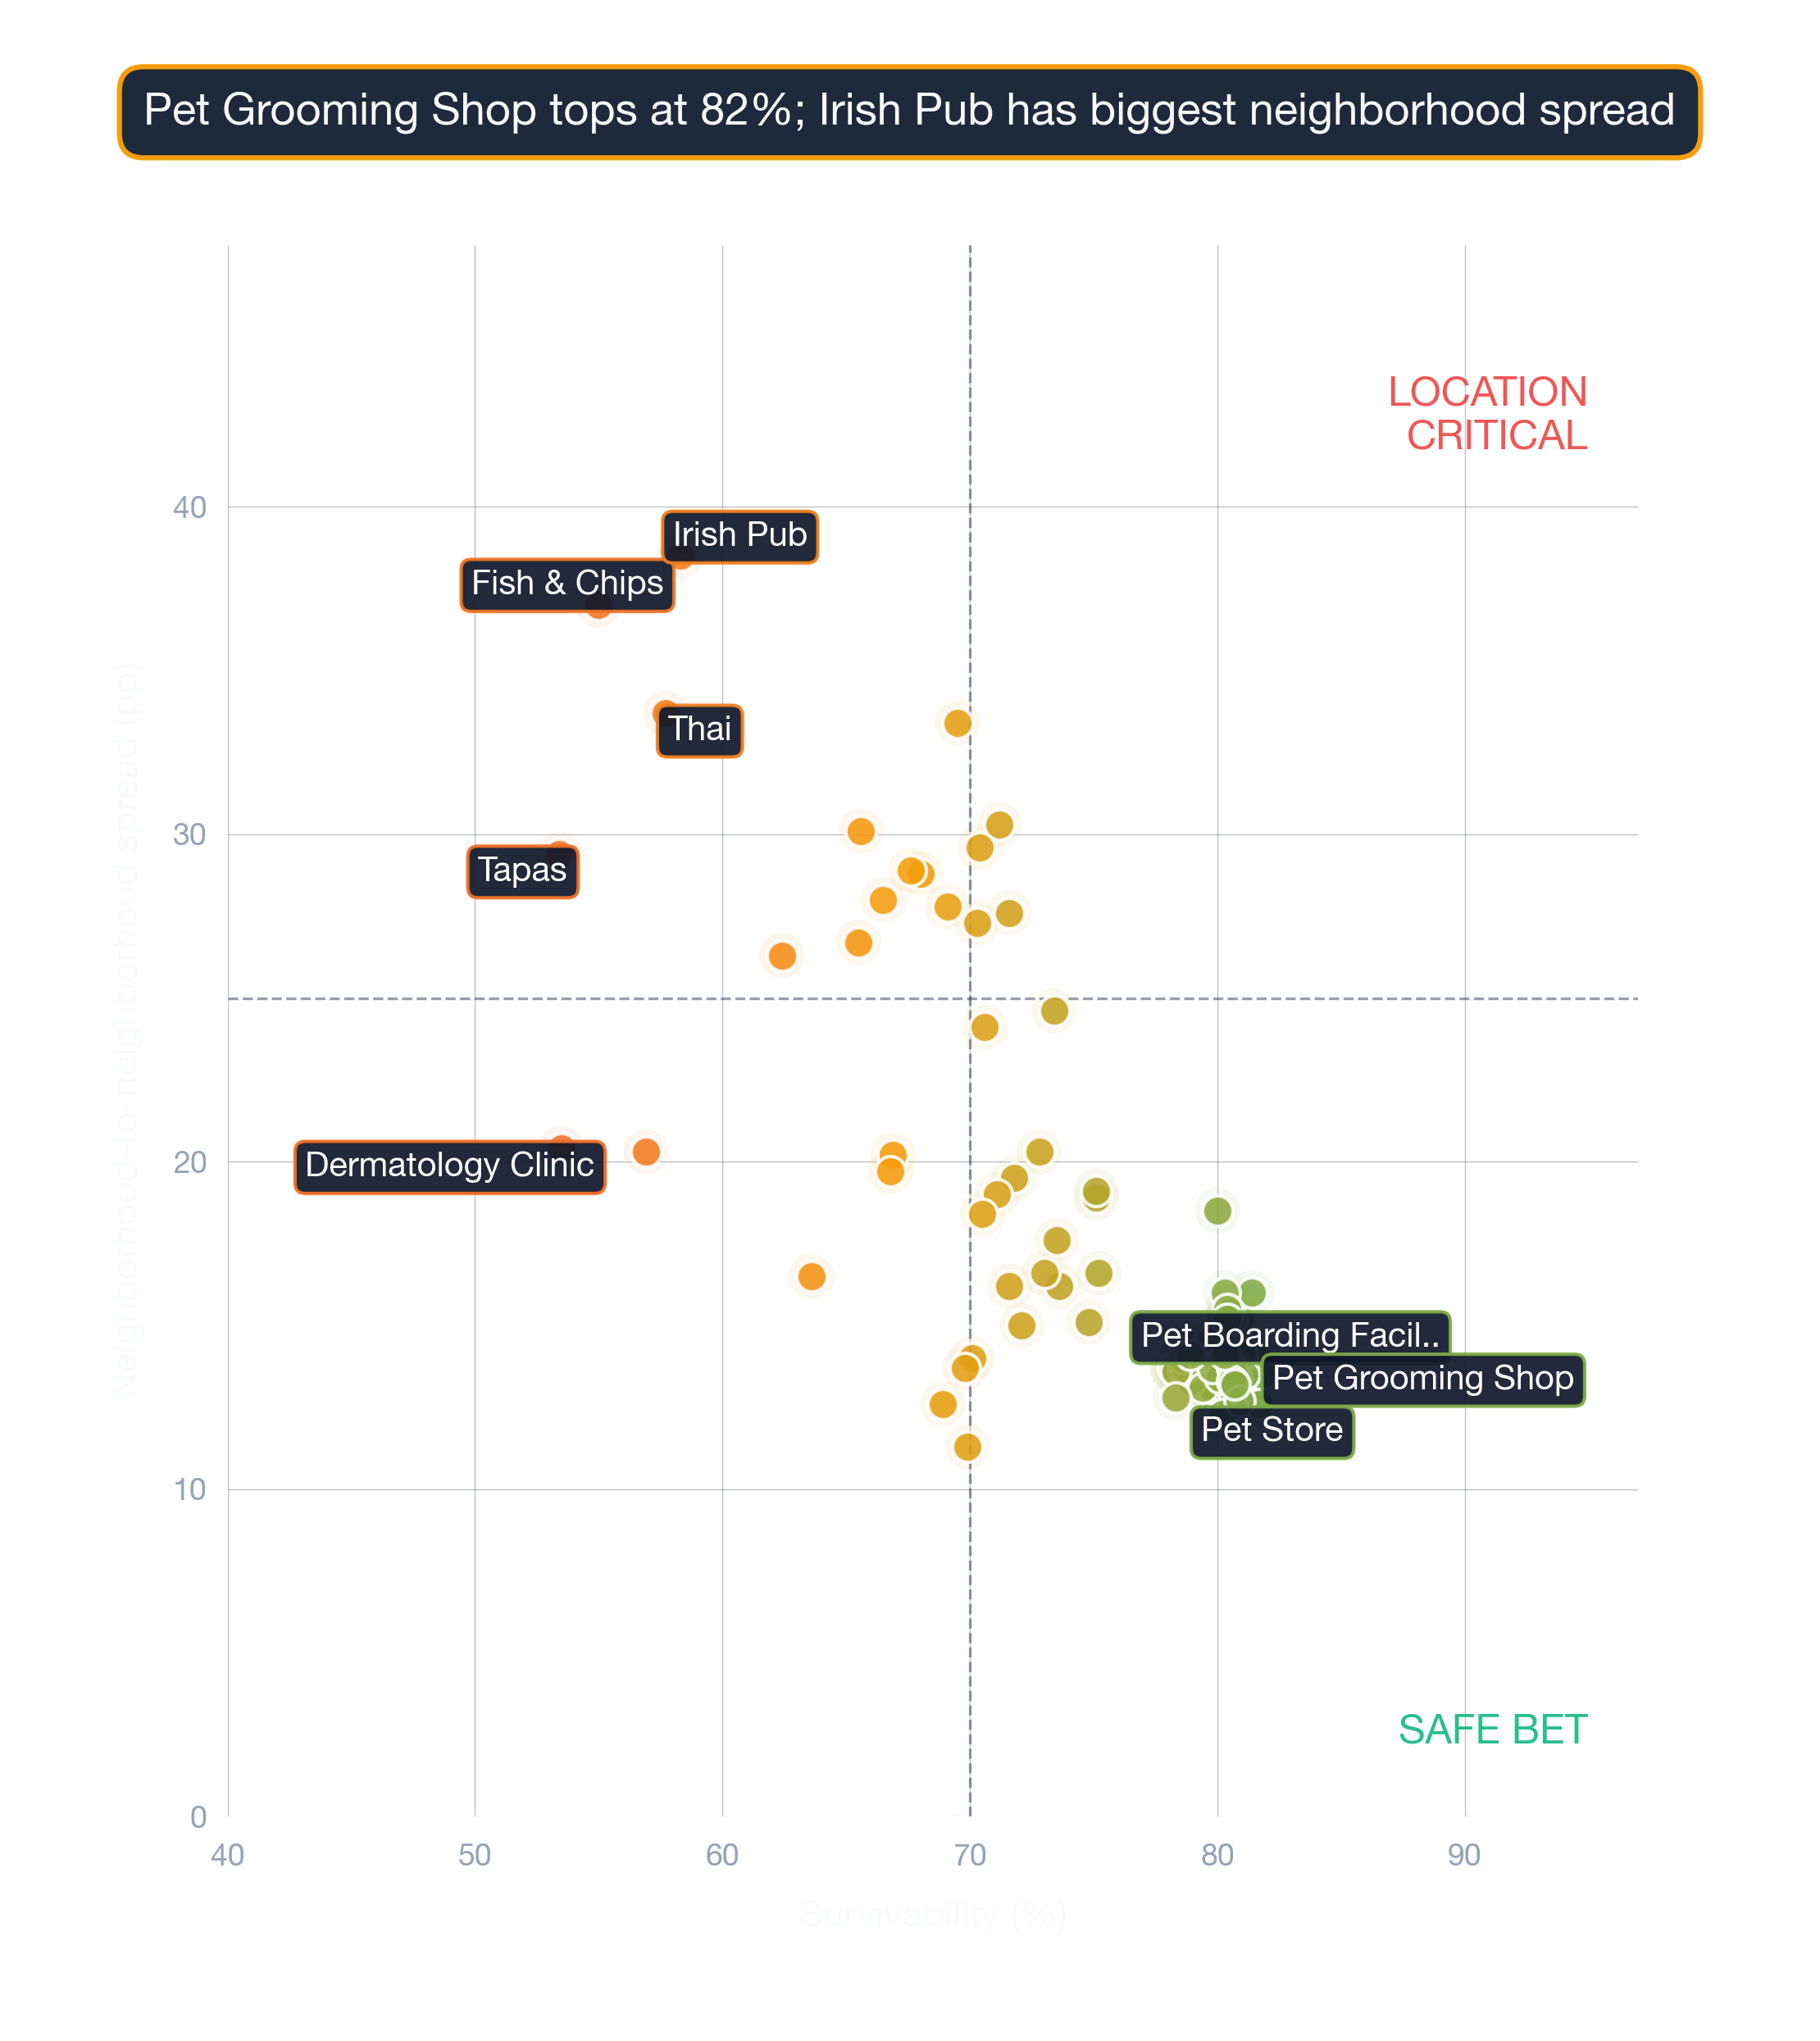
In Boston, business subtypes with survivability averages within 2 points of Smoke Shops (76%) include Veterinary Clinic, Brewery, Pet Grooming Shop. Comparable averages suggest similar competitive and demographic drivers at the metro level.
How does Boston Smoke Shop survivability compare to the national BLS baseline?
Smoke Shops have a national 5-year survival rate of 48% per BLS Business Employment Dynamics (March 2025). StreetSpring's Boston corpus shows an average survivability score of 76% for this subtype, above the BLS baseline by 28 points.
Do Smoke Shops need walkable locations in Boston?
Boston's metro median commute is 32 minutes. Accessibility is one of ~100 factors in the survivability model — Smoke Shops in Boston score 76% on average, with the spread (46-94%) driven heavily by per-location accessibility differences.