Survivability Rankings for Singaporean Restaurant in Boston
StreetSpring's 2026 analysis ranks the best and worst neighborhoods in Boston to open a Singaporean Restaurant, from Haverhill (88% survival) to Winches...
By Bobby Koons | Reviewed: May 4, 2026 | Refreshed weekly | Methodology
Quick Summary
- #1 Neighborhood: Haverhill — 88% average survivability for Singaporean Restaurant
- Neighborhoods at or above 70%: 88 of 88 analyzed
- City-wide average: 81% for Singaporean Restaurants
- Most challenging area: Winchester at 74%
- Revenue advantage (top vs. avg location): ~8.2% more expected revenue in Haverhill
- Data freshness: 2026 data · Full methodology →
Table of Contents
- Summary
- 10 Best Neighborhoods
- Where Would a Singaporean Restaurant Make the Most Money?
- What Should I Consider?
- Where Should I Start?
- FAQ: Best Neighborhoods
- FAQ: Can a Singaporean Restaurant Succeed in Lower-Ranked Areas?
- FAQ: How Often Are Rankings Updated?
- FAQ: Is a Singaporean Restaurant a Good Tenant?
- Landlord Survivability Data
- Best Neighborhoods for Any Business
Summary
Haverhill leads Boston's 2026 survivability rankings for Singaporean Restaurant operators with 88% average chance of surviving more than 2 years, with the best locations offering >97% and the most challenging locations in Haverhill at 63%. The worst neighborhoods include Winchester with 74% average chance. A low-ranking neighborhood can still contain high-potential storefronts — the address matters most.
Which Boston Neighborhoods Are Strongest for Singaporean Restaurants?
Haverhill ranks #1 of 88 neighborhoods analyzed in and around Boston for Singaporean Restaurant survivability with a score of 88% as of 2026. The top 10 neighborhoods are:
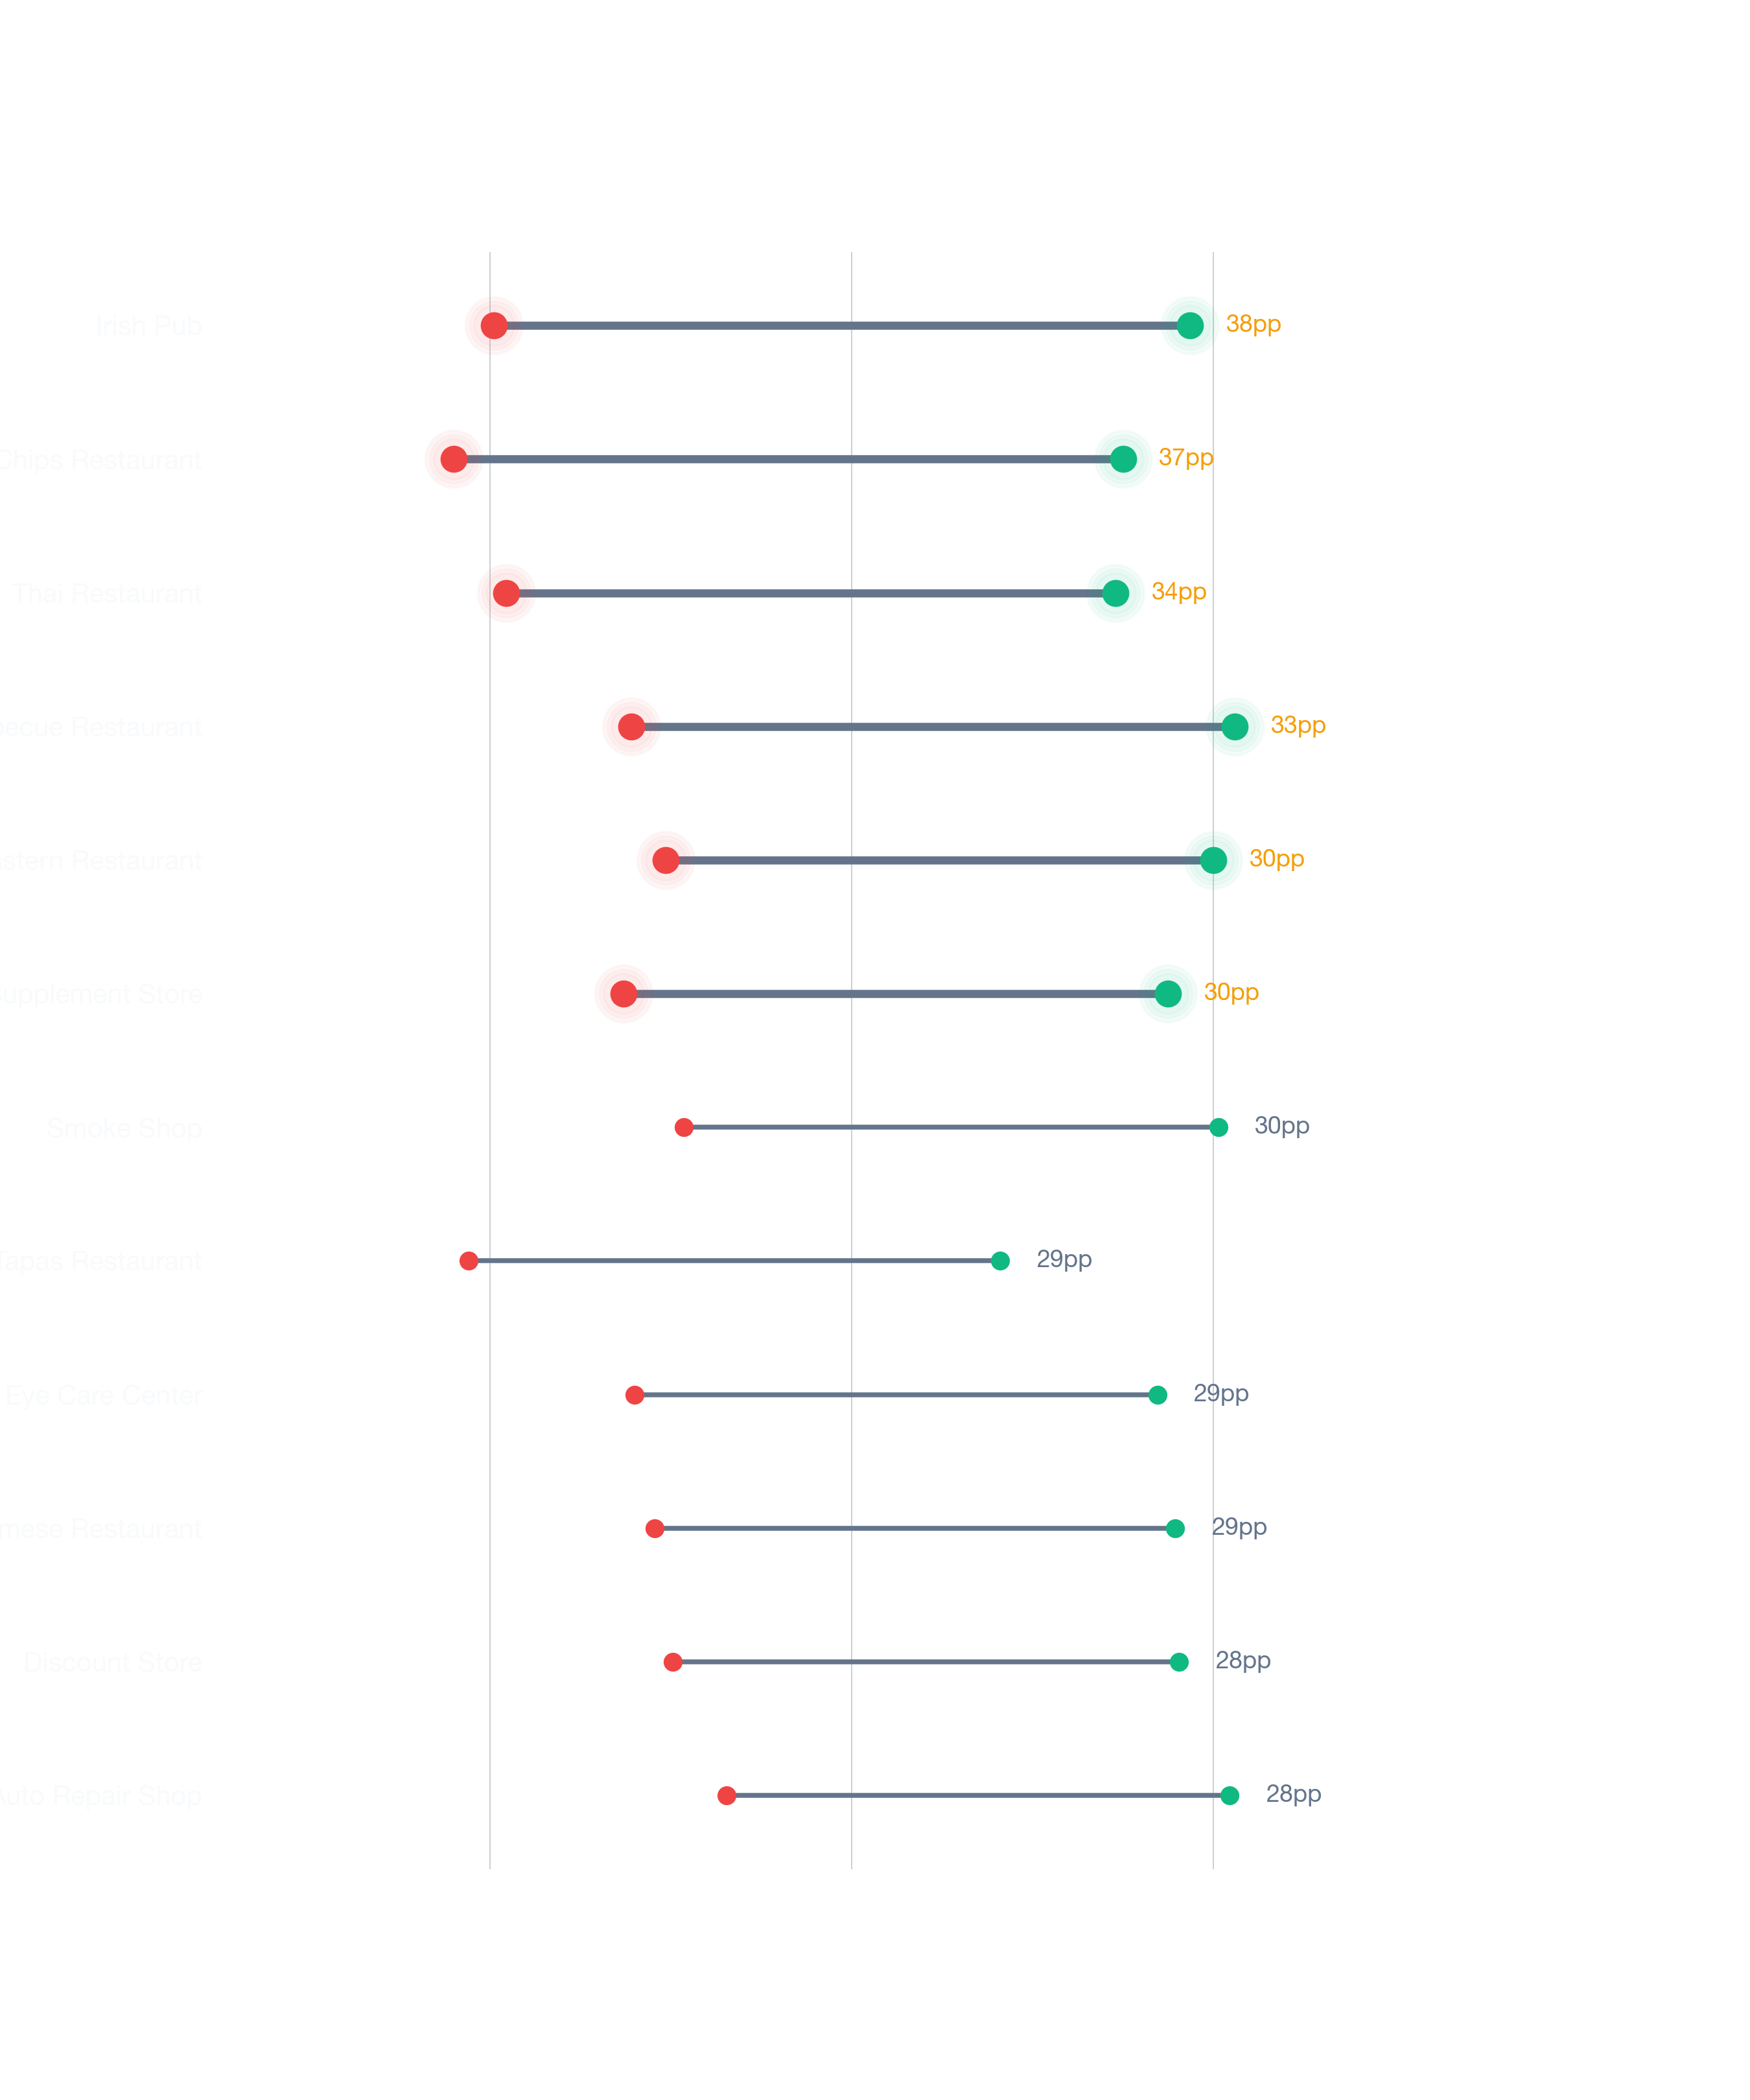
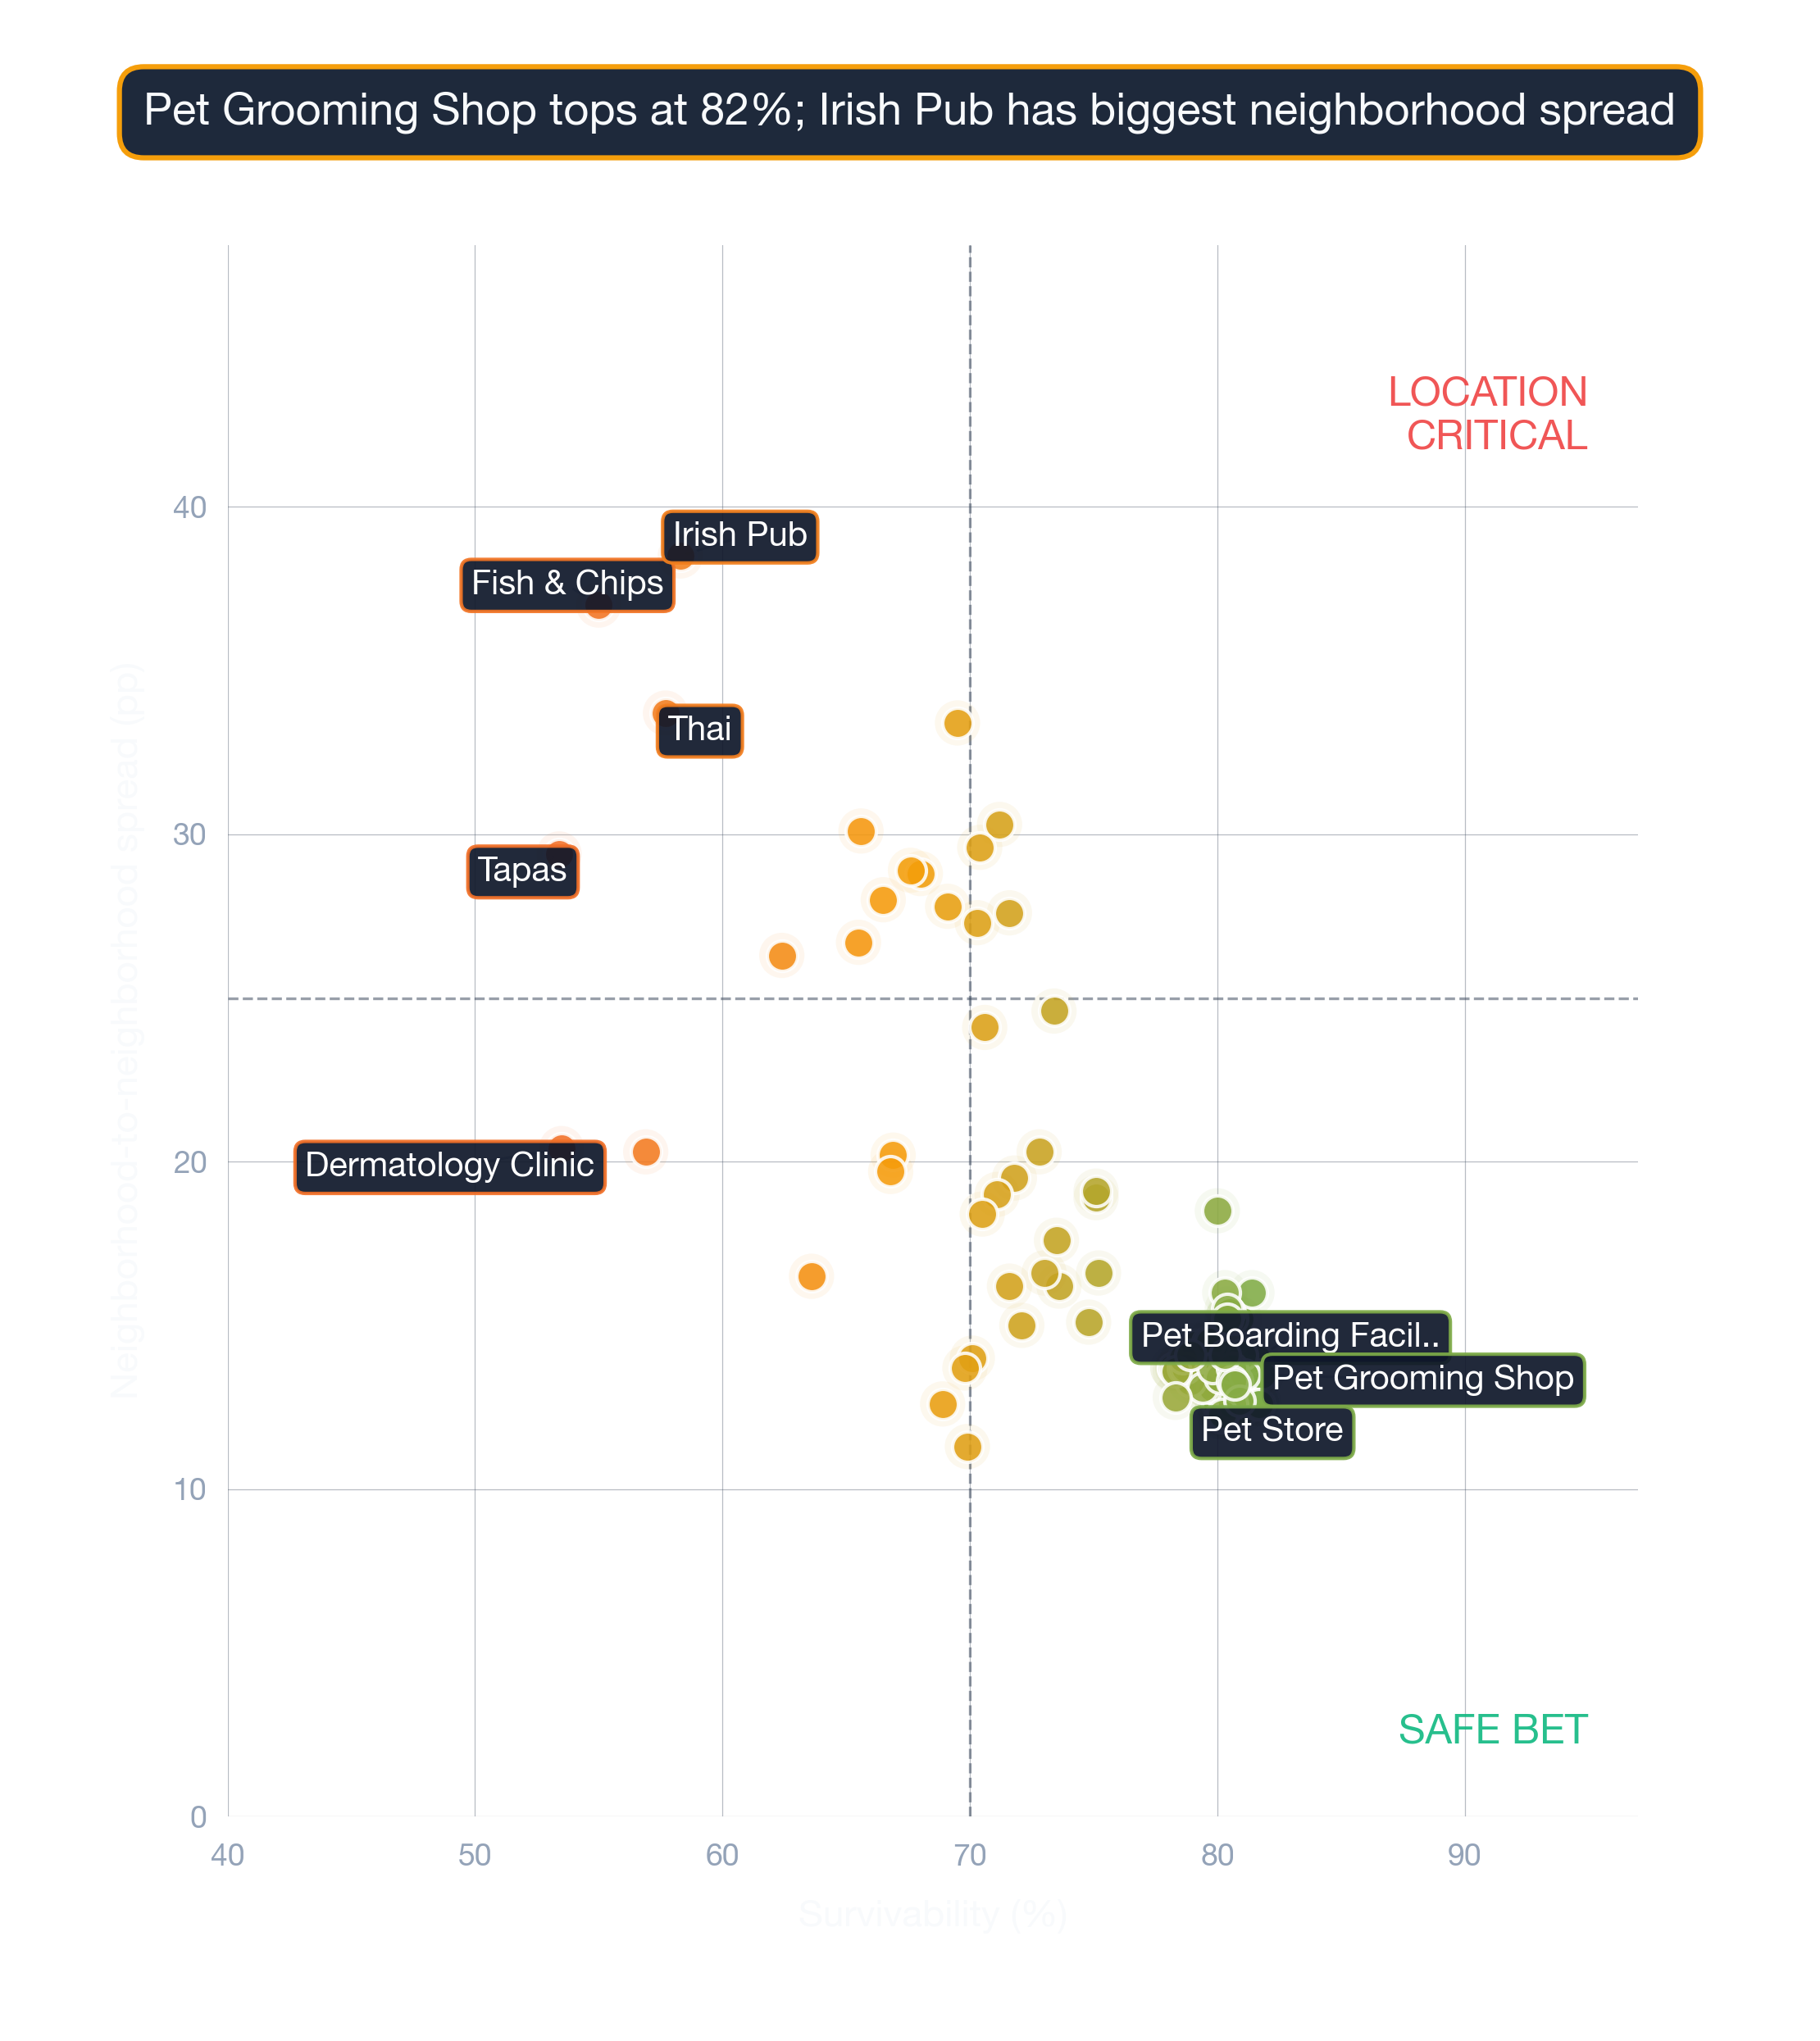
What the score spread tells you about risk
| Rank | Neighborhood | Best Locations | Average Locations | Challenging Locations |
|---|---|---|---|---|
| 1 | Haverhill | 95.0% – 97.0% | 86.3% – 90.1% | 62.0% – 66.0% |
| 2 | Boston | 90.0% – 94.0% | 86.0% – 89.7% | 72.0% – 76.0% |
| 3 | Needham | 95.0% – 97.0% | 84.9% – 88.6% | 64.0% – 68.0% |
| 4 | Merrymount | 90.0% – 94.0% | 84.9% – 88.6% | 75.0% – 79.0% |
| 5 | Medfield | 95.0% – 97.0% | 84.2% – 87.9% | 60.0% – 64.0% |
| 6 | Methuen | 94.0% – 97.0% | 84.0% – 87.7% | 66.0% – 70.0% |
| 7 | Dover | 93.0% – 97.0% | 83.8% – 87.5% | 66.0% – 70.0% |
| 8 | Aggasiz - Harvard North | 85.0% – 89.0% | 83.6% – 87.3% | 80.0% – 84.0% |
| 9 | Revere | 94.0% – 97.0% | 83.4% – 87.1% | 65.0% – 69.0% |
| 10 | Adams Shore | 90.0% – 94.0% | 83.0% – 86.7% | 70.0% – 74.0% |
Where the rankings might surprise you
Location-level factors like visibility and adjacent tenants can override neighborhood-level trends. However, market conditions change daily, and it's best to use StreetSpring's live data to check the Survivability Score for a specific address.
Survivability ranges reflect best and worst storefront conditions within each neighborhood. See our full methodology →
Try StreetSpring to see if this location is still the best and see if there are locations to rent in this area right now.
Boston's Best-Earning Neighborhoods for Singaporean Restaurants
In Haverhill, the best possible location offers the opportunity of making ~8.2% more than the average location in or around Boston.
On the other hand, in Winchester, the worst possible location could result in making ~8.5% less than the average location in the city.
Location is the single strongest predictor of whether a business thrives or fails. Opening a Singaporean Restaurant in Boston requires careful location choice. Across 88 neighborhoods analyzed, the overall average survival chance for a new Singaporean Restaurant is 81% for lasting more than 2 years — due to a combination of many factors across competition, consumer spending, and location dynamics. Different business types will have different forecasted spend than others, and all of those would have different projections for each location.
What Matters Most When Opening a Singaporean Restaurant in Boston
Selecting a high-survivability address is the single most cost-effective risk reduction available before signing a lease. Everything downstream depends on it. Of all the variables StreetSpring analyzes, Revenue Capture Score has the strongest predictive power. StreetSpring computes this by projecting the business's market share, which is based on the quality and quantity of primary, secondary, and tertiary competitors. We incorporate data from thousands of neighborhoods and hundreds of thousands of individual businesses. Our data shows that businesses in moderately competitive clusters survive longer than isolated storefronts on average. StreetSpring leverages exclusive data sources and custom models for these projections.
| Consideration | Common pitfall | What to verify before signing |
|---|---|---|
| Foot traffic seasonality | Looking at a peak-summer Tuesday and assuming year-round volume. | Walk the block at 3 different times across 2 different weeks. Ask neighboring tenants for their slow-season % drop. |
| Competitor density | Counting only direct competitors and missing adjacent-category overlap (e.g. coffee shop near a bakery). | Map all businesses serving overlapping customer needs within a 5-min walk. Use StreetSpring's competitor view as a starting point. |
| Outdoor seating / sidewalk use | Signing assuming you can add patio seating, then learning the city requires a separate sidewalk-cafe permit with long lead times. | Check the city's sidewalk-cafe permit process up front. Confirm landlord allows outdoor build-out in the lease language. |
This can be summarized as:
Revenue Capture Score = Projected Market Share × Forecasted Spend on Specific Business
Related: Survivability Score: How We Calculate It & Why It Matters
StreetSpring recalculates survivability using the latest competitive, demographic, and walkability data. Static rankings provide a useful baseline, but the live tool captures changes that have occurred since publication.
Pinpointing the Right Neighborhood for a Singaporean Restaurant in Boston
Based on our analysis, the leading neighborhoods are Haverhill, Boston, and Needham, while the most challenging neighborhoods would be Winchester, Arlington, and West Roxbury. However, individual locations vary widely, and even in lower-scoring neighborhoods there are pockets that perform exceptionally well. StreetSpring's Survivability Scores are updated regularly, so the most accurate prediction for your exact storefront is always available in the live tool.
Related Articles:
Top-Survivability Boston Neighborhoods for Singaporean Restaurants
Based on StreetSpring's 2026 analysis, the top neighborhood for a Singaporean Restaurant in Boston is Haverhill with 88% average survivability, followed by Boston and Needham. 88 of 88 neighborhoods analyzed exceed 70% two-year survival.
Because local conditions evolve weekly, the live survivability tool offers a more current snapshot than any published ranking.
Can a Singaporean Restaurant Succeed in Lower-Ranked Neighborhoods in Boston?
Yes — neighborhood averages mask significant block-by-block variation. Even in neighborhoods ranked outside the top 10, individual storefronts with strong foot traffic, low direct competition, and favorable lease terms can outperform the area average. For the most current predictions, visit StreetSpring to analyze your specific location in real-time. Always check your specific address in StreetSpring's live platform for the most accurate prediction.
How Fresh Is Our Boston Singaporean Restaurant Ranking Data?
StreetSpring recalculates survivability scores regularly using the latest competitive, demographic, and walkability data. Rankings are updated quarterly; the live tool always reflects the most current predictions for any address in Boston.
Should Boston Landlords Lease to Singaporean Restaurants?
In Haverhill, StreetSpring forecasts a 86.3% – 90.1% average chance for a new Singaporean Restaurant to survive more than 2 years, depending on the exact storefront. Check the current Survivability Score for any address instantly.
Landlord Survivability Data for Singaporean Restaurant in Boston
Reducing vacancy starts with choosing tenants whose business type matches the neighborhood's strengths. For Singaporean Restaurant tenants, Haverhill provides the best survivability conditions (86.3% – 90.1%). Boston and Needham also show viable averages at 86.0% – 89.7% and 84.9% – 88.6% respectively. See which business types are most likely to succeed at your property address right now.
StreetSpring provides address-specific survivability predictions for over 700 business types.
Related: How Landlord Representatives Can Reduce Vacancy & Increase Tenant Longevity
Where Singaporean Restaurants Thrive in Boston
You can see the best neighborhoods in or around Boston to open any type of business in our article Neighborhood Survivability Rankings: Boston.
Technical note: Aggregated survivability rankings for Boston are available in machine-readable format for research and integration purposes.
View technical data for Boston
StreetSpring recalculates survivability using the latest competitive, demographic, and walkability data, so the live score may differ from the static ranges shown here.
Visual Data
Related Resources
Related:
Related:
- Survivability Rankings for Acupuncture Clinic in Atlanta
- Survivability Rankings for Afghan Restaurant in Atlanta
- Survivability Rankings for African Restaurant in Atlanta
Local Context FAQ
Additional questions with answers drawn directly from local data sources.
What 5-year survival rate does the federal government track for Singaporean Restaurants?
Per BLS Business Employment Dynamics (March 2025 release), Singaporean Restaurants have a 50% 5-year survival rate nationally. StreetSpring's Boston model averages 85% across tracked locations — above the national baseline by 35 percentage points.
Do Singaporean Restaurants need walkable locations in Boston?
Boston's metro median commute is 32 minutes. Accessibility is one of ~100 factors in the survivability model — Singaporean Restaurants in Boston score 85% on average, with the spread (60-99%) driven heavily by per-location accessibility differences.
Is Boston a strong economic environment for opening a Singaporean Restaurant?
Broader metro: ~96% employment rate, ~$135K median income per ACS. Singaporean Restaurants survivability in Boston averages 85%, with the model layering business-specific and site-specific factors on top.
How many Boston neighborhoods has StreetSpring scored for Singaporean Restaurants?
StreetSpring's Boston model covers Singaporean Restaurants across all tracked neighborhoods — the average score is 85%, with neighborhood-level scores spanning 60-99%. Real-time scores at the address level capture finer variation than these neighborhood averages.