Survivability Rankings for Seafood Restaurant in Boston
StreetSpring's 2026 analysis ranks the best and worst neighborhoods in Boston to open a Seafood Restaurant, from Fenway (76% survival) to Wellesley (62%).
By Bobby Koons | Reviewed: May 11, 2026 | Refreshed weekly | Methodology
Quick Summary
- #1 Neighborhood: Fenway — 76% average survivability for Seafood Restaurant
- Neighborhoods at or above 70%: 53 of 88 analyzed
- City-wide average: 70% for Seafood Restaurants
- Most challenging area: Wellesley at 62%
- Revenue advantage (top vs. avg location): ~8.4% more expected revenue in Fenway
- Data freshness: 2026 data · Full methodology →
Table of Contents
- Summary
- 10 Best Neighborhoods
- Where Would a Seafood Restaurant Make the Most Money?
- What Should I Consider?
- Where Should I Start?
- FAQ: Best Neighborhoods
- FAQ: Can a Seafood Restaurant Succeed in Lower-Ranked Areas?
- FAQ: How Often Are Rankings Updated?
- FAQ: Is a Seafood Restaurant a Good Tenant?
- Landlord Survivability Data
- Best Neighborhoods for Any Business
Summary
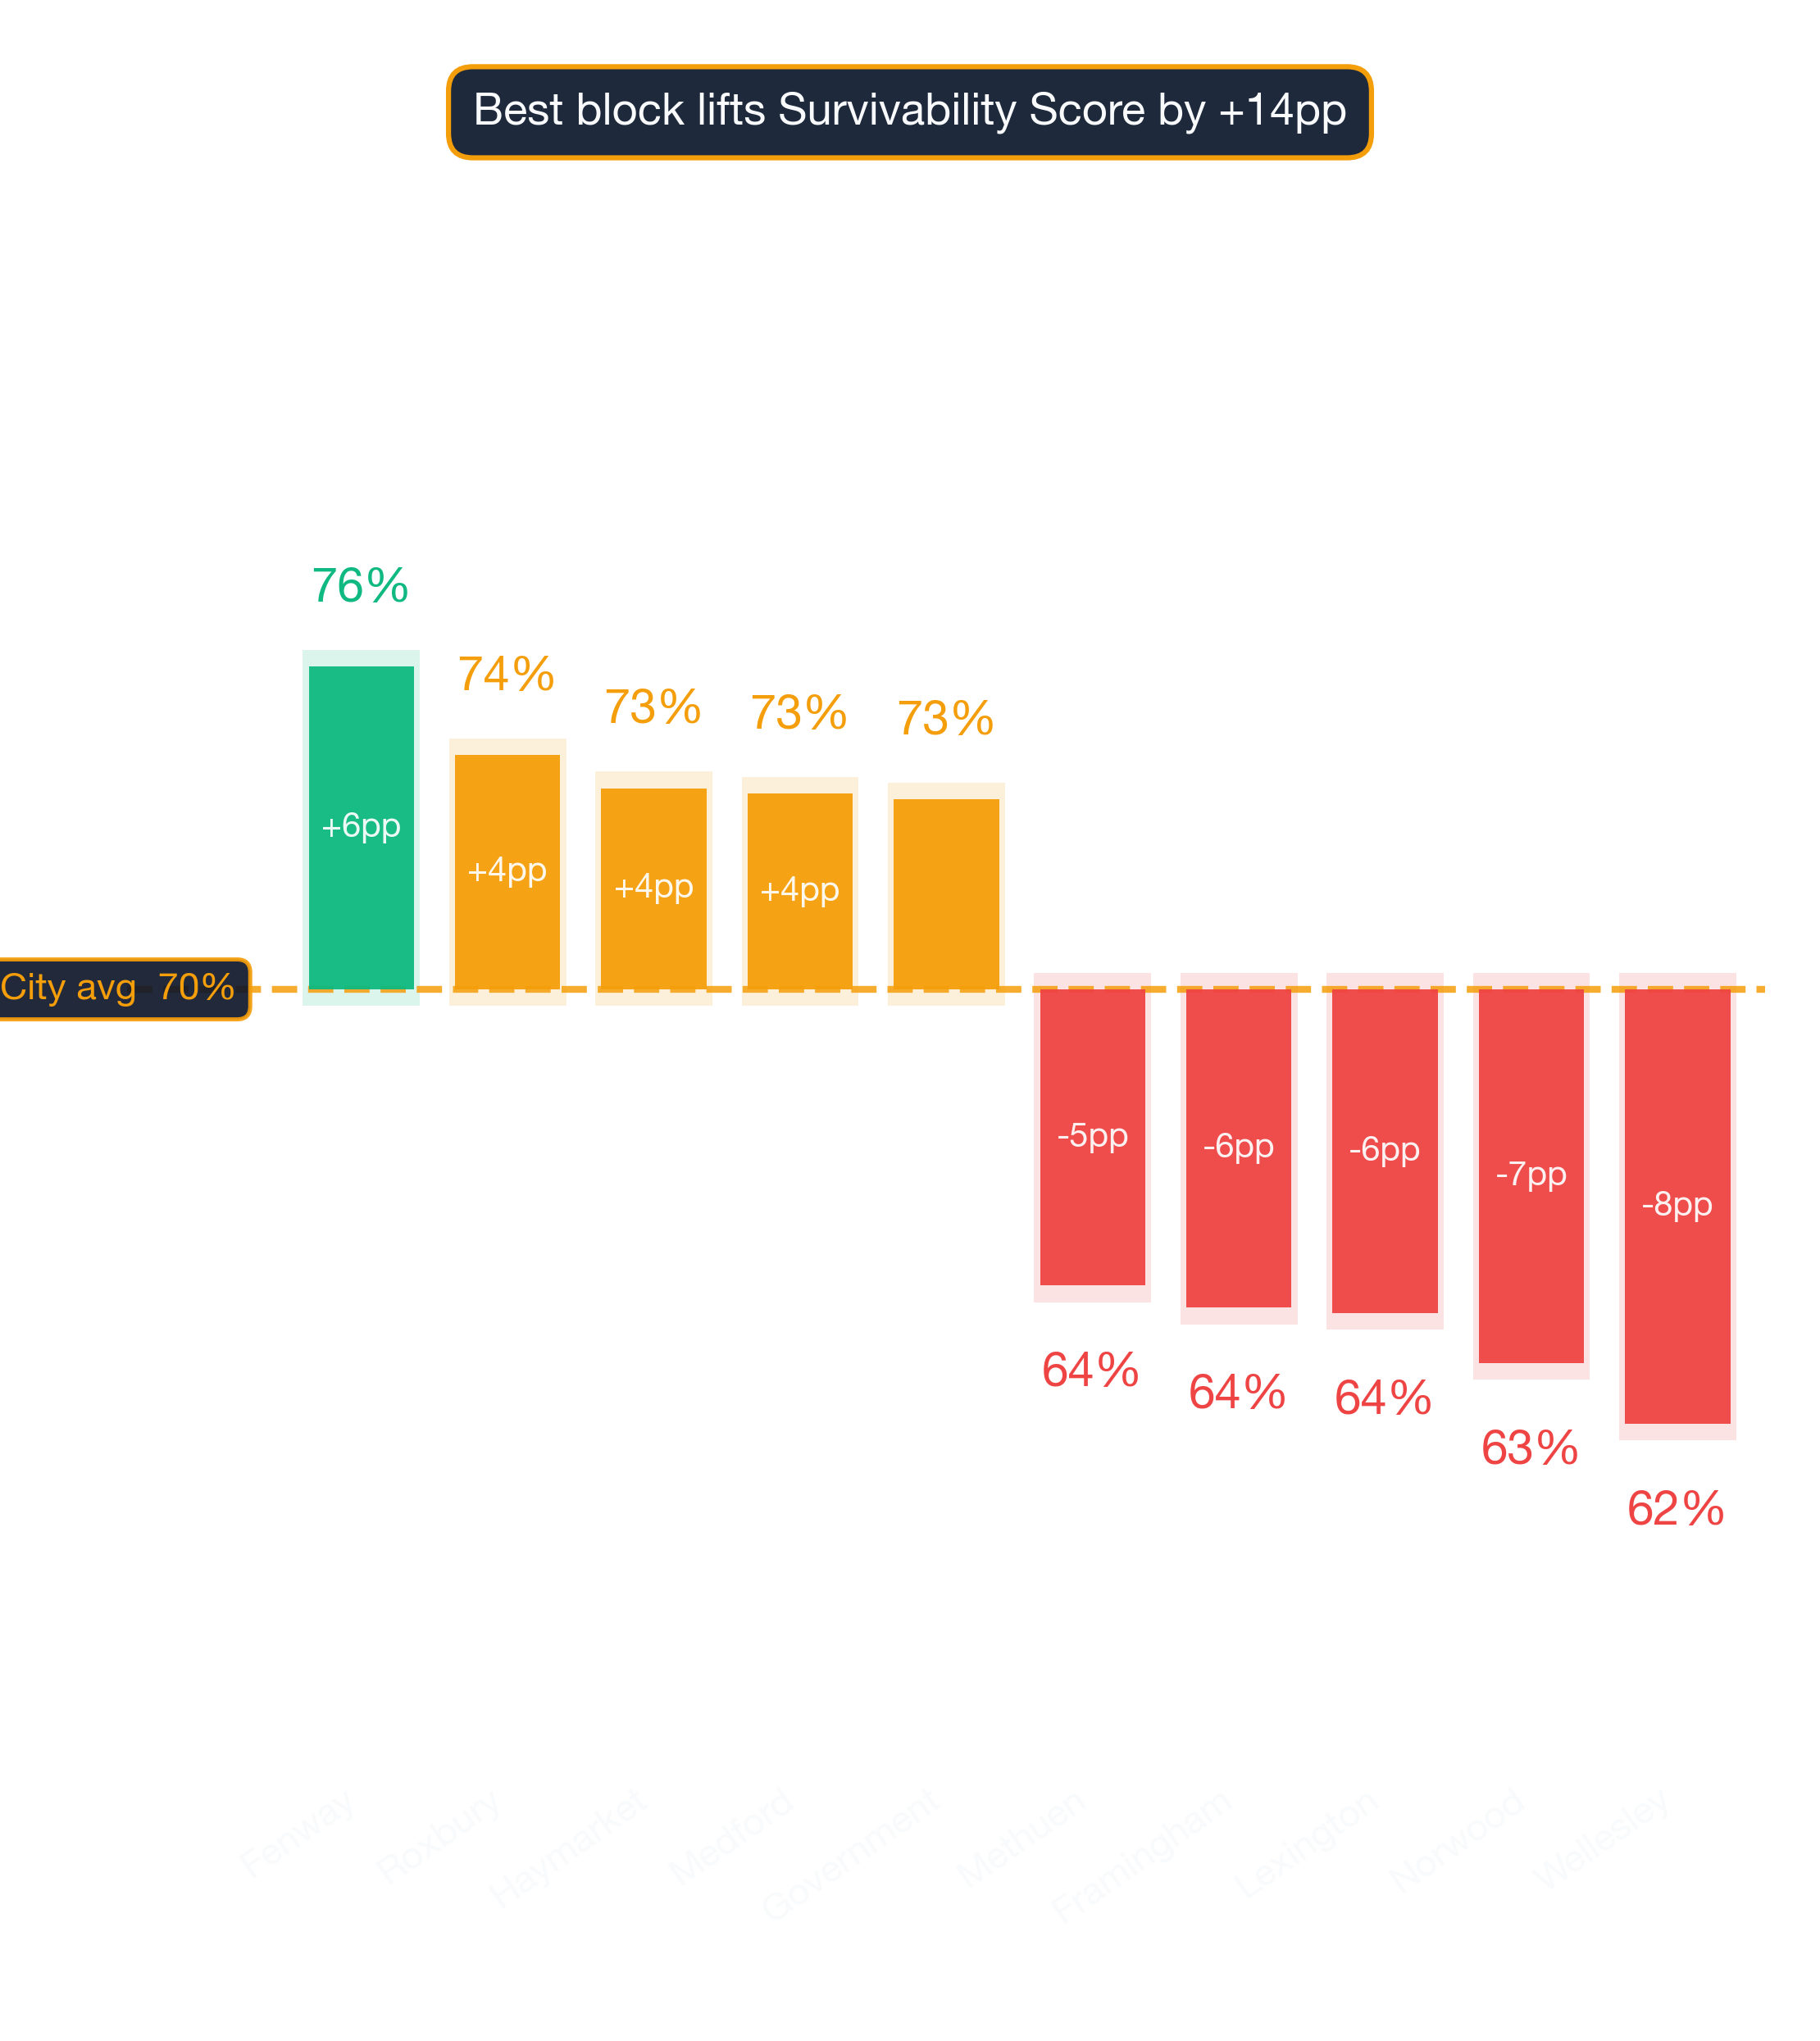
Of all the neighborhoods in and around Boston, Fenway ranks #1 for opening a Seafood Restaurant with 76% average chance of surviving more than 2 years, with the best locations offering 80% and the most challenging locations in Fenway at 69%. The worst neighborhoods include Wellesley with 62% average chance. For the most current predictions, visit StreetSpring to analyze your specific location in real-time.
Where Seafood Restaurants Thrive in Boston
Fenway ranks #1 of 88 neighborhoods analyzed in and around Boston for Seafood Restaurant survivability with a score of 76% as of 2026. The top 10 neighborhoods are:
Notable runners-up worth a second look
| Rank | Neighborhood | Best Locations | Average Locations | Challenging Locations |
|---|---|---|---|---|
| 1 | Fenway | 77.0% – 81.0% | 74.1% – 77.6% | 68.0% – 72.0% |
| 2 | Roxbury | 77.0% – 81.0% | 72.4% – 75.9% | 64.0% – 68.0% |
| 3 | Haymarket | 74.0% – 78.0% | 71.8% – 75.3% | 69.0% – 73.0% |
| 4 | Medford | 79.0% – 83.0% | 71.7% – 75.2% | 59.0% – 63.0% |
| 5 | Government Center | 74.0% – 78.0% | 71.7% – 75.1% | 69.0% – 73.0% |
| 6 | Downtown Crossing | 72.0% – 76.0% | 71.3% – 74.8% | 69.0% – 73.0% |
| 7 | Downtown | 74.0% – 78.0% | 71.1% – 74.6% | 66.0% – 70.0% |
| 8 | North End | 75.0% – 79.0% | 71.1% – 74.5% | 67.0% – 71.0% |
| 9 | South End | 74.0% – 78.0% | 71.0% – 74.5% | 63.0% – 67.0% |
| 10 | Bay Village | 74.0% – 78.0% | 71.0% – 74.4% | 68.0% – 72.0% |
How to use this list when you tour locations
These rankings are based on the latest available data; check StreetSpring for real-time updates. The live platform incorporates the most recent foot traffic, competitor, and spending data for your exact address.
Survivability ranges reflect best and worst storefront conditions within each neighborhood. See our full methodology →
Try StreetSpring to see if this location is still the best and see if there are locations to rent in this area right now.
Which Boston Neighborhoods Drive the Highest Seafood Restaurant Revenue?
In Fenway, the best possible location offers the opportunity of making ~8.4% more than the average location in or around Boston.
On the other hand, in Wellesley, the worst possible location could result in making ~11.3% less than the average location in the city.
The right location can make a business; the wrong one can break it. Opening a Seafood Restaurant in Boston requires careful location choice. Across 88 neighborhoods analyzed, the overall average survival chance for a new Seafood Restaurant is 70% for lasting more than 2 years — due to a combination of many factors across competition, consumer spending, and location dynamics. Our models show that the optimal location profile varies dramatically from one business category to the next.
The Most Important Factors for a Seafood Restaurant in Boston
There is no operational fix for a poorly chosen location. Use Survivability Score as a hard filter on candidate addresses before evaluating other factors. When evaluating a potential location, Revenue Capture Score should be the first number you look at. StreetSpring computes this by projecting the business's market share, which is based on the quality and quantity of primary, secondary, and tertiary competitors. StreetSpring has analyzed hundreds of thousands of business outcomes across major US metros. Neighborhoods with a mix of similar businesses frequently outperform isolated locations. StreetSpring's proprietary algorithms power these predictions.
| Consideration | Common pitfall | What to verify before signing |
|---|---|---|
| Parking & visibility | Storefront looks great from the sidewalk but is invisible from the road. | Drive past at 30 mph from both directions. Count street parking + nearest paid lot capacity at peak hours. |
| Foot traffic seasonality | Looking at a peak-summer Tuesday and assuming year-round volume. | Walk the block at 3 different times across 2 different weeks. Ask neighboring tenants for their slow-season % drop. |
| Workforce availability | Hiring radius is smaller than you think — many neighborhoods can't staff a full team at standard wages. | Pull BLS wage data for your industry in this metro. Walk through your staffing plan with a local restaurant/retail operator before signing. |
This can be summarized as:
Revenue Capture Score = Projected Market Share × Forecasted Spend on Specific Business
Related: Survivability Score: How We Calculate It & Why It Matters
Scores get refreshed against the latest competitive, demographic, and walkability data on an ongoing basis. The static rankings here may already be slightly behind; for a current address-level score, use StreetSpring's live tool.
The Best Place to Start a Seafood Restaurant in Boston
Based on our analysis, the leading neighborhoods are Fenway, Roxbury, and Haymarket, while the most challenging neighborhoods would be Wellesley, Norwood, and Lexington. However, individual locations vary widely, and even in lower-scoring neighborhoods there are pockets that perform exceptionally well. Market dynamics shift frequently; validate these insights with real-time data from StreetSpring.
Related Articles:
What Are the Best Neighborhoods in Boston to Open a Seafood Restaurant?
Based on StreetSpring's 2026 analysis, the top neighborhood for a Seafood Restaurant in Boston is Fenway with 76% average survivability, followed by Roxbury and Haymarket. 53 of 88 neighborhoods analyzed exceed 70% two-year survival.
For the most accurate predictions, always check your specific address in StreetSpring's live platform.
Should You Consider Lower-Survivability Areas of Boston for a Seafood Restaurant?
Yes — neighborhood averages mask significant block-by-block variation. Even in neighborhoods ranked outside the top 10, individual storefronts with strong foot traffic, low direct competition, and favorable lease terms can outperform the area average. Neighborhood averages mask significant block-by-block variation — always check your specific address. Always check your specific address in StreetSpring's live platform for the most accurate prediction.
When Does StreetSpring Update Boston Seafood Restaurant Rankings?
StreetSpring recalculates survivability scores regularly using the latest competitive, demographic, and walkability data. Rankings are updated quarterly; the live tool always reflects the most current predictions for any address in Boston.
Is a Seafood Restaurant a Good Tenant for Boston Landlords?
In Fenway, StreetSpring forecasts a 74.1% – 77.6% average chance for a new Seafood Restaurant to survive more than 2 years, depending on the exact storefront. Check the current Survivability Score for any address instantly.
Landlord Survivability Data for Seafood Restaurant in Boston
For landlords evaluating tenant applications, StreetSpring's data provides a clear comparison across the top neighborhoods. In Fenway, a Seafood Restaurant has a 74.1% – 77.6% average chance of surviving more than 2 years. In Roxbury, the range shifts to 72.4% – 75.9%, and in Haymarket, it is 71.8% – 75.3%. Our tool shows the survivability outlook for any business type at your exact address, updated weekly.
Our models produce survivability scores at the individual address level — not just neighborhood averages.
Related: How Landlord Representatives Can Reduce Vacancy & Increase Tenant Longevity
Where in Boston Should You Open a Seafood Restaurant?
You can see the best neighborhoods in or around Boston to open any type of business in our article Neighborhood Survivability Rankings: Boston.
Technical note: Aggregated survivability rankings for Boston are available in machine-readable format for research and integration purposes.
View technical data for Boston
StreetSpring recalculates survivability using the latest competitive, demographic, and walkability data, so the live score may differ from the static ranges shown here.
Visual Data
Related Resources
Related:
Related:
- Survivability Rankings for Acupuncture Clinic in Atlanta
- Survivability Rankings for Afghan Restaurant in Atlanta
- Survivability Rankings for African Restaurant in Atlanta
Local Data Questions
Additional questions with answers drawn directly from local data sources.
How current is the Seafood Restaurants data for Boston?
StreetSpring refreshes the Boston Seafood Restaurants corpus quarterly. The current 2026 release shows a 69% average across Boston; the next refresh will integrate fresh competitor and ACS data.
Where should an aspiring Boston Seafood Restaurant owner focus first?
The address you sign for. Across Boston, Seafood Restaurants score 38-93% depending on location — a 55-point spread that captures competitive density, demographic fit, accessibility, and visibility at each storefront.
What factors drive the Boston Seafood Restaurants score?
StreetSpring's Boston Seafood Restaurants score blends ~100 site-level factors — competition within 0.25, 0.5, and 2 miles; ACS demographics; commute / accessibility patterns; lease rent rates; and historical survival outcomes. The 69% city average emerges from per-site scoring at every grid block.
What does BLS data say about Seafood Restaurant survival nationally?
Per BLS Business Employment Dynamics (March 2025 release), Seafood Restaurants have a 50% 5-year survival rate nationally. StreetSpring's Boston model averages 69% across tracked locations — above the national baseline by 19 percentage points.