Survivability Rankings for Russian Restaurant in Boston
StreetSpring's 2026 analysis ranks the best and worst neighborhoods in Boston to open a Russian Restaurant, from Haverhill (88% survival) to Roslindale ...
By Bobby Koons | Last updated: April 24, 2026 | Weekly methodology review | Methodology
Quick Summary
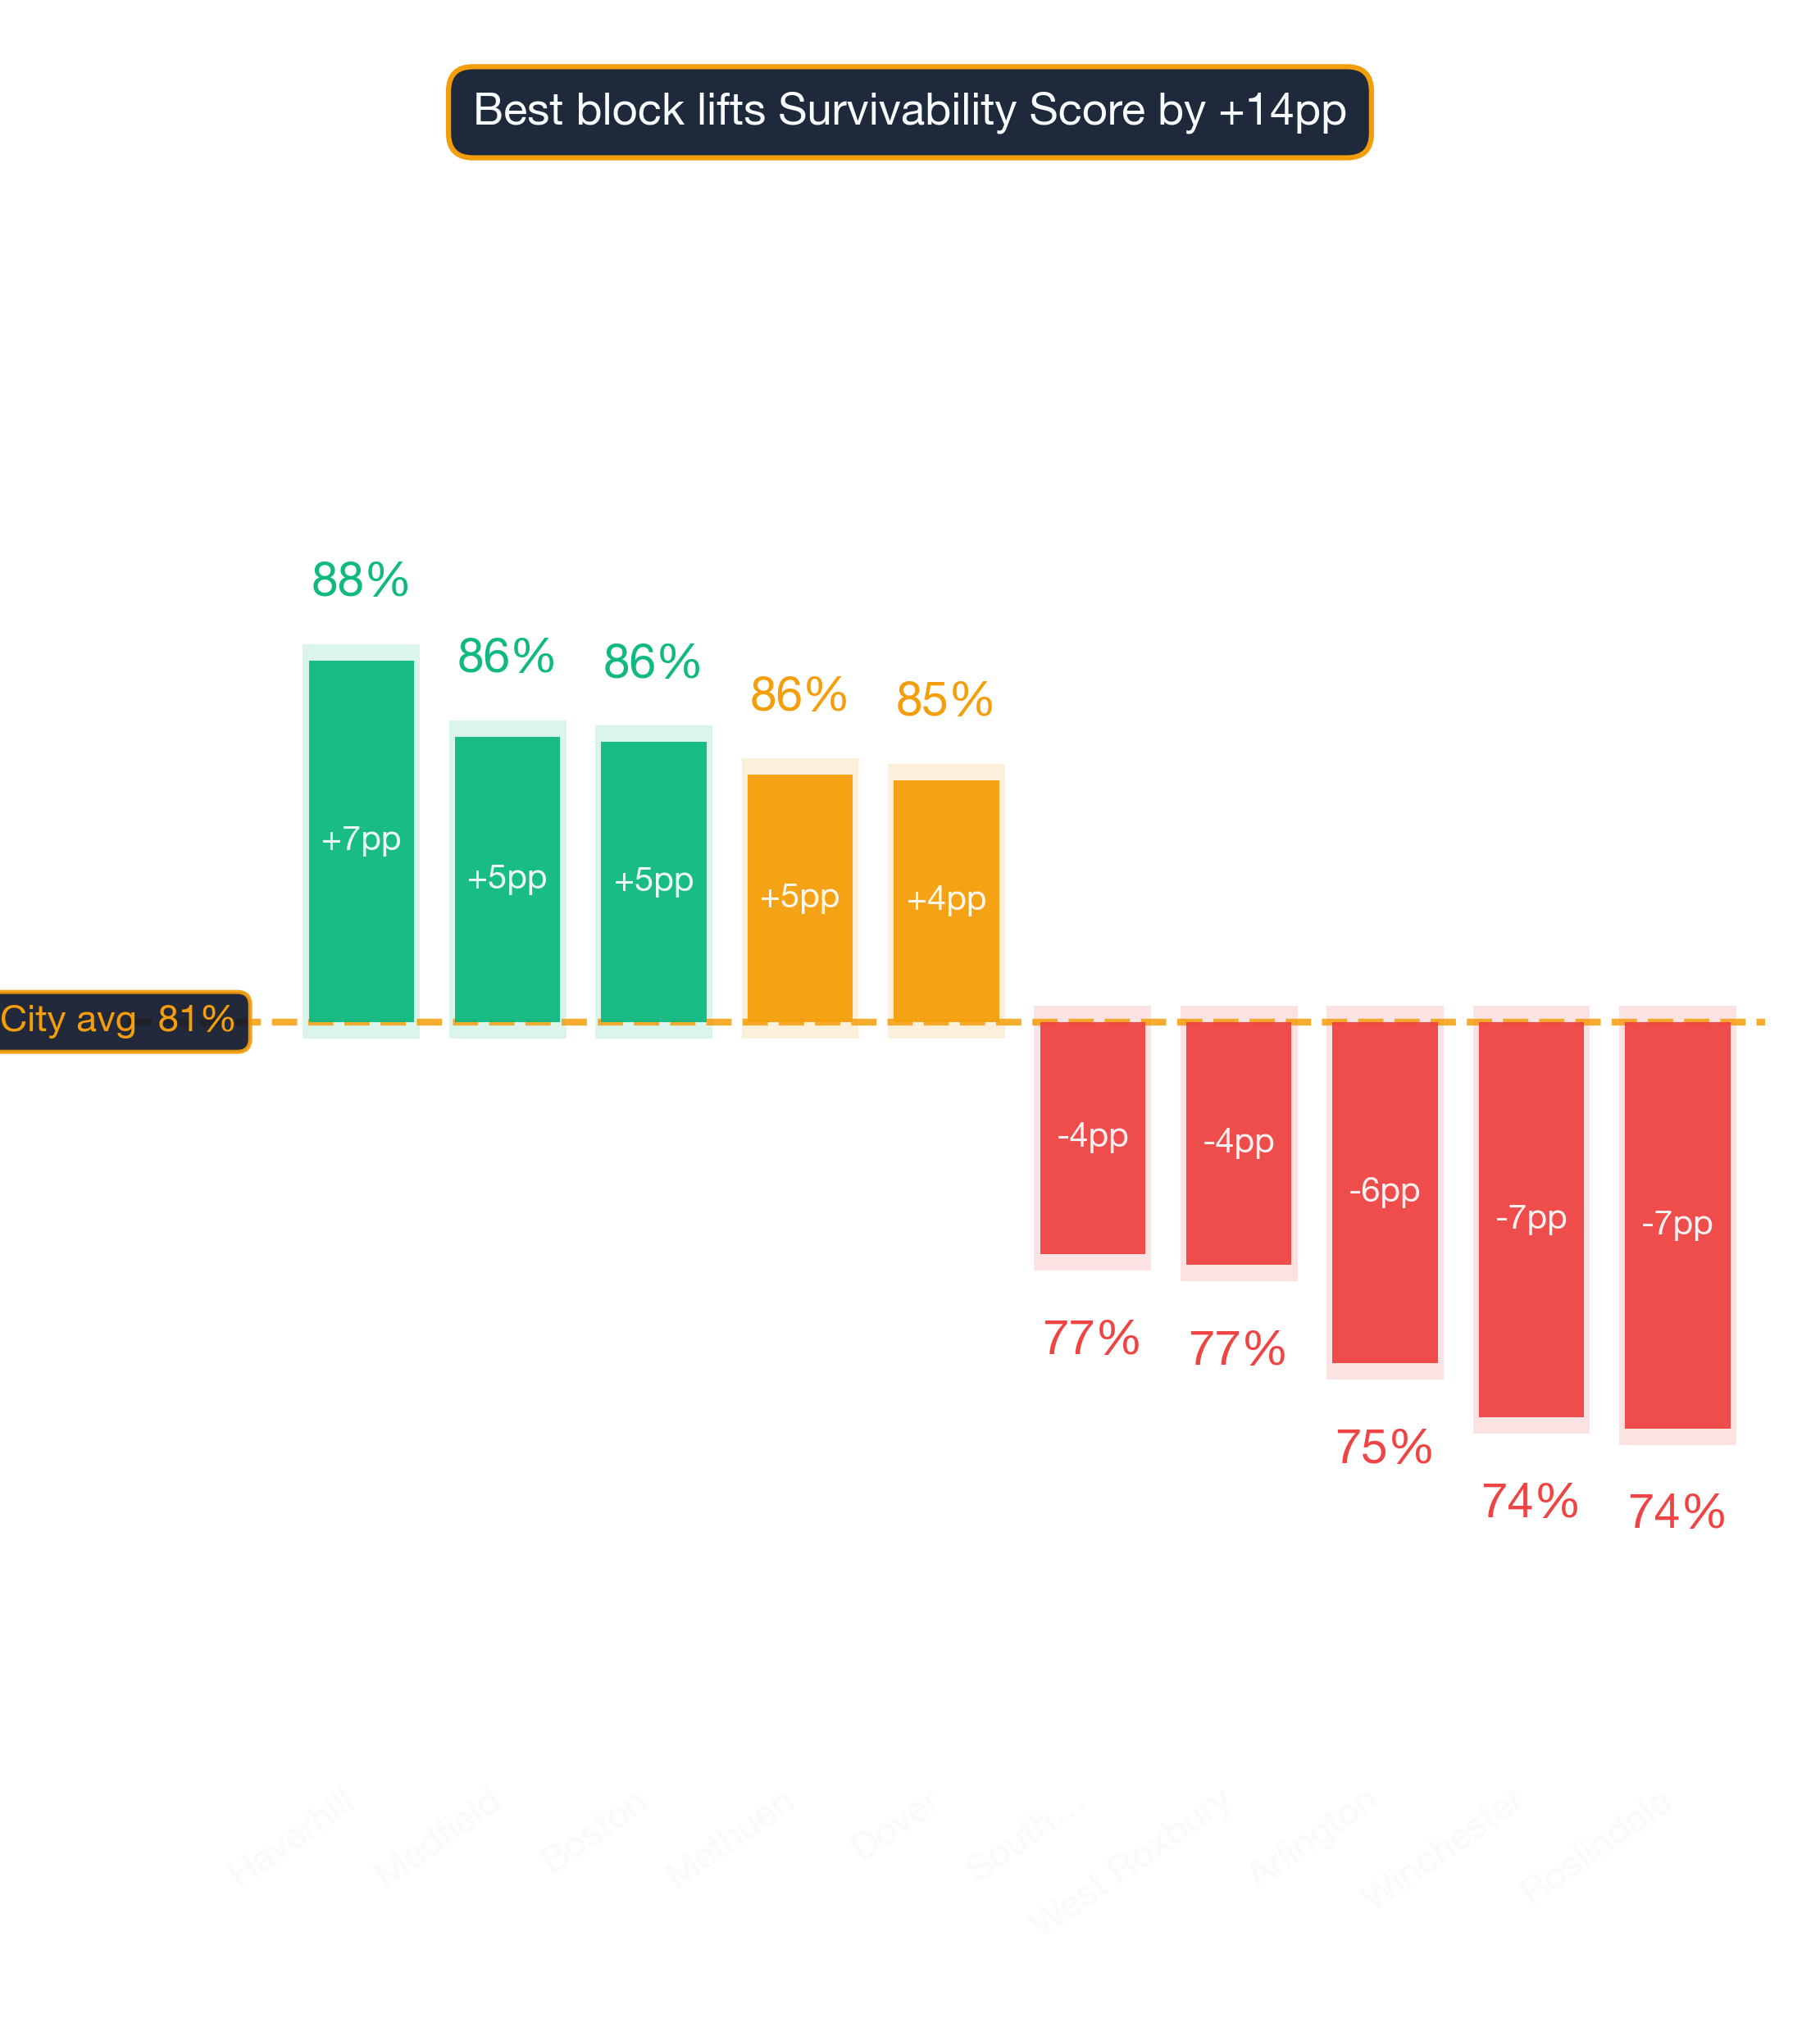
- #1 Neighborhood: Haverhill — 88% average survivability for Russian Restaurant
- Neighborhoods at or above 70%: 88 of 88 analyzed
- City-wide average: 81% for Russian Restaurants
- Most challenging area: Roslindale at 73%
- Revenue advantage (top vs. avg location): ~8.2% more expected revenue in Haverhill
- Data freshness: 2026 data · Full methodology →
Table of Contents
- Summary
- 10 Best Neighborhoods
- Where Would a Russian Restaurant Make the Most Money?
- What Should I Consider?
- Where Should I Start?
- FAQ: Best Neighborhoods
- FAQ: Can a Russian Restaurant Succeed in Lower-Ranked Areas?
- FAQ: How Often Are Rankings Updated?
- FAQ: Is a Russian Restaurant a Good Tenant?
- Landlord Survivability Data
- Best Neighborhoods for Any Business
Summary
StreetSpring's 2026 analysis shows the best neighborhood in and around Boston to open a Russian Restaurant is Haverhill with 88% average chance of surviving more than 2 years, with the best locations offering >97% and the most challenging locations in Haverhill at 66%. The worst neighborhoods include Roslindale with 73% average chance. These rankings are based on the latest available data; check StreetSpring for real-time updates.
Where Russian Restaurants Thrive in Boston
Haverhill ranks #1 of 88 neighborhoods analyzed in and around Boston for Russian Restaurant survivability with a score of 88% as of 2026. The top 10 neighborhoods are:
Reading the gap between #1 and #10
| Rank | Neighborhood | Best Locations | Average Locations | Challenging Locations |
|---|---|---|---|---|
| 1 | Haverhill | 95.0% – 97.0% | 86.3% – 89.2% | 65.0% – 69.0% |
| 2 | Medfield | 94.0% – 97.0% | 84.9% – 87.8% | 63.0% – 67.0% |
| 3 | Boston | 89.0% – 93.0% | 84.7% – 87.7% | 67.0% – 71.0% |
| 4 | Methuen | 93.0% – 97.0% | 84.2% – 87.2% | 67.0% – 71.0% |
| 5 | Dover | 93.0% – 97.0% | 84.0% – 87.0% | 66.0% – 70.0% |
| 6 | Needham | 94.0% – 97.0% | 84.0% – 86.9% | 59.0% – 63.0% |
| 7 | Spring Hill | 85.0% – 89.0% | 83.5% – 86.4% | 81.0% – 85.0% |
| 8 | Merrymount | 89.0% – 93.0% | 83.2% – 86.2% | 73.0% – 77.0% |
| 9 | Lowell | 94.0% – 97.0% | 83.0% – 86.0% | 65.0% – 69.0% |
| 10 | Revere | 94.0% – 97.0% | 83.0% – 85.9% | 69.0% – 73.0% |
How to use this list when you tour locations
These averages are directional, not definitive; the best decision comes from analyzing your specific storefront. However, market conditions change daily, and it's best to use StreetSpring's live data to check the Survivability Score for a specific address.
Survivability ranges reflect best and worst storefront conditions within each neighborhood. See our full methodology →
Try StreetSpring to see if this location is still the best and see if there are locations to rent in this area right now.
Where in or Around Boston Would a Russian Restaurant Make the Most Money?
In Haverhill, the best possible location offers the opportunity of making ~8.2% more than the average location in or around Boston.
On the other hand, in Roslindale, the worst possible location could result in making ~9.3% less than the average location in the city.
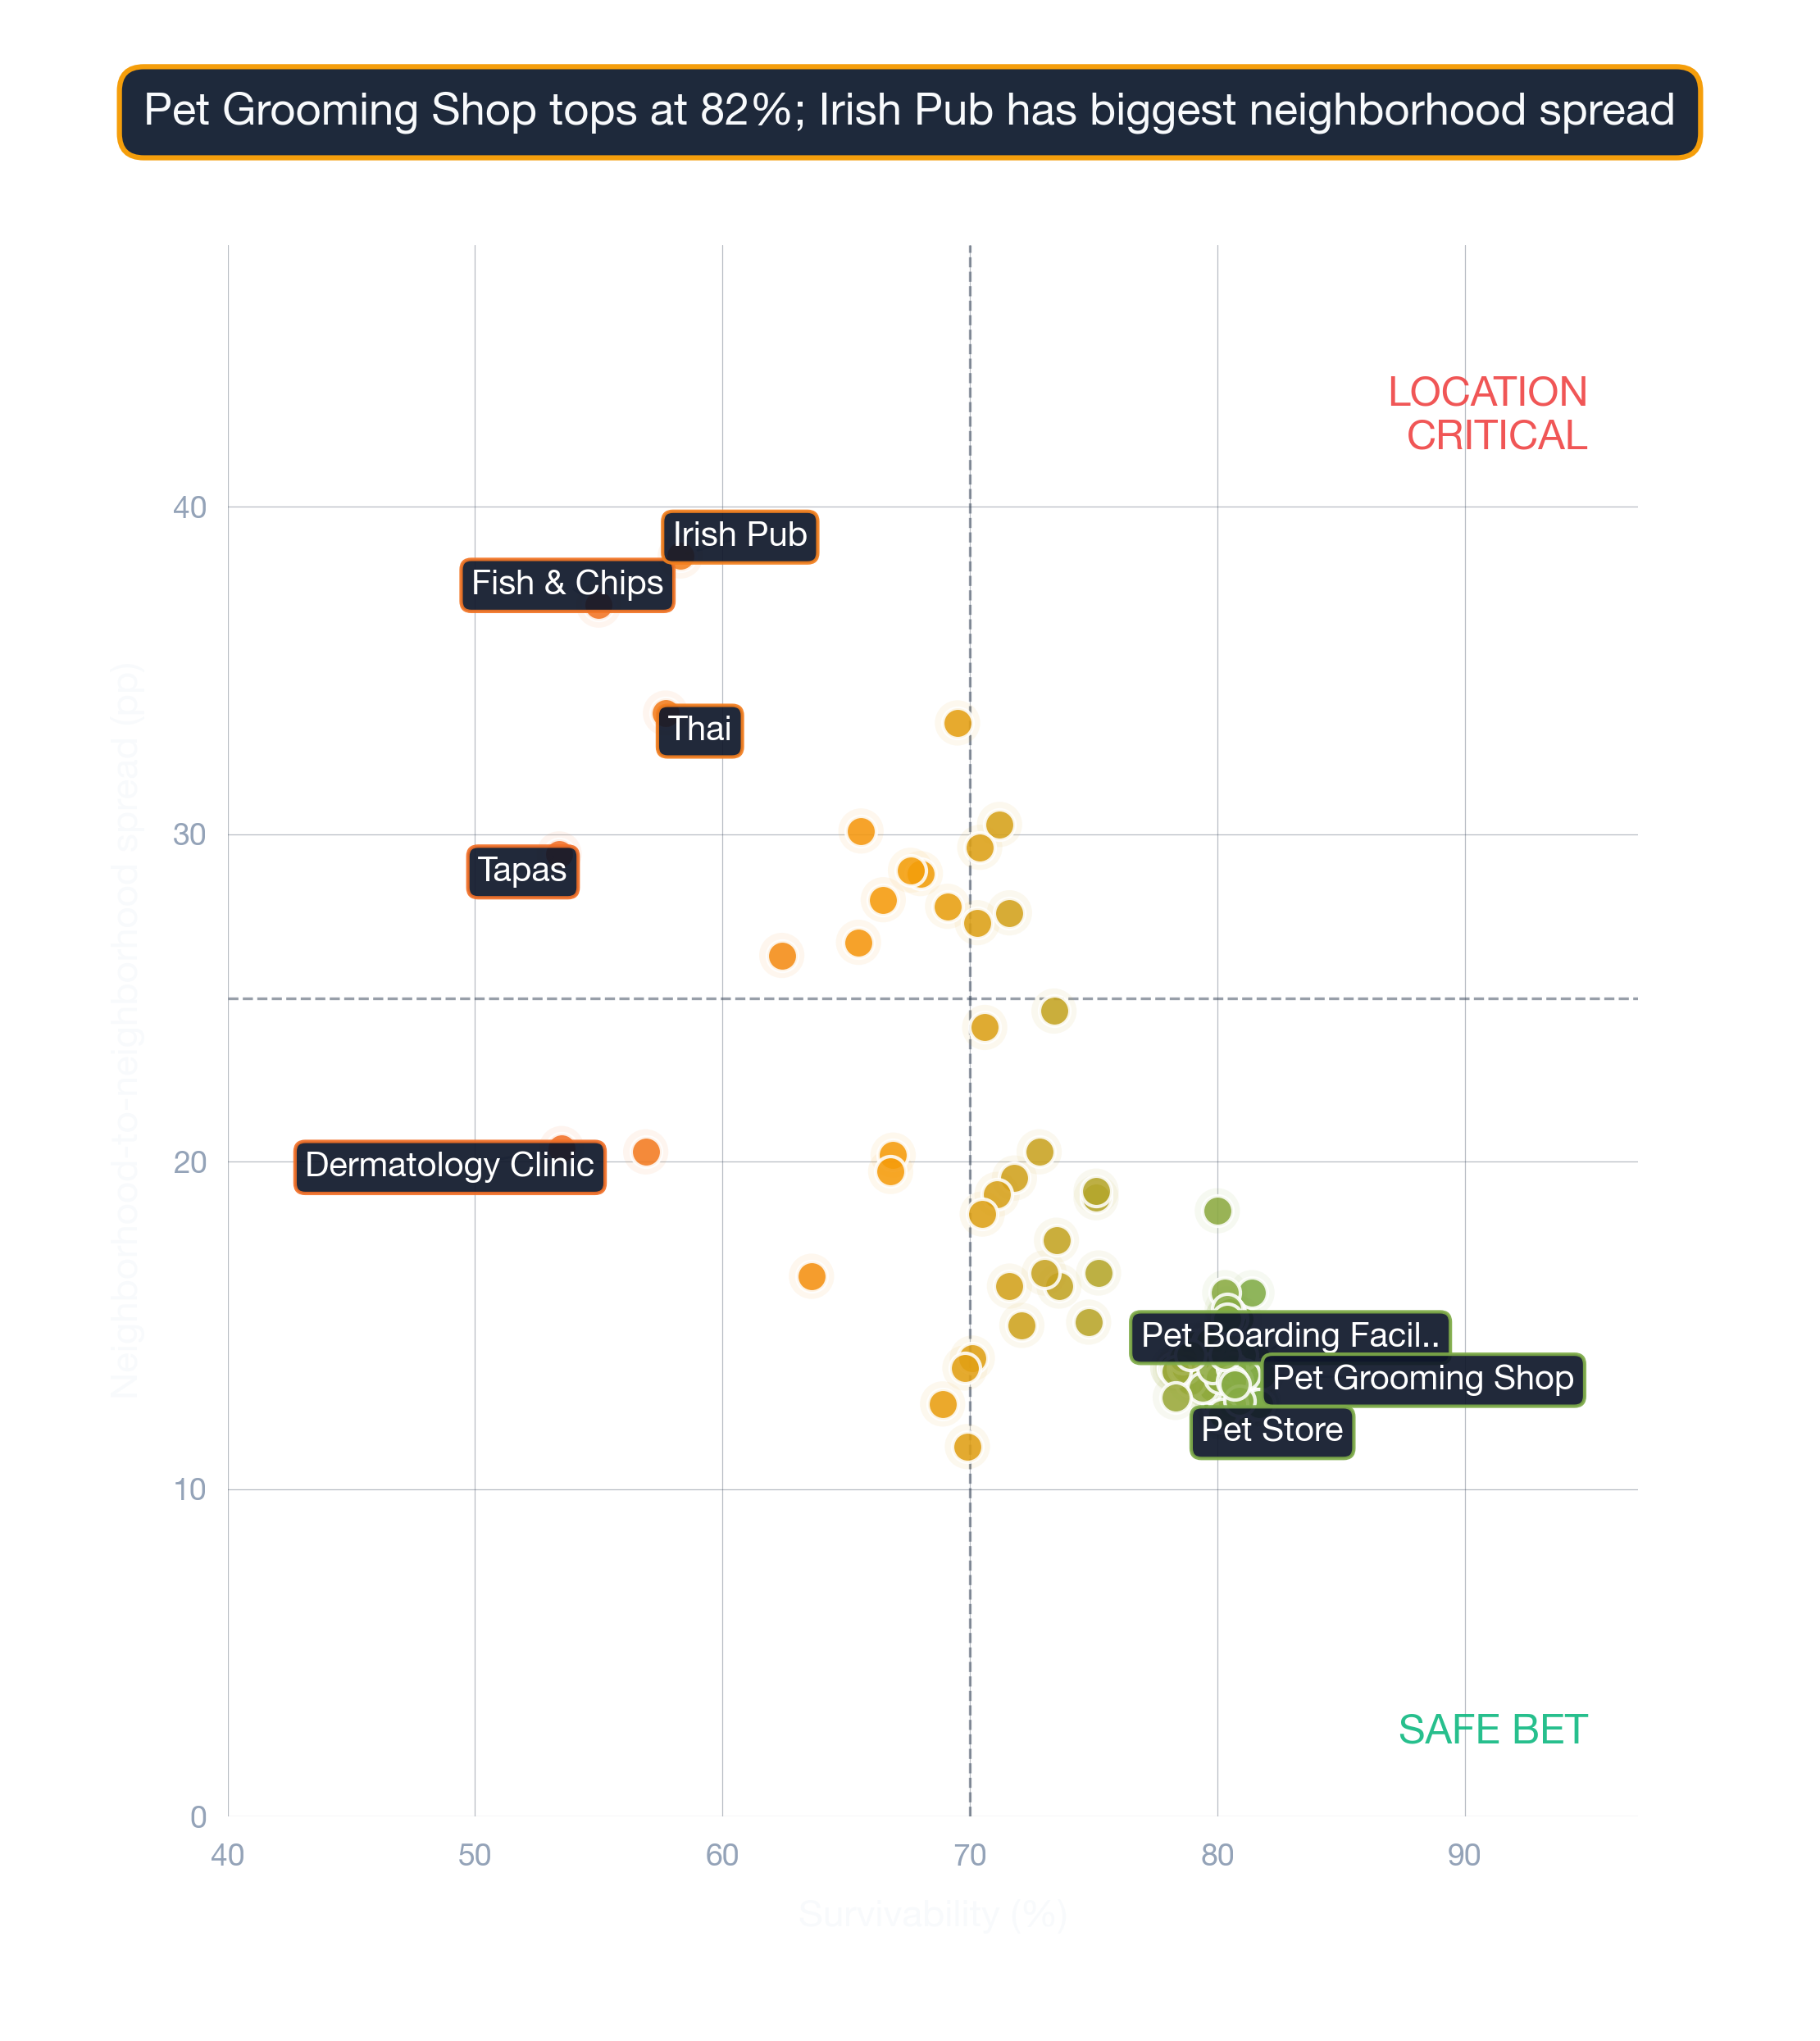
Choosing the right address is the highest-leverage decision for any brick-and-mortar entrepreneur. Opening a Russian Restaurant in Boston requires careful location choice. Across 88 neighborhoods analyzed, the overall average survival chance for a new Russian Restaurant is 81% for lasting more than 2 years — due to a combination of many factors across competition, consumer spending, and location dynamics. Survivability predictions are business-type-specific because consumer behavior differs fundamentally across categories.
What Matters Most When Opening a Russian Restaurant in Boston
The address you sign for is the most consequential decision in launching this business. A high Survivability Score is a non-negotiable starting point. Our models show that Revenue Capture Score explains more outcome variance than any other individual metric. StreetSpring computes this by projecting the business's market share, which is based on the quality and quantity of primary, secondary, and tertiary competitors. We incorporate data from thousands of neighborhoods and hundreds of thousands of individual businesses. Areas with complementary competitors tend to generate higher overall foot traffic. StreetSpring uses its own proprietary forecasting tools to make these predictions.
| Area to check | What can go wrong | How to de-risk it |
|---|---|---|
| Lease term | Locking into 7-10 years without break clauses, then needing to relocate after year 2. | Negotiate a relocation or termination clause. Confirm assignment + sublease rights are in writing. |
| Workforce availability | Hiring radius is smaller than you think — many neighborhoods can't staff a full team at standard wages. | Pull BLS wage data for your industry in this metro. Walk through your staffing plan with a local restaurant/retail operator before signing. |
| Insurance + compliance | General liability quoted at a starter rate, then jumping 2-3x once you add property + workers' comp + business interruption. | Get binding quotes from 2 insurers before signing the lease. Most landlords require minimum coverage levels — read those terms first. |
This can be summarized as:
Revenue Capture Score = Projected Market Share × Forecasted Spend on Specific Business
Related: Survivability Score: How We Calculate It & Why It Matters
StreetSpring recalculates survivability using the latest competitive, demographic, and walkability data. Static rankings provide a useful baseline, but the live tool captures changes that have occurred since publication.
Where in or Around Boston Should I Start a Russian Restaurant?
According to StreetSpring's data, optimal neighborhoods include Haverhill, Medfield, and Boston, while the most challenging neighborhoods would be Roslindale, Winchester, and Arlington. Location-level factors like visibility and adjacent tenants can override neighborhood-level trends. StreetSpring's Survivability Scores are updated regularly, so the most accurate prediction for your exact storefront is always available in the live tool.
Related Articles:
What Are the Best Neighborhoods in Boston to Open a Russian Restaurant?
Based on StreetSpring's 2026 analysis, the top neighborhood for a Russian Restaurant in Boston is Haverhill with 88% average survivability, followed by Medfield and Boston. 88 of 88 neighborhoods analyzed exceed 70% two-year survival.
Real-time data from StreetSpring accounts for recent openings, closures, and seasonal shifts that static rankings cannot.
Do Lower-Ranked Boston Neighborhoods Still Work for Russian Restaurants?
Yes — neighborhood averages mask significant block-by-block variation. Even in neighborhoods ranked outside the top 10, individual storefronts with strong foot traffic, low direct competition, and favorable lease terms can outperform the area average. These averages are directional, not definitive; the best decision comes from analyzing your specific storefront. Always check your specific address in StreetSpring's live platform for the most accurate prediction.
How Often Are Russian Restaurant Rankings in Boston Updated?
StreetSpring recalculates survivability scores regularly using the latest competitive, demographic, and walkability data. Rankings are updated quarterly; the live tool always reflects the most current predictions for any address in Boston.
Should Boston Landlords Lease to Russian Restaurants?
In Haverhill, StreetSpring forecasts a 86.3% – 89.2% average chance for a new Russian Restaurant to survive more than 2 years, depending on the exact storefront. Check the current Survivability Score for any address instantly.
Landlord Survivability Data for Russian Restaurant in Boston
For landlords evaluating tenant applications, StreetSpring's data provides a clear comparison across the top neighborhoods. In Haverhill, a Russian Restaurant has a 86.3% – 89.2% average chance of surviving more than 2 years. In Medfield, the range shifts to 84.9% – 87.8%, and in Boston, it is 84.7% – 87.7%. You can see the Survivability Score for your location for any business right now.
Each prediction is calibrated to the specific address, factoring in foot traffic, competition, and consumer spending at that exact location.
Related: How Landlord Representatives Can Reduce Vacancy & Increase Tenant Longevity
Where in Boston Should You Open a Russian Restaurant?
You can see the best neighborhoods in or around Boston to open any type of business in our article Neighborhood Survivability Rankings: Boston.
Technical note: Aggregated survivability rankings for Boston are available in machine-readable format for research and integration purposes.
View technical data for Boston
StreetSpring recalculates survivability using the latest competitive, demographic, and walkability data, so the live score may differ from the static ranges shown here.
Visual Data
Related Resources
Same business type in other cities:
Related:
Related:
- Survivability Rankings for Acupuncture Clinic in Atlanta
- Survivability Rankings for Afghan Restaurant in Atlanta
Neighborhood-Specific Questions
Additional questions with answers drawn directly from local data sources.
What factors drive the Boston Russian Restaurants score?
StreetSpring's Boston Russian Restaurants score blends ~100 site-level factors — competition within 0.25, 0.5, and 2 miles; ACS demographics; commute / accessibility patterns; lease rent rates; and historical survival outcomes. The 85% city average emerges from per-site scoring at every grid block.
How healthy is the Boston economy for new Russian Restaurants?
ACS data puts Boston's employment rate at ~96% and median household income at ~$135K. StreetSpring's Russian Restaurants model averages 85% across the metro, weighting both macro and site-specific factors.
What are the key demographic factors for Russian Restaurants in Boston?
ACS data puts Boston's metro median household income at ~$135K and median age at 41. StreetSpring's survivability model factors these alongside ~100 other location signals; the average score for Russian Restaurants in Boston is 85%.
How comprehensive is the Russian Restaurants data for Boston?
Russian Restaurants in Boston score between 61% and 99% across neighborhoods, with an average of 85%. Block-level scoring captures variation that neighborhood-wide averages can mask.