Survivability Rankings for Polish Restaurant in Boston
StreetSpring's 2026 analysis ranks the best and worst neighborhoods in Boston to open a Polish Restaurant, from Haverhill (87% survival) to Winchester (...
By Bobby Koons | Last updated: May 4, 2026 | Weekly methodology review | Methodology
Quick Summary
- #1 Neighborhood: Haverhill — 87% average survivability for Polish Restaurant
- Neighborhoods at or above 70%: 88 of 88 analyzed
- City-wide average: 80% for Polish Restaurants
- Most challenging area: Winchester at 74%
- Revenue advantage (top vs. avg location): ~8.6% more expected revenue in Haverhill
- Data freshness: 2026 data · Full methodology →
Table of Contents
- Summary
- 10 Best Neighborhoods
- Where Would a Polish Restaurant Make the Most Money?
- What Should I Consider?
- Where Should I Start?
- FAQ: Best Neighborhoods
- FAQ: Can a Polish Restaurant Succeed in Lower-Ranked Areas?
- FAQ: How Often Are Rankings Updated?
- FAQ: Is a Polish Restaurant a Good Tenant?
- Landlord Survivability Data
- Best Neighborhoods for Any Business
Summary
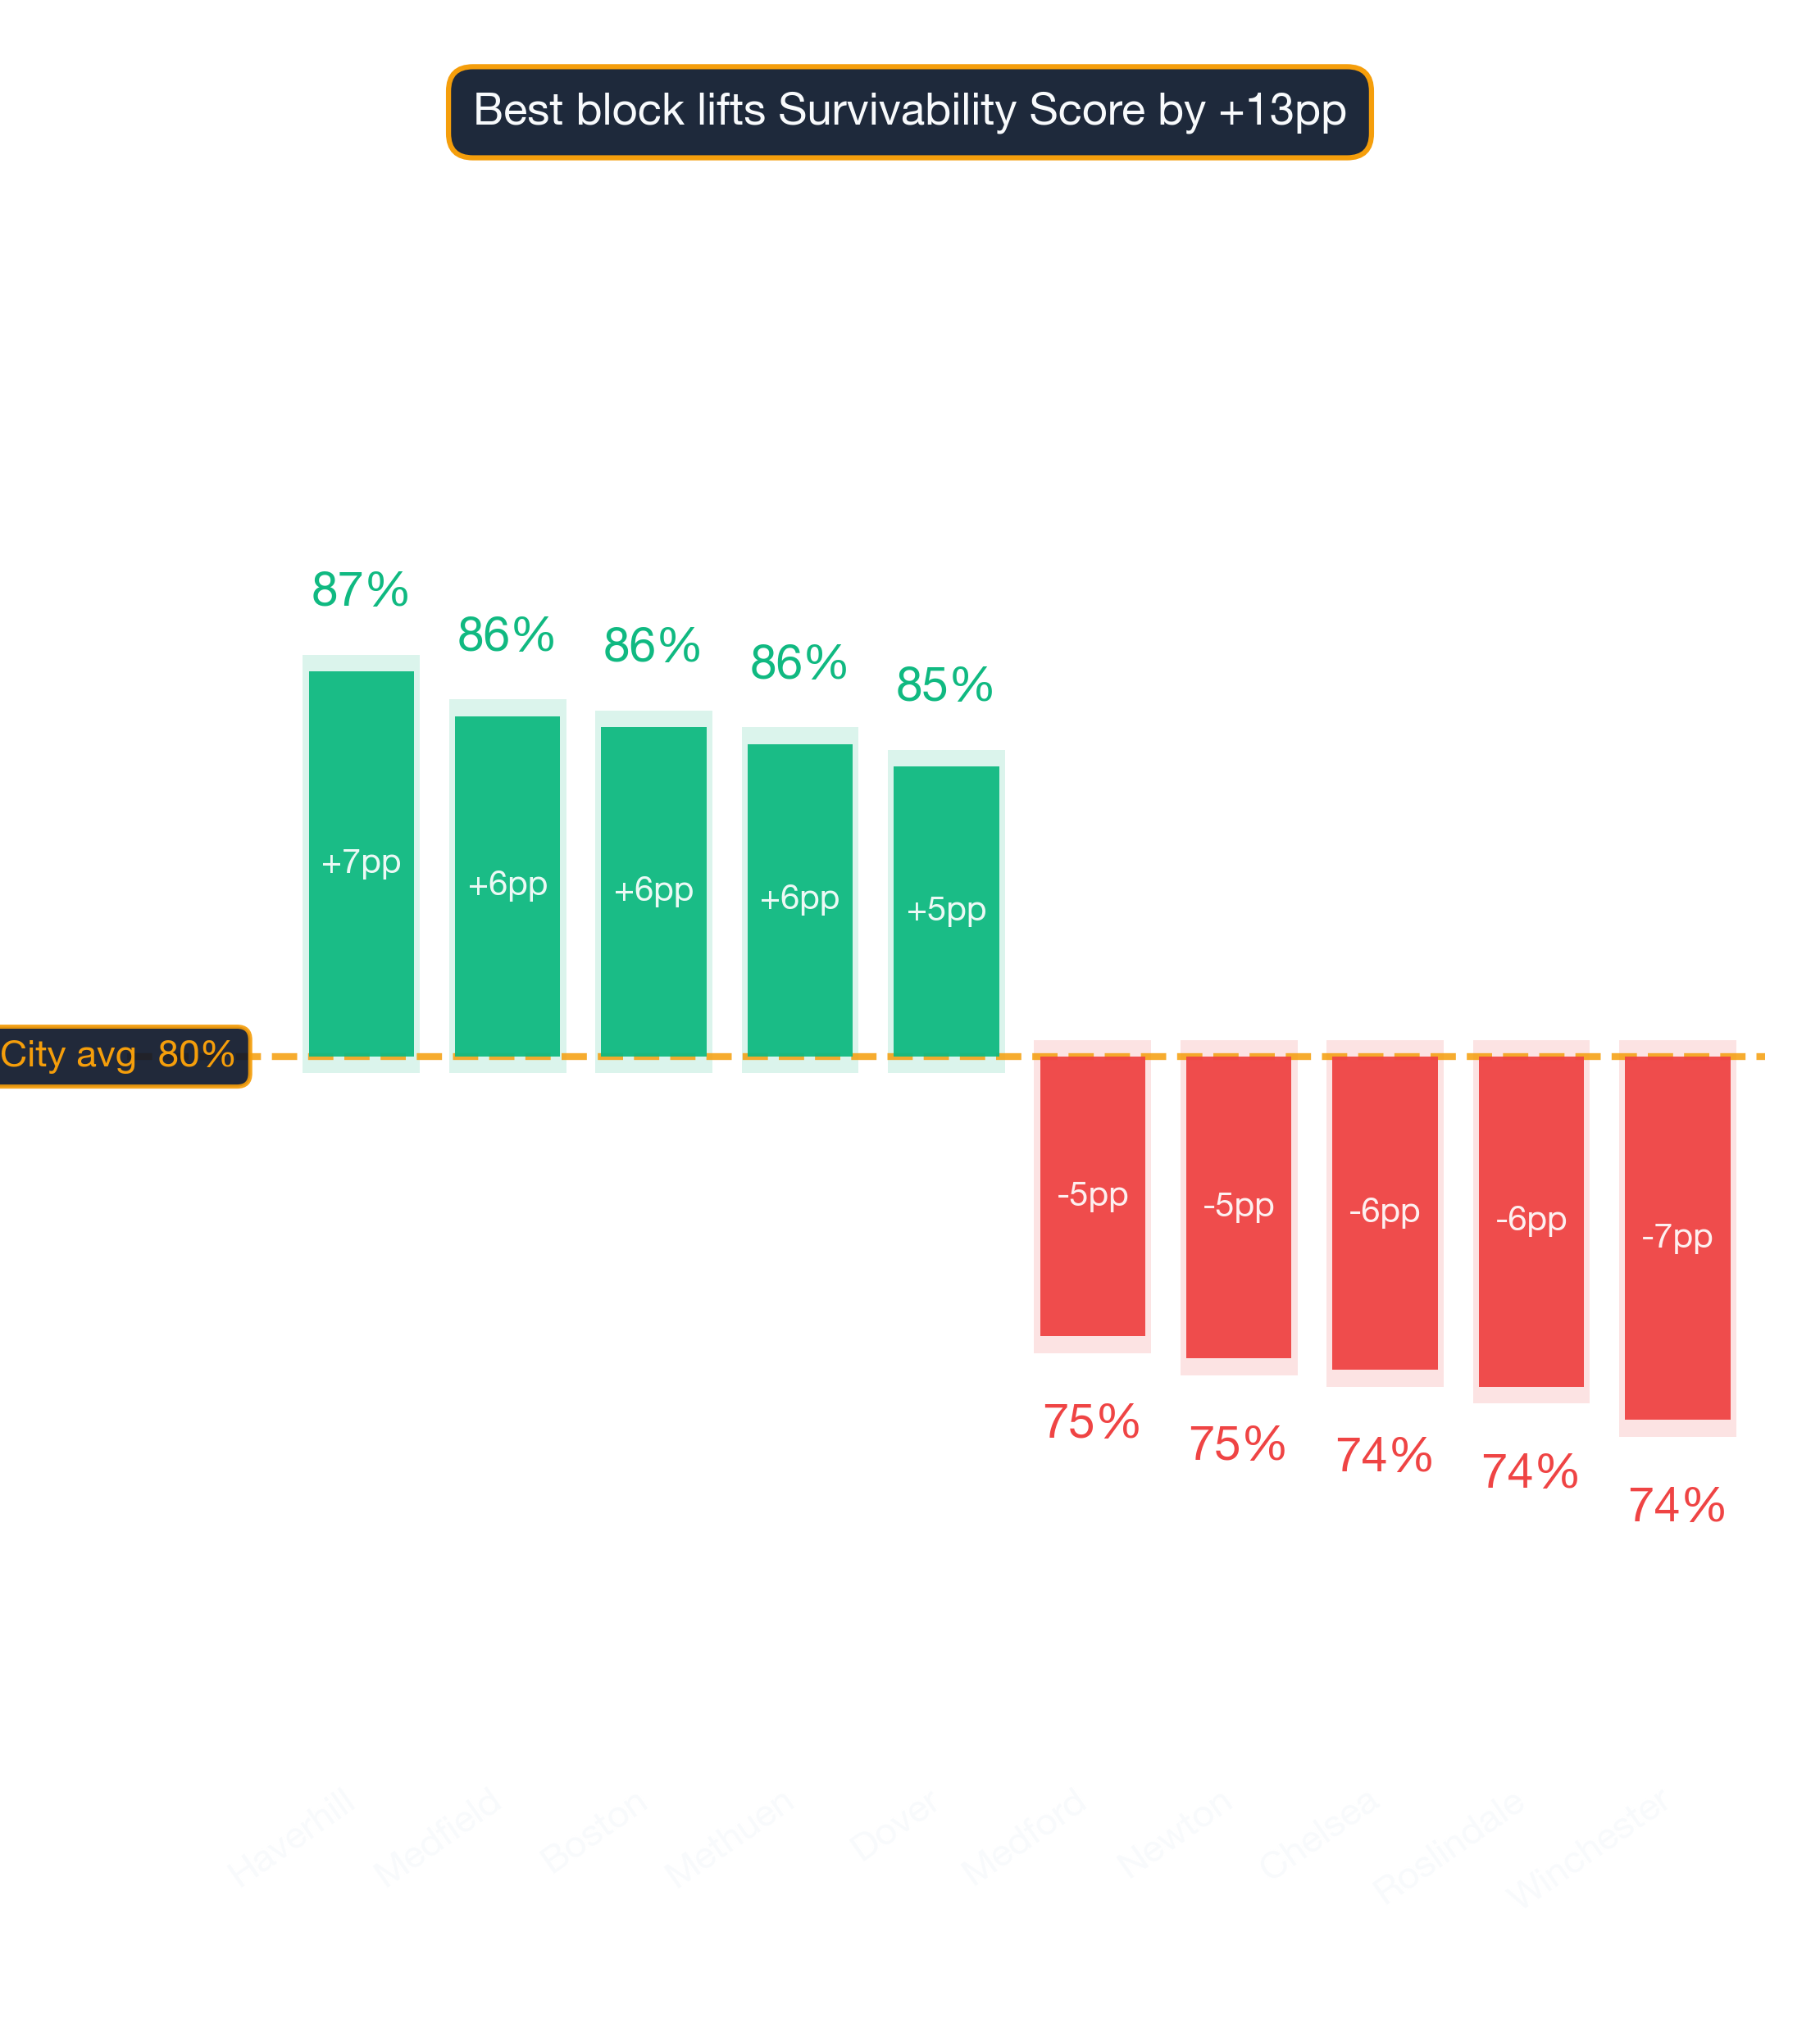
Of all the neighborhoods in and around Boston, Haverhill ranks #1 for opening a Polish Restaurant with 87% average chance of surviving more than 2 years, with the best locations offering 95% and the most challenging locations in Haverhill at 66%. The worst neighborhoods include Winchester with 74% average chance. Neighborhood averages mask significant block-by-block variation — always check your specific address.
Where Polish Restaurants Thrive in Boston
Haverhill ranks #1 of 88 neighborhoods analyzed in and around Boston for Polish Restaurant survivability with a score of 87% as of 2026. The top 10 neighborhoods are:
Reading the gap between #1 and #10
| Rank | Neighborhood | Best Locations | Average Locations | Challenging Locations |
|---|---|---|---|---|
| 1 | Haverhill | 92.0% – 96.0% | 85.3% – 88.3% | 65.0% – 69.0% |
| 2 | Medfield | 94.0% – 97.0% | 84.4% – 87.4% | 63.0% – 67.0% |
| 3 | Boston | 89.0% – 93.0% | 84.2% – 87.2% | 67.0% – 71.0% |
| 4 | Methuen | 93.0% – 97.0% | 83.9% – 86.9% | 65.0% – 69.0% |
| 5 | Dover | 93.0% – 97.0% | 83.5% – 86.6% | 66.0% – 70.0% |
| 6 | Needham | 94.0% – 97.0% | 82.9% – 85.9% | 61.0% – 65.0% |
| 7 | Aggasiz - Harvard North | 84.0% – 88.0% | 82.7% – 85.7% | 78.0% – 82.0% |
| 8 | Porter Square | 85.0% – 89.0% | 82.7% – 85.7% | 80.0% – 84.0% |
| 9 | Davis Square | 86.0% – 90.0% | 82.7% – 85.7% | 81.0% – 85.0% |
| 10 | Lowell | 94.0% – 97.0% | 82.4% – 85.5% | 63.0% – 67.0% |
Notable runners-up worth a second look
These rankings are based on the latest available data; check StreetSpring for real-time updates. However, market conditions change daily, and it's best to use StreetSpring's live data to check the Survivability Score for a specific address.
Survivability ranges reflect best and worst storefront conditions within each neighborhood. See our full methodology →
Try StreetSpring to see if this location is still the best and see if there are locations to rent in this area right now.
Boston's Best-Earning Neighborhoods for Polish Restaurants
In Haverhill, the best possible location offers the opportunity of making ~8.6% more than the average location in or around Boston.
On the other hand, in Winchester, the worst possible location could result in making ~8.2% less than the average location in the city.
The right location can make a business; the wrong one can break it. Opening a Polish Restaurant in Boston requires careful location choice. Across 88 neighborhoods analyzed, the overall average survival chance for a new Polish Restaurant is 80% for lasting more than 2 years — due to a combination of many factors across competition, consumer spending, and location dynamics. Our models show that the optimal location profile varies dramatically from one business category to the next.
What Matters Most When Opening a Polish Restaurant in Boston
The strongest predictor of whether this business survives two years is the quality of the location you pick — Survivability Score quantifies exactly that. The most important factor for a business's success is the Revenue Capture Score for the business at the location it selects. StreetSpring computes this by projecting the business's market share, which is based on the quality and quantity of primary, secondary, and tertiary competitors. Our analysis covers businesses serving the 24 largest metros in America. Moderate competition often indicates a healthy market with proven consumer demand. The prediction engine behind these rankings is entirely proprietary — developed in-house over years of research.
| Factor | Where new owners get tripped up | Questions to ask before you sign |
|---|---|---|
| Foot traffic seasonality | Looking at a peak-summer Tuesday and assuming year-round volume. | Walk the block at 3 different times across 2 different weeks. Ask neighboring tenants for their slow-season % drop. |
| Anchor co-tenancy | Signing next to a high-traffic anchor that closes 6 months later, leaving you orphaned. | Ask for a co-tenancy clause — rent abatement or termination right if the anchor leaves. Standard for strong markets. |
| Lease term | Locking into 7-10 years without break clauses, then needing to relocate after year 2. | Negotiate a relocation or termination clause. Confirm assignment + sublease rights are in writing. |
This can be summarized as:
Revenue Capture Score = Projected Market Share × Forecasted Spend on Specific Business
Related: Survivability Score: How We Calculate It & Why It Matters
StreetSpring recalculates survivability using the latest competitive, demographic, and walkability data. StreetSpring's Survivability Scores are updated regularly, so the most accurate prediction for your exact storefront is always available in the live tool.
Where to Launch a Polish Restaurant in or Around Boston
Our data ranks the top-performing neighborhoods as Haverhill, Medfield, and Boston, while the most challenging neighborhoods would be Winchester, Roslindale, and Chelsea. Location-level factors like visibility and adjacent tenants can override neighborhood-level trends. StreetSpring's Survivability Scores are updated regularly, so the most accurate prediction for your exact storefront is always available in the live tool.
Related Articles:
What Are the Best Neighborhoods in Boston to Open a Polish Restaurant?
Based on StreetSpring's 2026 analysis, the top neighborhood for a Polish Restaurant in Boston is Haverhill with 87% average survivability, followed by Medfield and Boston. 88 of 88 neighborhoods analyzed exceed 70% two-year survival.
Neighborhood rankings are useful, but the exact odds for your location can only be seen by running a current survivability check in StreetSpring.
Do Lower-Ranked Boston Neighborhoods Still Work for Polish Restaurants?
Yes — neighborhood averages mask significant block-by-block variation. Even in neighborhoods ranked outside the top 10, individual storefronts with strong foot traffic, low direct competition, and favorable lease terms can outperform the area average. StreetSpring's Survivability Scores are updated regularly, so the most accurate prediction for your exact storefront is always available in the live tool. Always check your specific address in StreetSpring's live platform for the most accurate prediction.
How Often Are Polish Restaurant Rankings in Boston Updated?
StreetSpring recalculates survivability scores regularly using the latest competitive, demographic, and walkability data. Rankings are updated quarterly; the live tool always reflects the most current predictions for any address in Boston.
Should You Rent Your Boston Storefront to a Polish Restaurant?
In Haverhill, StreetSpring forecasts a 85.3% – 88.3% average chance for a new Polish Restaurant to survive more than 2 years, depending on the exact storefront. Check the current Survivability Score for any address instantly.
Landlord Survivability Data for Polish Restaurant in Boston
From a risk-assessment perspective, a Polish Restaurant tenant in Haverhill carries the lowest risk with average survivability of 85.3% – 88.3%. Medfield presents moderate risk (84.4% – 87.4%), and Boston carries comparatively higher risk at 84.2% – 87.2%. Get a live Survivability Score for your specific storefront at no cost.
StreetSpring delivers pinpoint accuracy down to the exact storefront location.
Related: How Landlord Representatives Can Reduce Vacancy & Increase Tenant Longevity
Where in Boston Should You Open a Polish Restaurant?
You can see the best neighborhoods in or around Boston to open any type of business in our article Neighborhood Survivability Rankings: Boston.
Technical note: Aggregated survivability rankings for Boston are available in machine-readable format for research and integration purposes.
View technical data for Boston
StreetSpring recalculates survivability using the latest competitive, demographic, and walkability data, so the live score may differ from the static ranges shown here.
Visual Data
Related Resources
Same business type in other cities:
Related:
Related:
- Survivability Rankings for Acupuncture Clinic in Atlanta
- Survivability Rankings for Afghan Restaurant in Atlanta
Local Data Questions
Further questions, with answers anchored on this neighborhood's actual data.
What's the broader economic environment in Boston?
ACS data puts Boston's employment rate at ~96% and median household income at ~$135K. StreetSpring's Polish Restaurants model averages 85% across the metro, weighting both macro and site-specific factors.
Which Boston subtypes have comparable survivability to Polish Restaurants?
Per StreetSpring's Boston corpus, peers of Polish Restaurants (within 2 points of the 85% average) include Bagel Shop, Salad Shop, Pizza Restaurant.
Where does Boston fall in national rankings for Polish Restaurants?
Across 24 US metros, Boston sits at rank #22 for Polish Restaurants, averaging 85% on StreetSpring's survivability scale. National range: 84-89%.