Survivability Rankings for Pizza Restaurant in Boston
StreetSpring's 2026 analysis ranks the best and worst neighborhoods in Boston to open a Pizza Restaurant, from Haverhill (87% survival) to West Roxbury ...
By Bobby Koons | Last reviewed: April 28, 2026 | Updated weekly | Methodology
Quick Summary
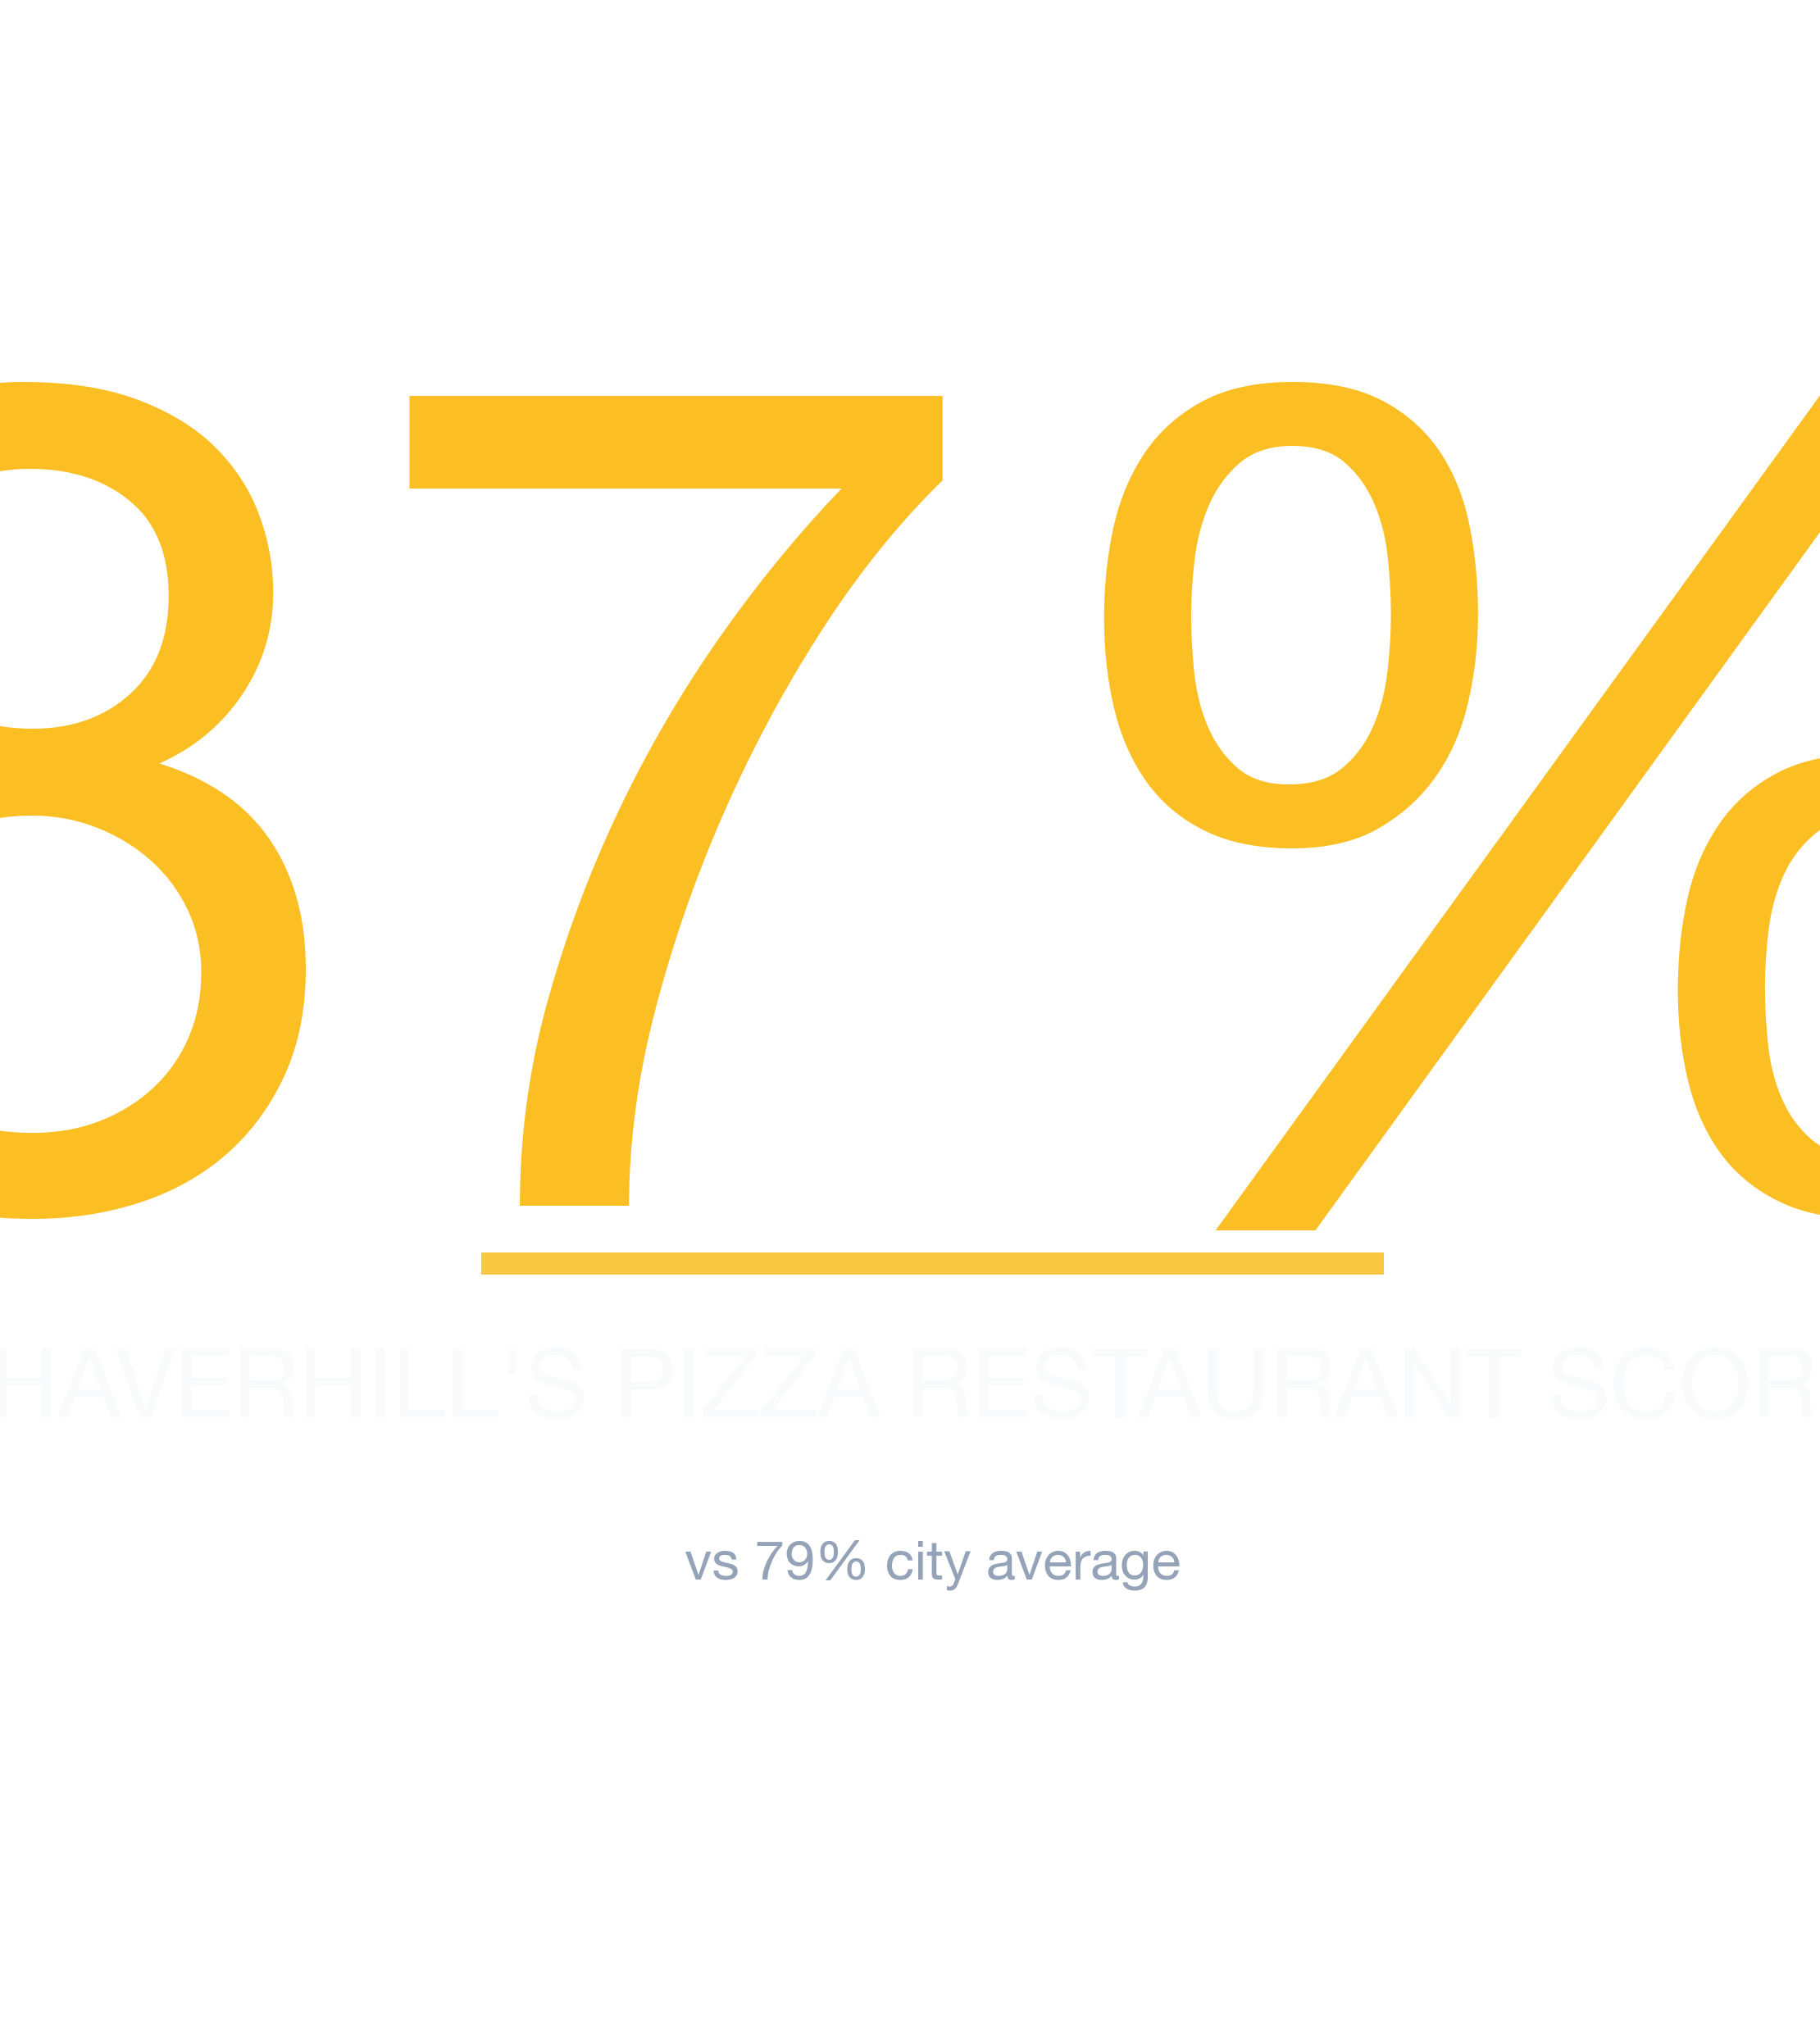
- #1 Neighborhood: Haverhill — 87% average survivability for Pizza Restaurant
- Neighborhoods at or above 70%: 88 of 88 analyzed
- City-wide average: 79% for Pizza Restaurants
- Most challenging area: West Roxbury at 73%
- Revenue advantage (top vs. avg location): ~10.8% more expected revenue in Haverhill
- Data freshness: 2026 data · Full methodology →
Table of Contents
- Summary
- 10 Best Neighborhoods
- Where Would a Pizza Restaurant Make the Most Money?
- What Should I Consider?
- Where Should I Start?
- FAQ: Best Neighborhoods
- FAQ: Can a Pizza Restaurant Succeed in Lower-Ranked Areas?
- FAQ: How Often Are Rankings Updated?
- FAQ: Is a Pizza Restaurant a Good Tenant?
- Landlord Survivability Data
- Best Neighborhoods for Any Business
Summary
Haverhill leads Boston's 2026 survivability rankings for Pizza Restaurant operators with 87% average chance of surviving more than 2 years, with the best locations offering 95% and the most challenging locations in Haverhill at 66%. The worst neighborhoods include West Roxbury with 73% average chance. A low-ranking neighborhood can still contain high-potential storefronts — the address matters most.
Where Pizza Restaurants Thrive in Boston
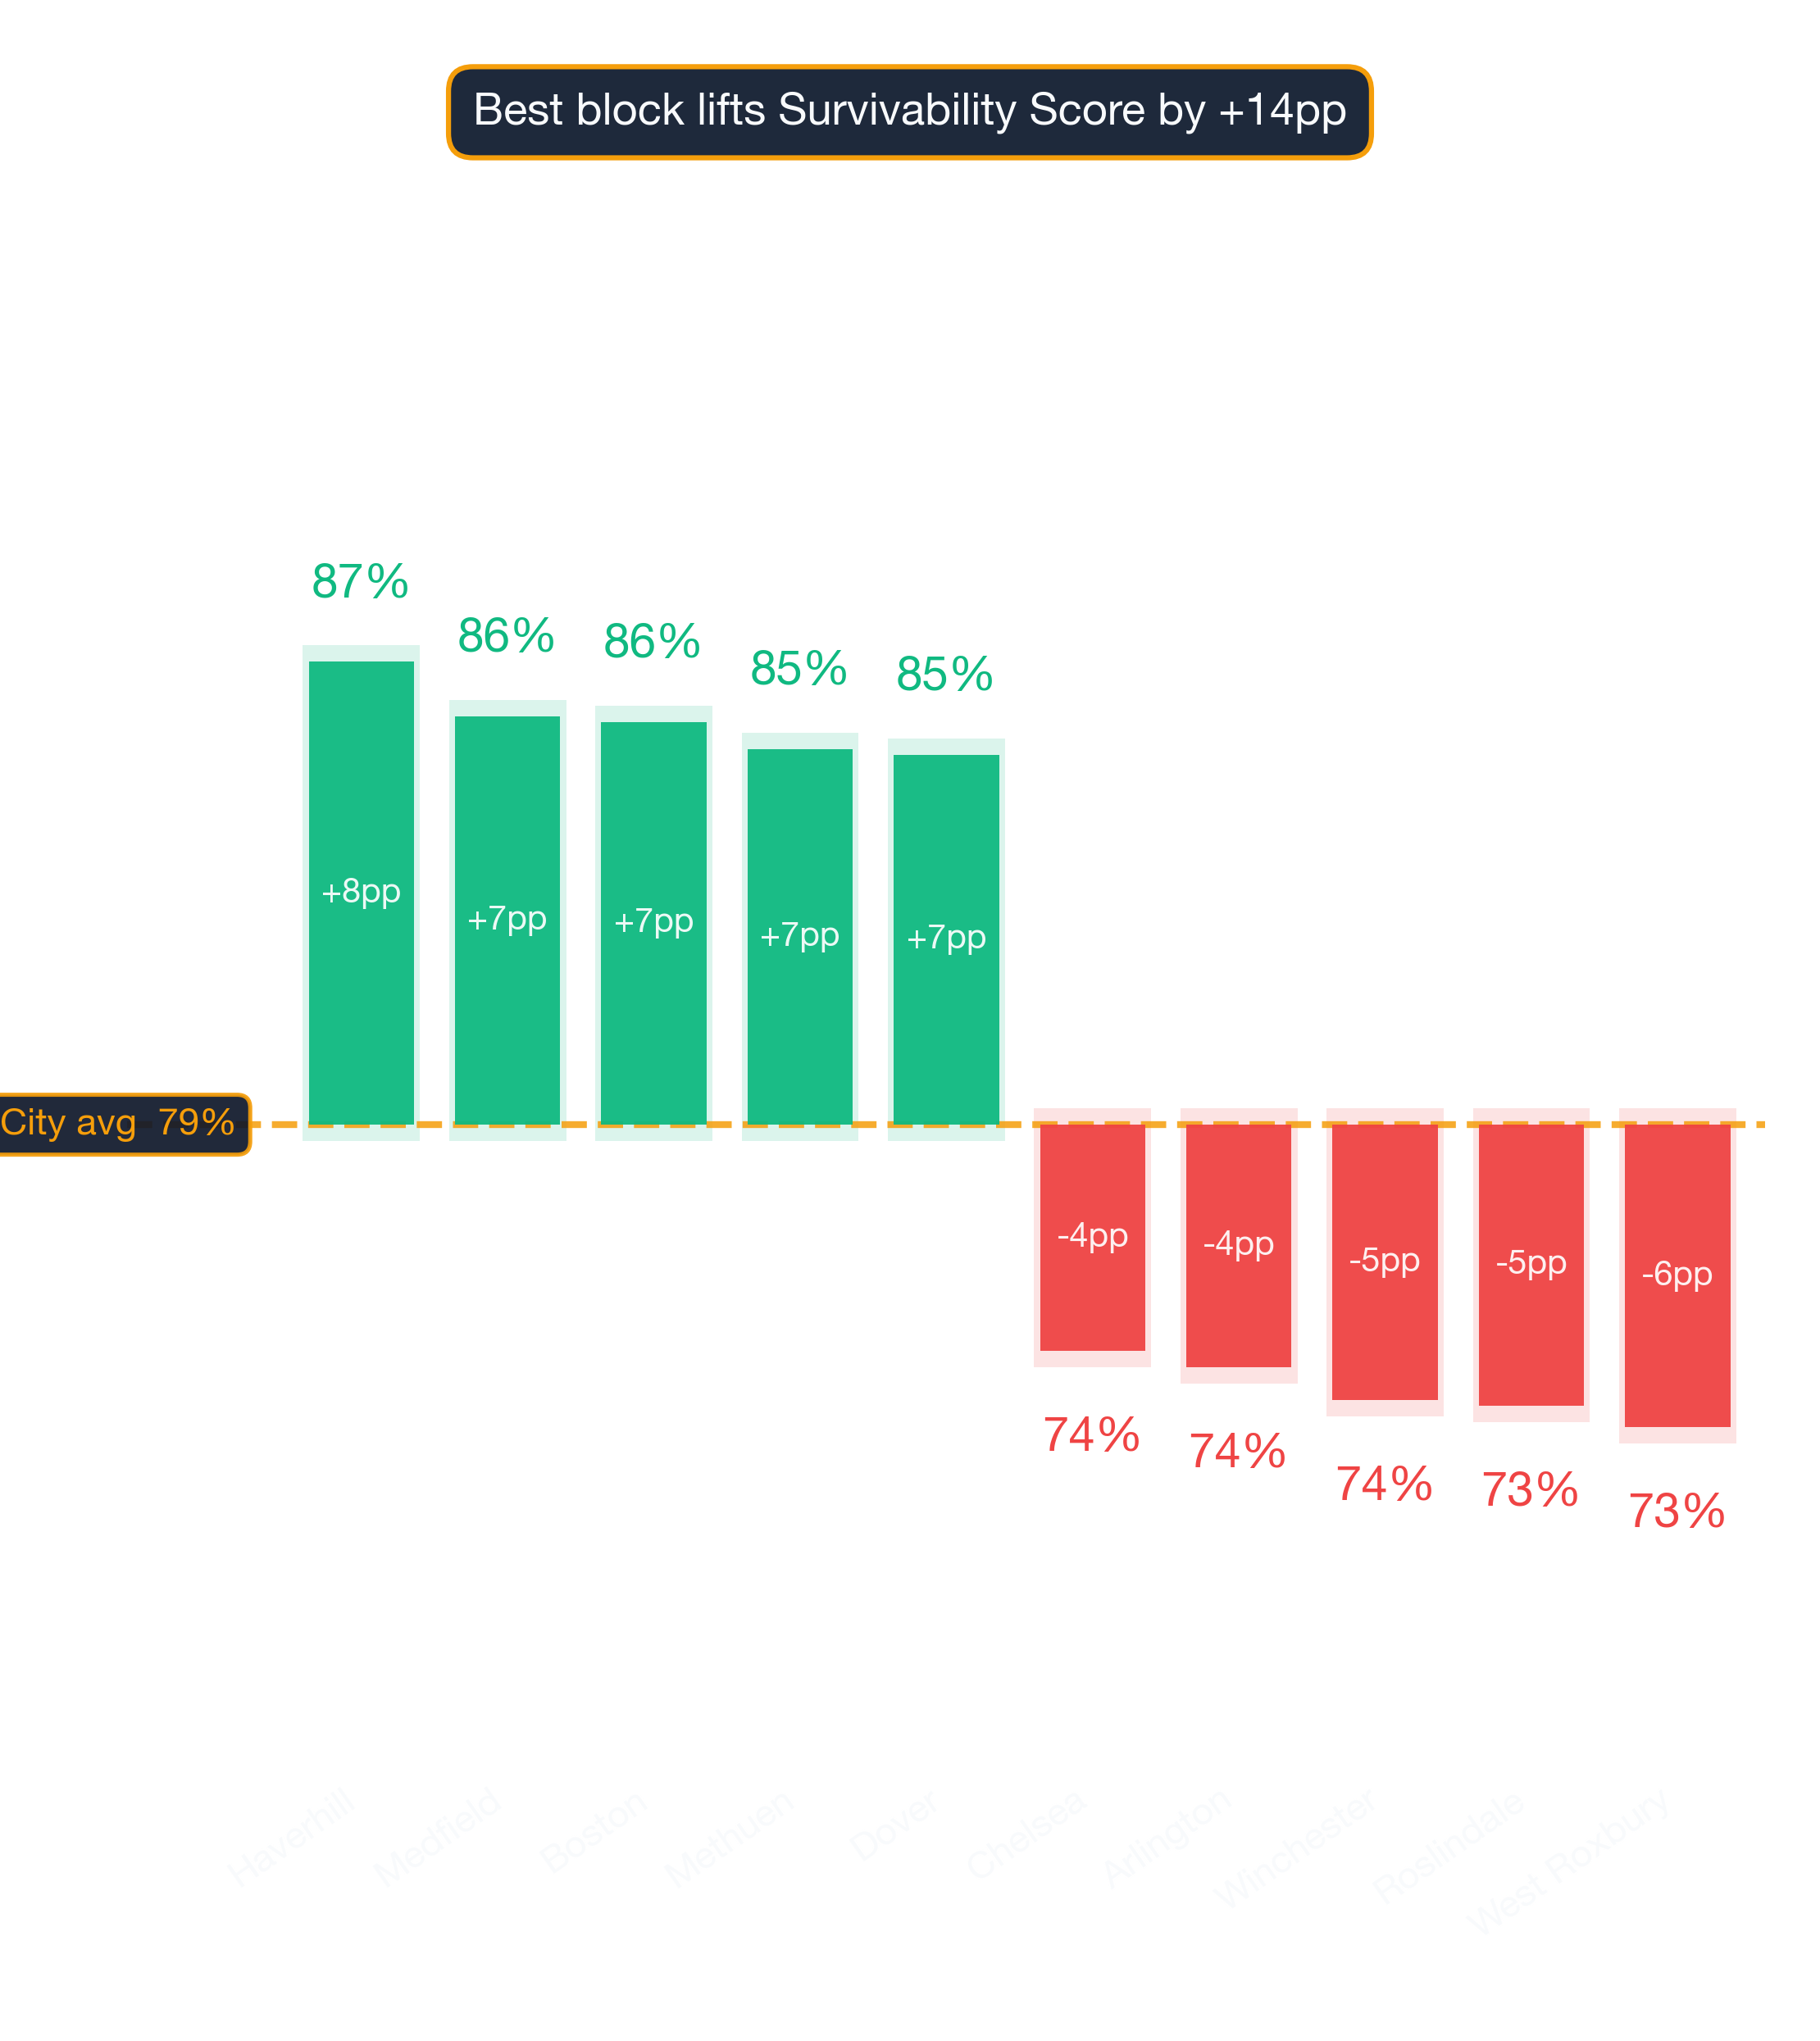
Haverhill ranks #1 of 88 neighborhoods analyzed in and around Boston for Pizza Restaurant survivability with a score of 87% as of 2026. The top 10 neighborhoods are:
Why these rankings reflect real survival outcomes
| Rank | Neighborhood | Best Locations | Average Locations | Challenging Locations |
|---|---|---|---|---|
| 1 | Haverhill | 92.0% – 96.0% | 85.0% – 88.6% | 65.0% – 69.0% |
| 2 | Medfield | 94.0% – 97.0% | 84.0% – 87.6% | 63.0% – 67.0% |
| 3 | Boston | 89.0% – 93.0% | 83.9% – 87.5% | 67.0% – 71.0% |
| 4 | Methuen | 93.0% – 97.0% | 83.4% – 87.0% | 65.0% – 69.0% |
| 5 | Dover | 93.0% – 97.0% | 83.3% – 86.9% | 66.0% – 70.0% |
| 6 | Needham | 94.0% – 97.0% | 82.6% – 86.2% | 61.0% – 65.0% |
| 7 | Lowell | 94.0% – 97.0% | 82.2% – 85.8% | 64.0% – 68.0% |
| 8 | Merrymount | 89.0% – 93.0% | 81.6% – 85.2% | 65.0% – 69.0% |
| 9 | Brockton | 92.0% – 96.0% | 80.7% – 84.3% | 64.0% – 68.0% |
| 10 | Lawrence | 92.0% – 96.0% | 80.5% – 84.1% | 66.0% – 70.0% |
What separates the top neighborhoods from the rest
However, individual locations vary widely, and even in lower-scoring neighborhoods there are pockets that perform exceptionally well. For the most accurate predictions, always check your specific address in StreetSpring's live platform.
Survivability ranges reflect best and worst storefront conditions within each neighborhood. See our full methodology →
Try StreetSpring to see if this location is still the best and see if there are locations to rent in this area right now.
Where in or Around Boston Would a Pizza Restaurant Make the Most Money?
In Haverhill, the best possible location offers the opportunity of making ~10.8% more than the average location in or around Boston.
On the other hand, in West Roxbury, the worst possible location could result in making ~7.0% less than the average location in the city.
The difference between success and failure often comes down to where you sign the lease. Opening a Pizza Restaurant in Boston requires careful location choice. Across 88 neighborhoods analyzed, the overall average survival chance for a new Pizza Restaurant is 79% for lasting more than 2 years — due to a combination of many factors across competition, consumer spending, and location dynamics. Consumer spending patterns differ dramatically across business types and micro-locations.
What Matters Most When Opening a Pizza Restaurant in Boston
Selecting a high-survivability address is the single most cost-effective risk reduction available before signing a lease. Everything downstream depends on it. No other single metric predicts business longevity as reliably as Revenue Capture Score. StreetSpring computes this by projecting the business's market share, which is based on the quality and quantity of primary, secondary, and tertiary competitors. Our forecasting engine processes data from over 24 metro areas covering 180+ million consumers. Moderate competition often indicates a healthy market with proven consumer demand. Our forecasting system combines proprietary data with machine learning models unavailable anywhere else.
| Factor | Where new owners get tripped up | Questions to ask before you sign |
|---|---|---|
| Build-out budget | Underestimating mechanical, electrical, and plumbing — the "hidden" 30-50% of build-out cost. | Get 3 quotes from licensed contractors and pad budget by +20% for surprises. Confirm landlord TI allowance in writing. |
| CAM + hidden costs | Stated rent looks great, then CAM fees, signage charges, and after-hours utilities add 15-30%. | Get the full operating expense breakdown for the past 2 years. Ask which costs are landlord-capped vs. uncapped. |
| Lease term | Locking into 7-10 years without break clauses, then needing to relocate after year 2. | Negotiate a relocation or termination clause. Confirm assignment + sublease rights are in writing. |
This can be summarized as:
Revenue Capture Score = Projected Market Share × Forecasted Spend on Specific Business
Related: Survivability Score: How We Calculate It & Why It Matters
StreetSpring recalculates survivability using the latest competitive, demographic, and walkability data. Our live tool reflects the latest competitive landscape — these static rankings may already be slightly out of date.
Which Boston Block Is Right for a Pizza Restaurant?
For this business type, the highest-ranked neighborhoods are Haverhill, Medfield, and Boston, while the most challenging neighborhoods would be West Roxbury, Roslindale, and Winchester. For the most current predictions, visit StreetSpring to analyze your specific location in real-time. Market dynamics shift frequently; validate these insights with real-time data from StreetSpring.
Related Articles:
What Are the Best Neighborhoods in Boston to Open a Pizza Restaurant?
Based on StreetSpring's 2026 analysis, the top neighborhood for a Pizza Restaurant in Boston is Haverhill with 87% average survivability, followed by Medfield and Boston. 88 of 88 neighborhoods analyzed exceed 70% two-year survival.
StreetSpring refreshes survivability data continuously — check the tool for the most current score at any address.
Are Bottom-Tier Boston Neighborhoods a No-Go for Pizza Restaurants?
Yes — neighborhood averages mask significant block-by-block variation. Even in neighborhoods ranked outside the top 10, individual storefronts with strong foot traffic, low direct competition, and favorable lease terms can outperform the area average. Location-level factors like visibility and adjacent tenants can override neighborhood-level trends. Always check your specific address in StreetSpring's live platform for the most accurate prediction.
How Fresh Is Our Boston Pizza Restaurant Ranking Data?
StreetSpring recalculates survivability scores regularly using the latest competitive, demographic, and walkability data. Rankings are updated quarterly; the live tool always reflects the most current predictions for any address in Boston.
The Landlord's View of Pizza Restaurants in Boston
In Haverhill, StreetSpring forecasts a 85.0% – 88.6% average chance for a new Pizza Restaurant to survive more than 2 years, depending on the exact storefront. Check the current Survivability Score for any address instantly.
Landlord Survivability Data for Pizza Restaurant in Boston
Reducing vacancy starts with choosing tenants whose business type matches the neighborhood's strengths. For Pizza Restaurant tenants, Haverhill provides the best survivability conditions (85.0% – 88.6%). Medfield and Boston also show viable averages at 84.0% – 87.6% and 83.9% – 87.5% respectively. See which business types are most likely to succeed at your property address right now.
StreetSpring delivers pinpoint accuracy down to the exact storefront location.
Related: How Landlord Representatives Can Reduce Vacancy & Increase Tenant Longevity
Where in Boston Should You Open a Pizza Restaurant?
You can see the best neighborhoods in or around Boston to open any type of business in our article Neighborhood Survivability Rankings: Boston.
Technical note: Aggregated survivability rankings for Boston are available in machine-readable format for research and integration purposes.
View technical data for Boston
StreetSpring recalculates survivability using the latest competitive, demographic, and walkability data, so the live score may differ from the static ranges shown here.
Visual Data
Related Resources
Same business type in other cities:
Related:
Related:
- Survivability Rankings for Acupuncture Clinic in Atlanta
- Survivability Rankings for Afghan Restaurant in Atlanta
More Questions About This Location
Local-context questions, answered with neighborhood-specific numbers.
What 5-year survival rate does the federal government track for Pizza Restaurants?
Pizza Restaurants have a national 5-year survival rate of 50% per BLS Business Employment Dynamics (March 2025). StreetSpring's Boston corpus shows an average survivability score of 86% for this subtype, above the BLS baseline by 36 points.
What goes into a StreetSpring survivability score for Pizza Restaurants?
Each Pizza Restaurants survivability score in Boston (averaging 86%) reflects ~100 factors per address: competitor counts at multiple radii, demographics, accessibility, rent, and historical outcomes. The model is recalibrated quarterly against 500K+ business outcomes nationally.
What's the survivability spread for Pizza Restaurants across Boston?
The Boston survivability spread for Pizza Restaurants runs from 63% (challenging locations) to 99% (best locations) — a 36-point window driven entirely by site selection.
What separates a Boston Pizza Restaurant that survives from one that doesn't?
Site selection is the highest-leverage decision. The 63-99% range for Pizza Restaurants in Boston (36-point spread) reflects what location alone can change — independent of brand, operations, or marketing.