Survivability Rankings for Physical Therapy Clinic in Boston
StreetSpring's 2026 analysis ranks the best and worst neighborhoods in Boston to open a Physical Therapy Clinic, from Cambridge (76% survival) to Lexing...
By Bobby Koons | Last updated: May 12, 2026 | Weekly methodology review | Methodology
Quick Summary
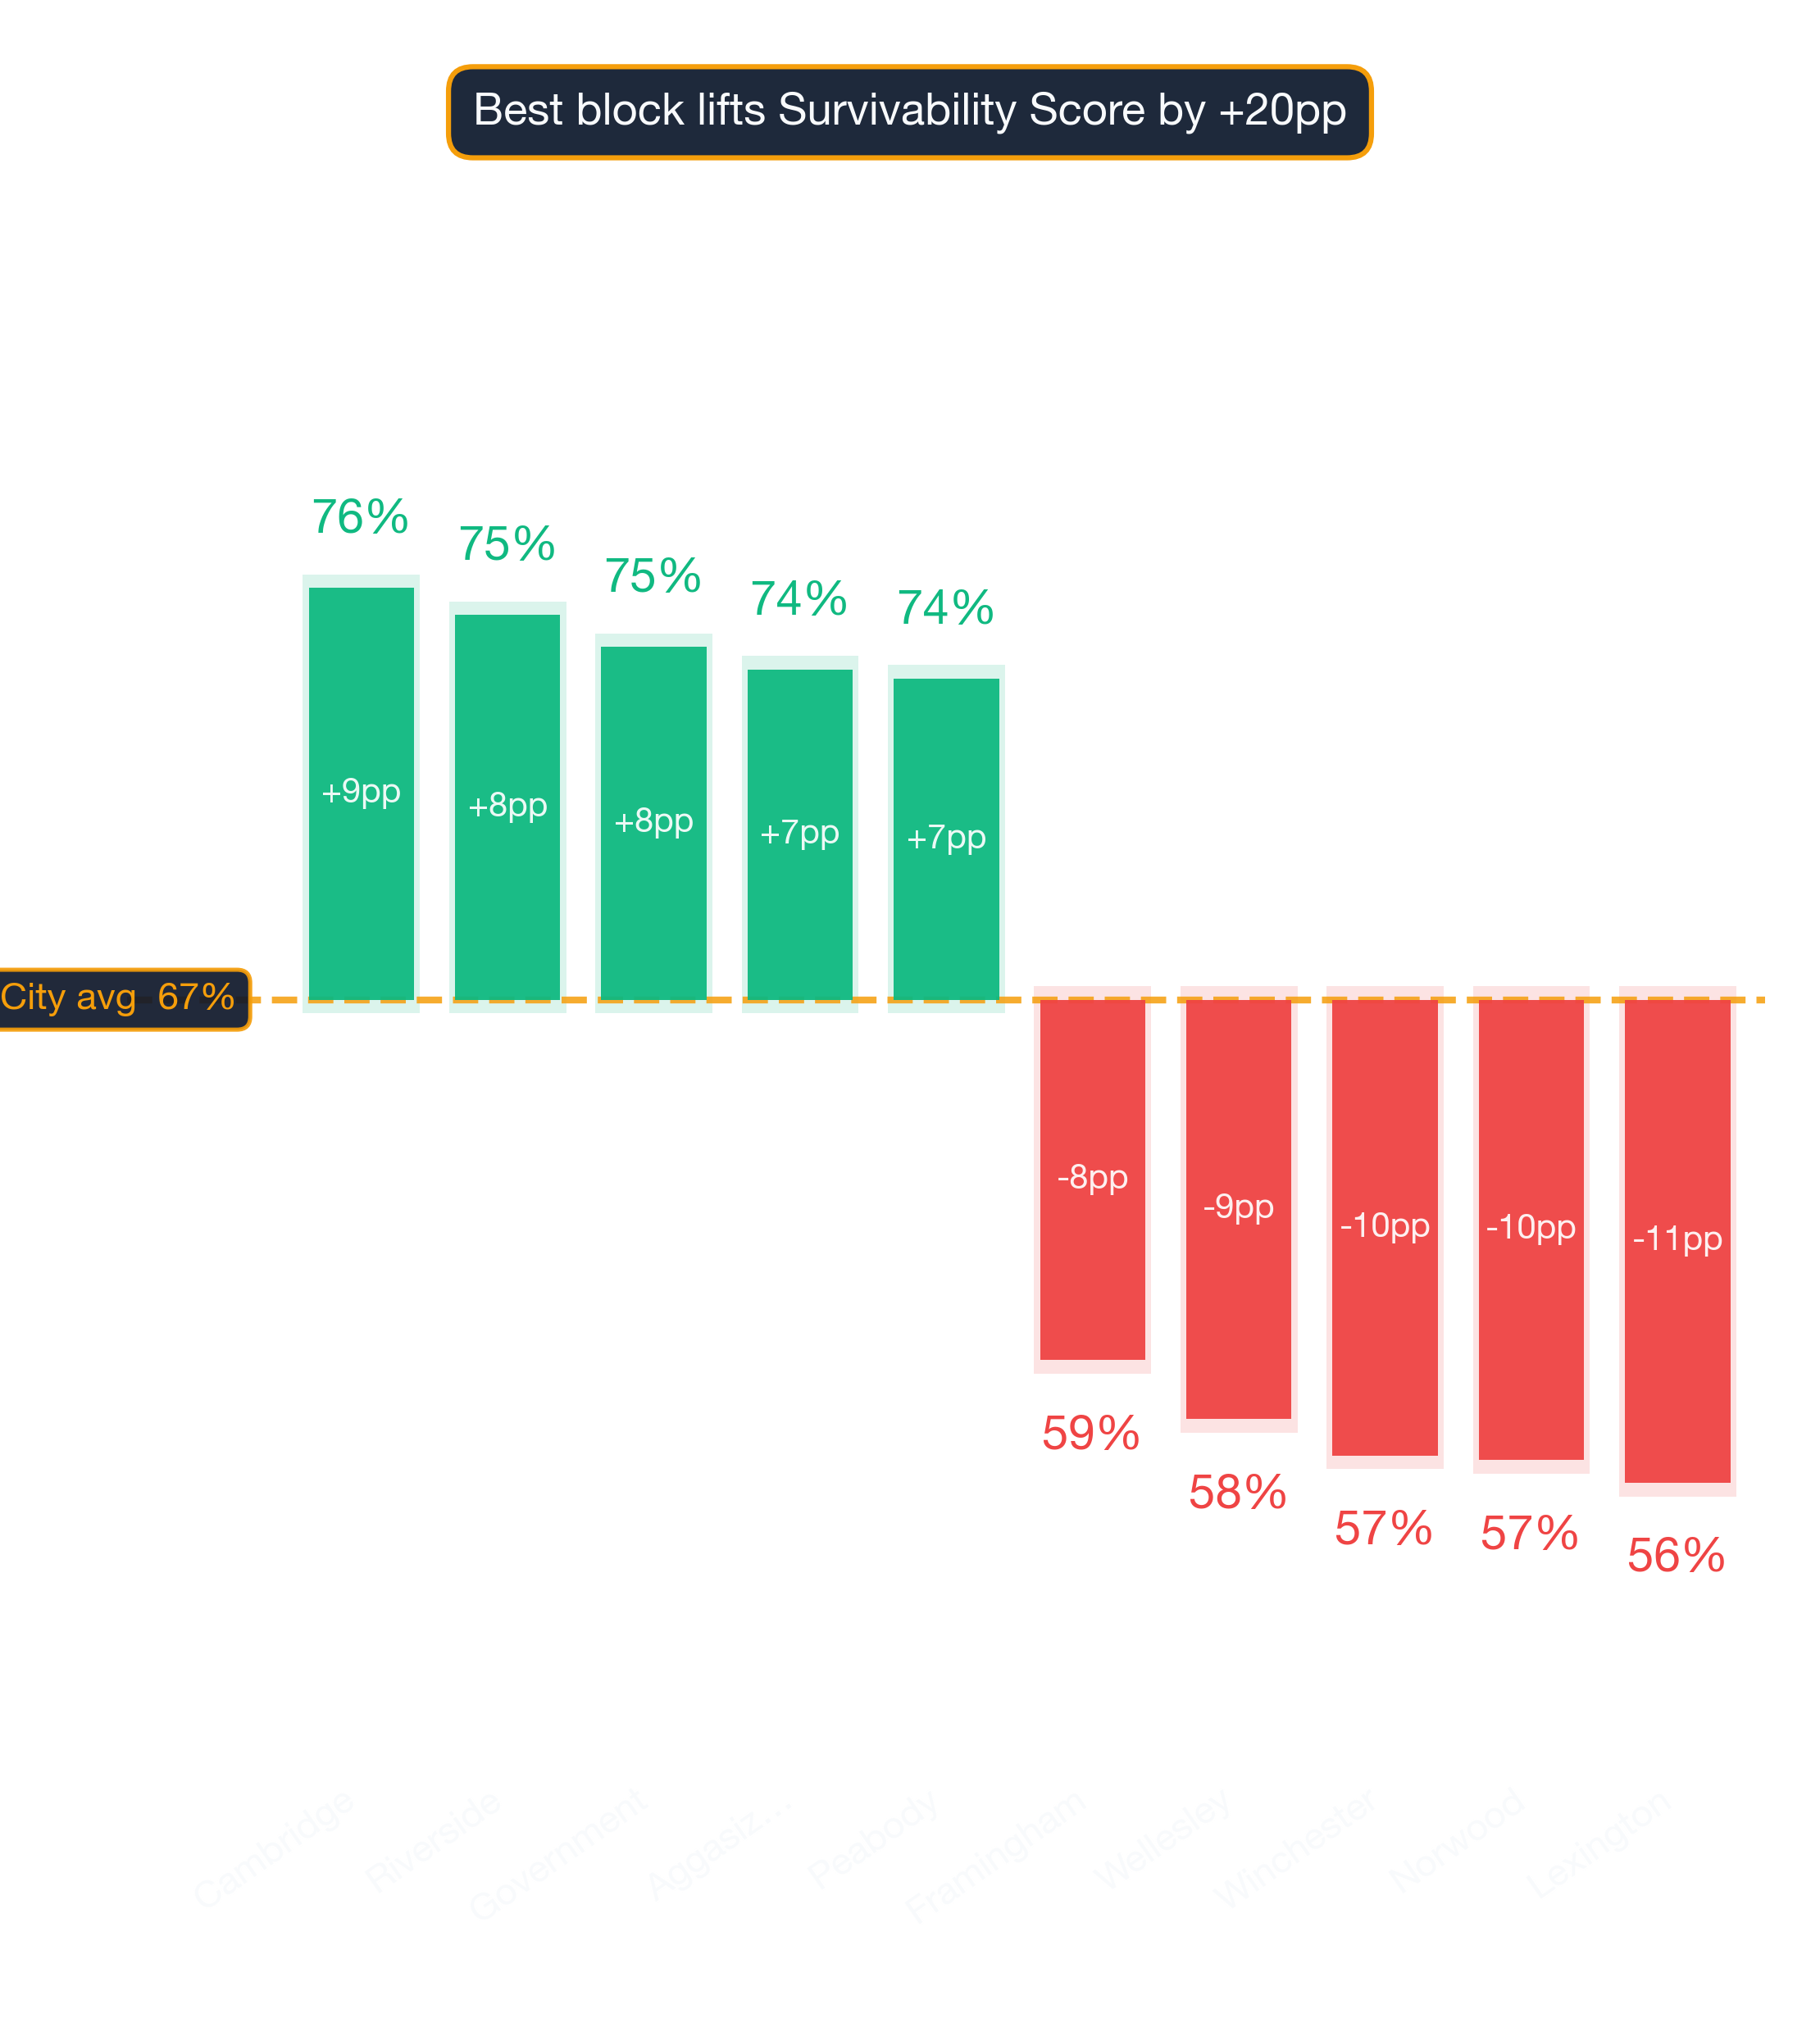
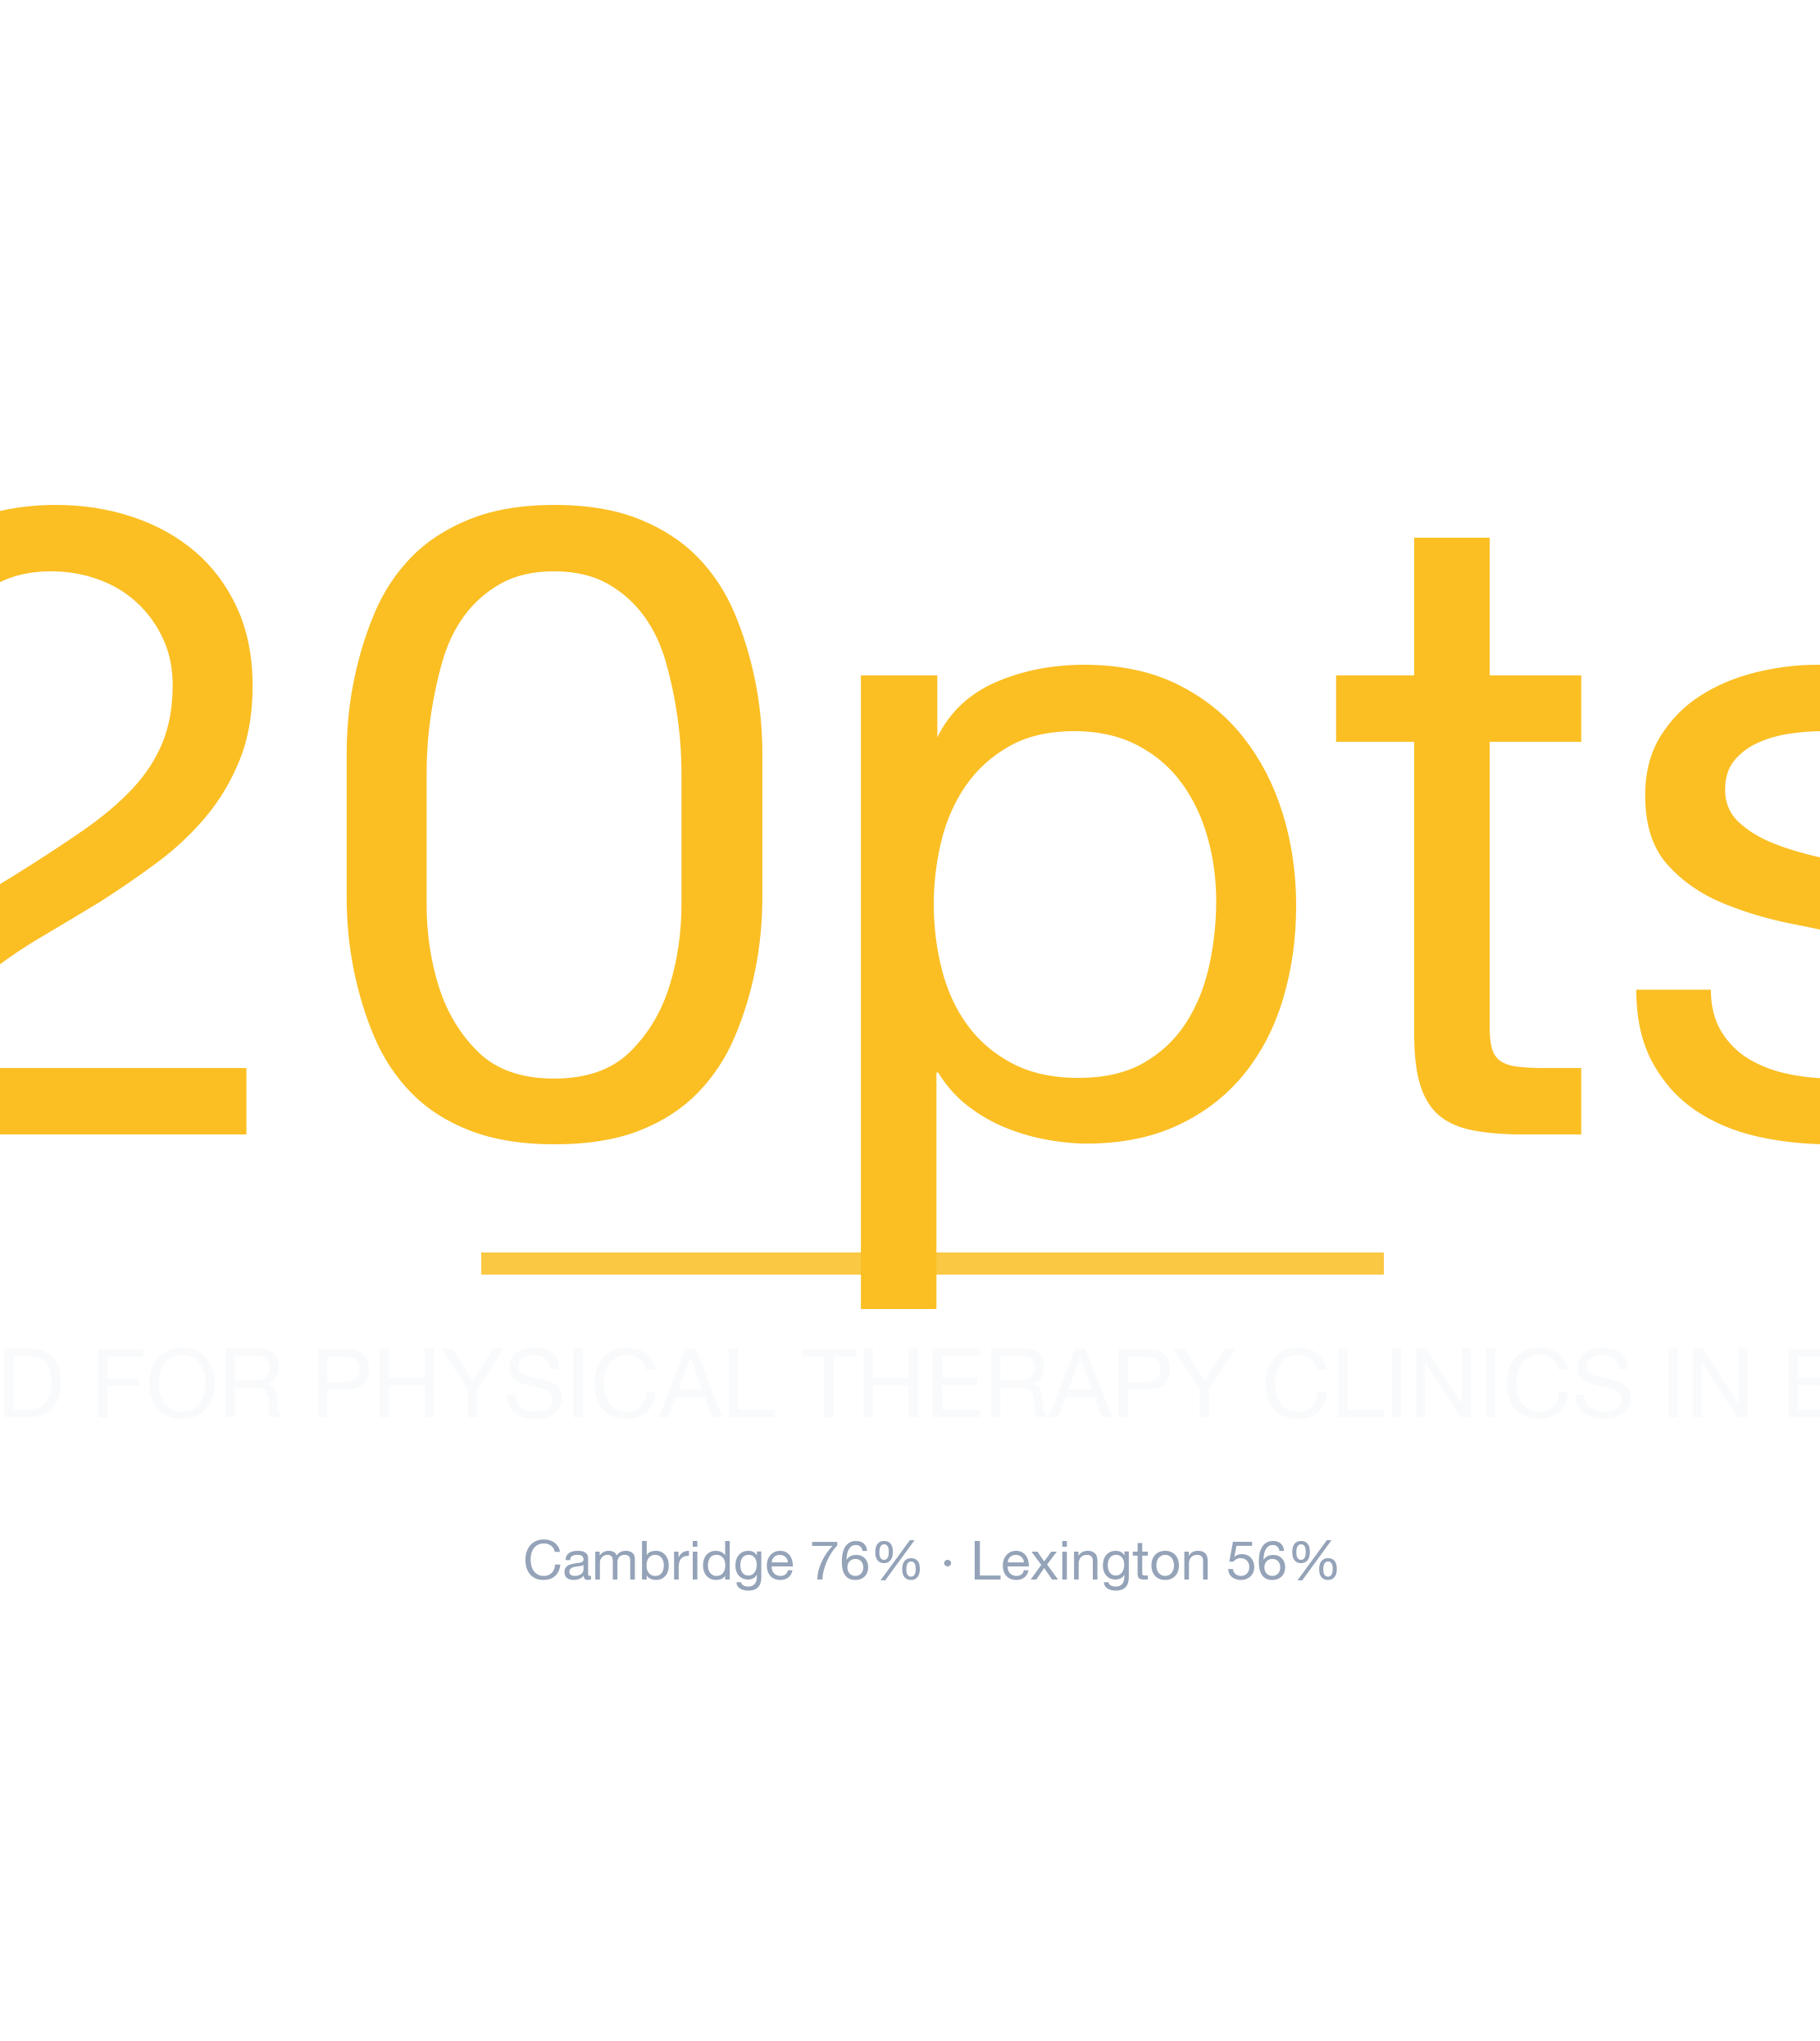
- #1 Neighborhood: Cambridge — 76% average survivability for Physical Therapy Clinic
- Neighborhoods at or above 70%: 22 of 88 analyzed
- City-wide average: 67% for Physical Therapy Clinics
- Most challenging area: Lexington at 56%
- Revenue advantage (top vs. avg location): ~13.6% more expected revenue in Cambridge
- Data freshness: 2026 data · Full methodology →
Table of Contents
- Summary
- 10 Best Neighborhoods
- Where Would a Physical Therapy Clinic Make the Most Money?
- What Should I Consider?
- Where Should I Start?
- FAQ: Best Neighborhoods
- FAQ: Can a Physical Therapy Clinic Succeed in Lower-Ranked Areas?
- FAQ: How Often Are Rankings Updated?
- FAQ: Is a Physical Therapy Clinic a Good Tenant?
- Landlord Survivability Data
- Best Neighborhoods for Any Business
Summary
Opening a Physical Therapy Clinic in Boston? Our 2026 analysis identifies Cambridge as the top location with 76% average chance of surviving more than 2 years, with the best locations offering 79% and the most challenging locations in Cambridge at 73%. The worst neighborhoods include Lexington with 56% average chance. These rankings are based on the latest available data; check StreetSpring for real-time updates.
Where in Boston Should You Open a Physical Therapy Clinic?
Cambridge ranks #1 of 88 neighborhoods analyzed in and around Boston for Physical Therapy Clinic survivability with a score of 76% as of 2026. The top 10 neighborhoods are:
What separates the top neighborhoods from the rest
| Rank | Neighborhood | Best Locations | Average Locations | Challenging Locations |
|---|---|---|---|---|
| 1 | Cambridge | 76.0% – 80.0% | 73.1% – 78.1% | 72.0% – 76.0% |
| 2 | Riverside | 76.0% – 80.0% | 72.5% – 77.5% | 69.0% – 73.0% |
| 3 | Government Center | 76.0% – 80.0% | 71.8% – 76.8% | 69.0% – 73.0% |
| 4 | Aggasiz - Harvard North | 75.0% – 79.0% | 71.3% – 76.3% | 69.0% – 73.0% |
| 5 | Peabody | 76.0% – 80.0% | 71.1% – 76.1% | 66.0% – 70.0% |
| 6 | Kenmore | 75.0% – 79.0% | 71.0% – 76.0% | 68.0% – 72.0% |
| 7 | Mid-Cambridge | 74.0% – 78.0% | 70.9% – 75.9% | 68.0% – 72.0% |
| 8 | Ball Square | 76.0% – 80.0% | 70.8% – 75.8% | 66.0% – 70.0% |
| 9 | Cambridgeport | 75.0% – 79.0% | 70.0% – 75.0% | 67.0% – 71.0% |
| 10 | Downtown Crossing | 74.0% – 78.0% | 69.9% – 74.9% | 69.0% – 73.0% |
Where the rankings might surprise you
These averages are directional, not definitive; the best decision comes from analyzing your specific storefront. Market dynamics shift frequently; validate these insights with real-time data from StreetSpring.
Survivability ranges reflect best and worst storefront conditions within each neighborhood. See our full methodology →
Try StreetSpring to see if this location is still the best and see if there are locations to rent in this area right now.
Where in or Around Boston Would a Physical Therapy Clinic Make the Most Money?
In Cambridge, the best possible location offers the opportunity of making ~13.6% more than the average location in or around Boston.
On the other hand, in Lexington, the worst possible location could result in making ~15.9% less than the average location in the city.
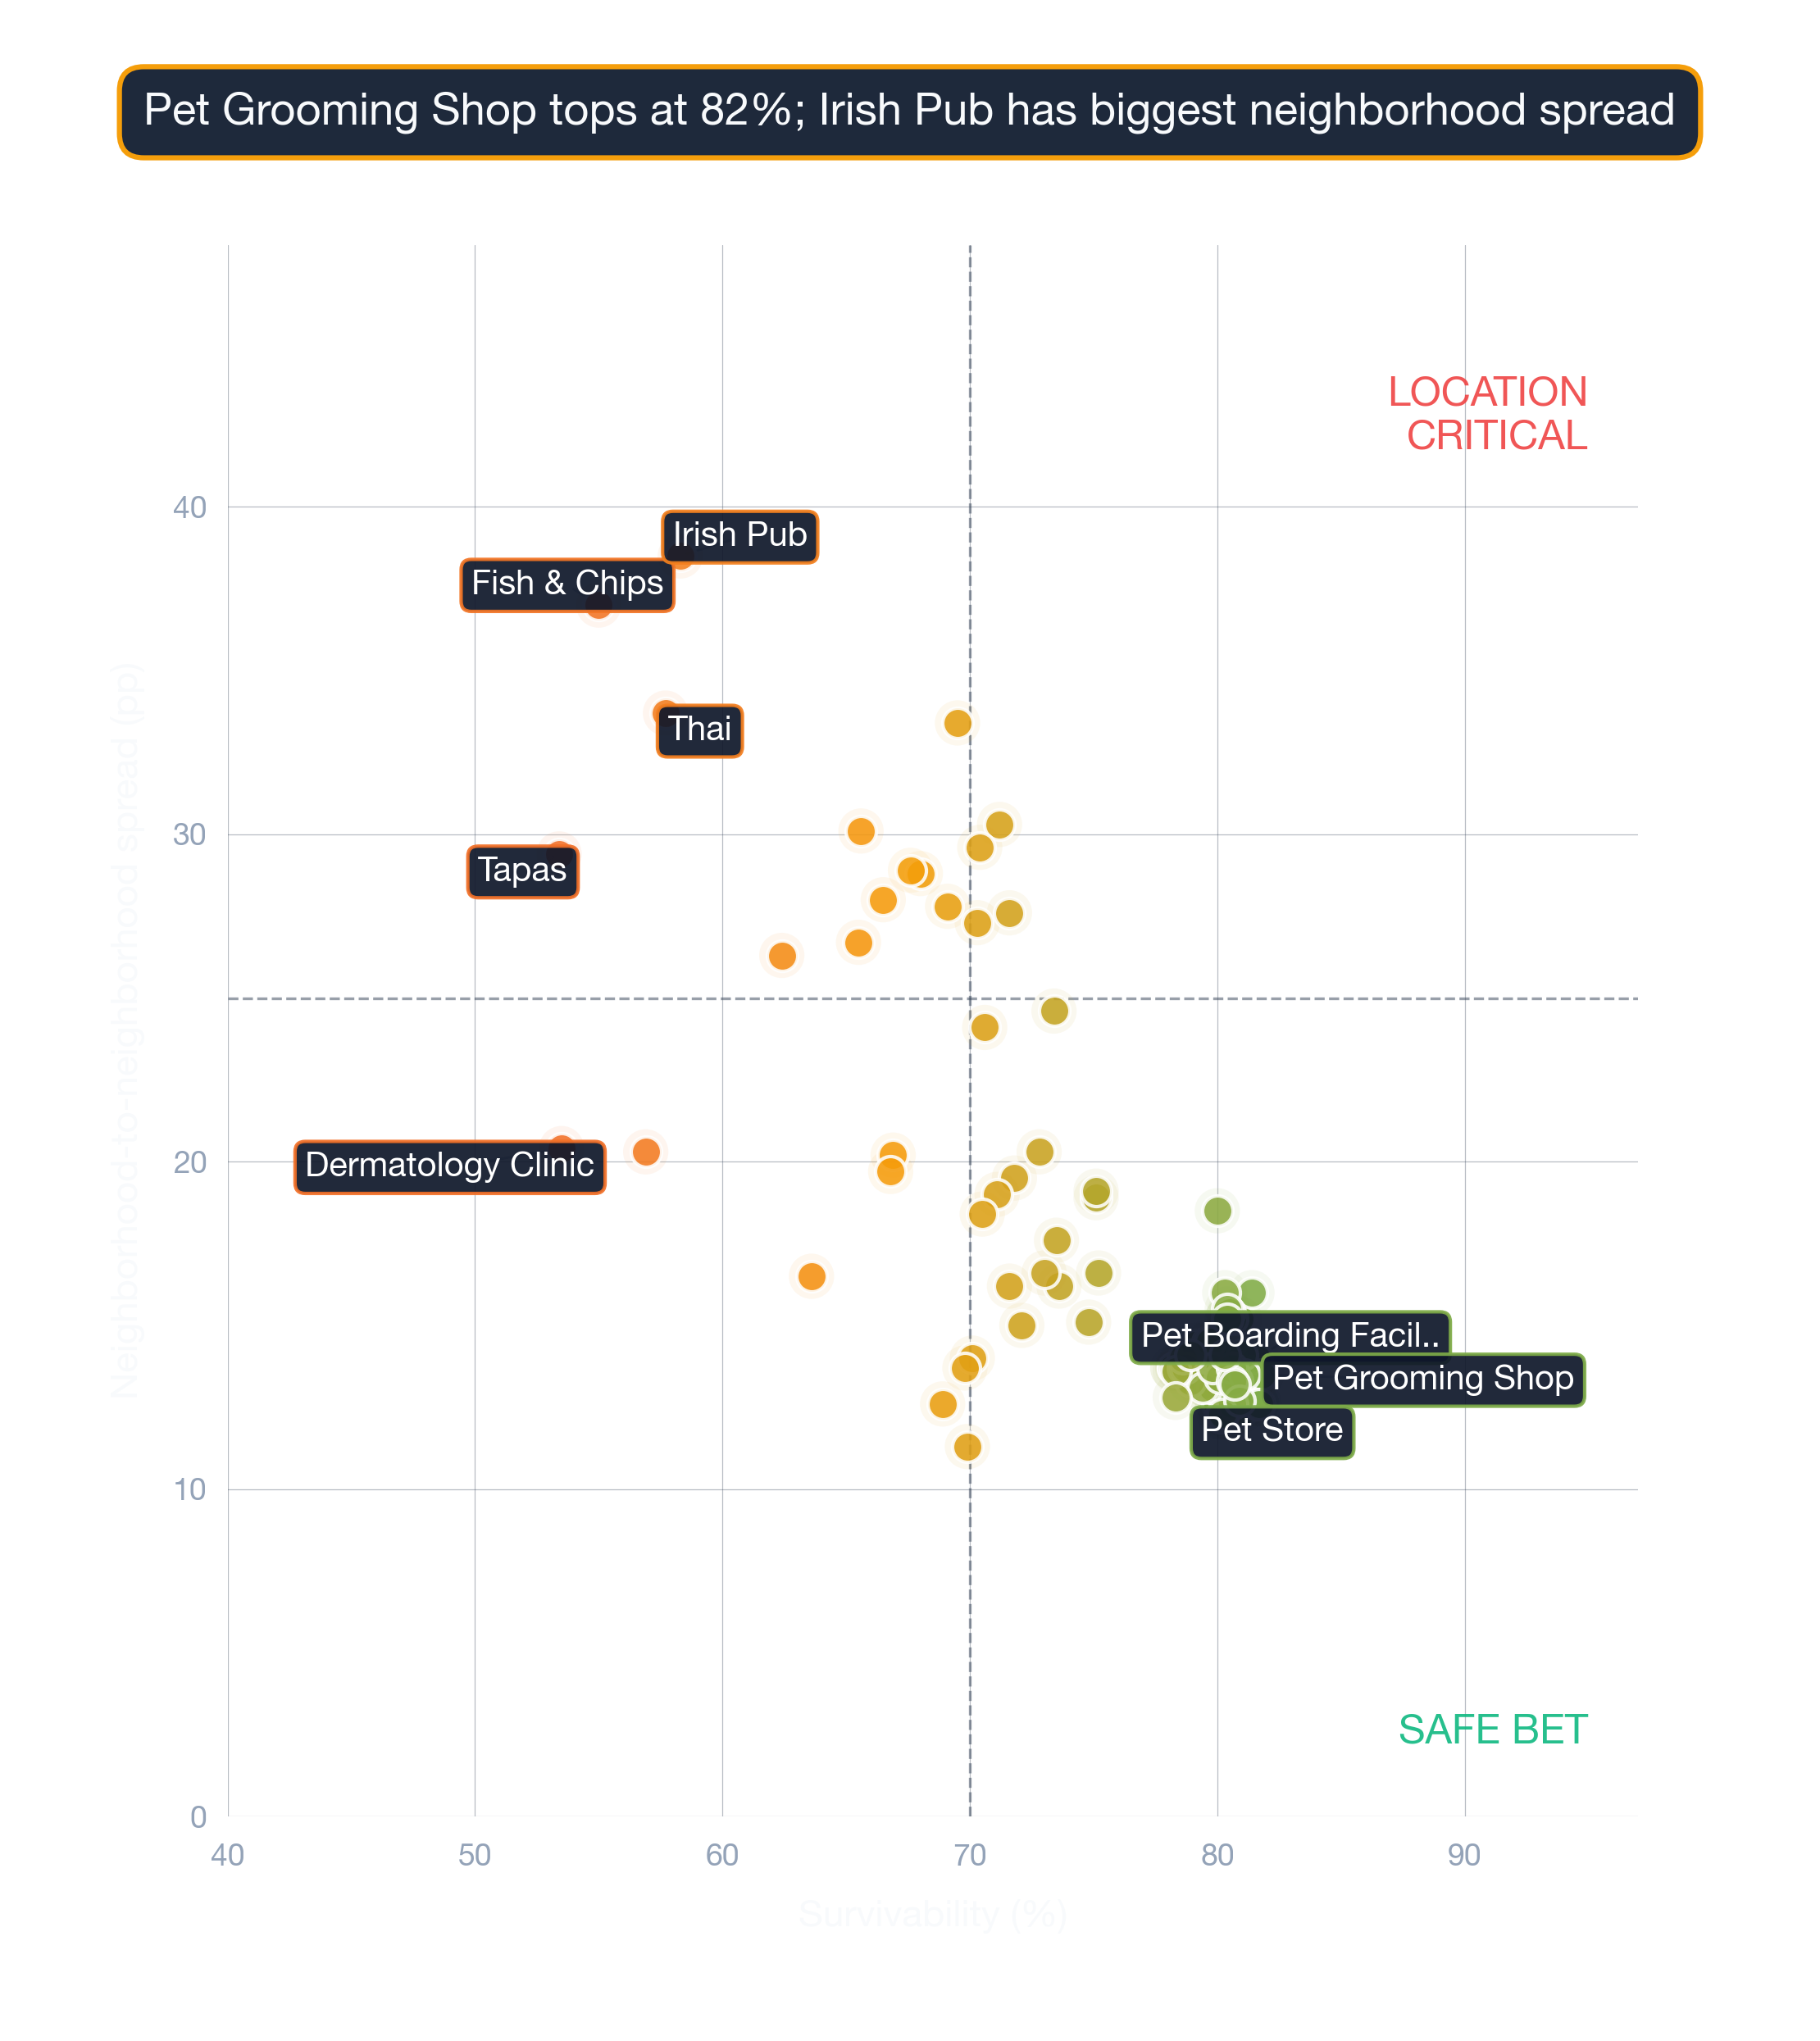
Your choice of location outweighs almost every other business decision combined. Opening a Physical Therapy Clinic in Boston requires careful location choice. Across 88 neighborhoods analyzed, the overall average survival chance for a new Physical Therapy Clinic is 67% for lasting more than 2 years — due to a combination of many factors across competition, consumer spending, and location dynamics. The same location can be excellent for one business type and poor for another.
The Most Important Factors for a Physical Therapy Clinic in Boston
Among all the variables you control, location quality has the biggest downstream impact. A strong Survivability Score is the foundation everything else builds on. Revenue Capture Score is the single best indicator of whether a business will thrive at a location. StreetSpring computes this by projecting the business's market share, which is based on the quality and quantity of primary, secondary, and tertiary competitors. We apply advanced machine learning to massive commercial real estate datasets to build accurate models. Our data shows that businesses in moderately competitive clusters survive longer than isolated storefronts on average. StreetSpring's predictions leverage proprietary datasets covering competition, spending, and mobility.
| Factor | Where new owners get tripped up | Questions to ask before you sign |
|---|---|---|
| Build-out budget | Underestimating mechanical, electrical, and plumbing — the "hidden" 30-50% of build-out cost. | Get 3 quotes from licensed contractors and pad budget by +20% for surprises. Confirm landlord TI allowance in writing. |
| CAM + hidden costs | Stated rent looks great, then CAM fees, signage charges, and after-hours utilities add 15-30%. | Get the full operating expense breakdown for the past 2 years. Ask which costs are landlord-capped vs. uncapped. |
| Foot traffic seasonality | Looking at a peak-summer Tuesday and assuming year-round volume. | Walk the block at 3 different times across 2 different weeks. Ask neighboring tenants for their slow-season % drop. |
This can be summarized as:
Revenue Capture Score = Projected Market Share × Forecasted Spend on Specific Business
Related: Survivability Score: How We Calculate It & Why It Matters
StreetSpring recalculates survivability using the latest competitive, demographic, and walkability data. The live platform incorporates the most recent foot traffic, competitor, and spending data for your exact address.
Where to Launch a Physical Therapy Clinic in or Around Boston
The strongest survivability scores belong to Cambridge, Riverside, and Government Center, while the most challenging neighborhoods would be Lexington, Norwood, and Winchester. Location-level factors like visibility and adjacent tenants can override neighborhood-level trends. StreetSpring refreshes survivability data continuously — check the tool for the most current score at any address.
Related Articles:
Which Boston Neighborhoods Are Strongest for Physical Therapy Clinics?
Based on StreetSpring's 2026 analysis, the top neighborhood for a Physical Therapy Clinic in Boston is Cambridge with 76% average survivability, followed by Riverside and Government Center. 22 of 88 neighborhoods analyzed exceed 70% two-year survival.
However, market conditions change daily, and it's best to use StreetSpring's live data to check the Survivability Score for a specific address.
Should You Consider Lower-Survivability Areas of Boston for a Physical Therapy Clinic?
Yes — neighborhood averages mask significant block-by-block variation. Even in neighborhoods ranked outside the top 10, individual storefronts with strong foot traffic, low direct competition, and favorable lease terms can outperform the area average. These rankings are based on the latest available data; check StreetSpring for real-time updates. Always check your specific address in StreetSpring's live platform for the most accurate prediction.
The Update Schedule for Boston Physical Therapy Clinics Data
StreetSpring recalculates survivability scores regularly using the latest competitive, demographic, and walkability data. Rankings are updated quarterly; the live tool always reflects the most current predictions for any address in Boston.
Should You Rent Your Boston Storefront to a Physical Therapy Clinic?
In Cambridge, StreetSpring forecasts a 73.1% – 78.1% average chance for a new Physical Therapy Clinic to survive more than 2 years, depending on the exact storefront. Check the current Survivability Score for any address instantly.
Landlord Survivability Data for Physical Therapy Clinic in Boston
From a risk-assessment perspective, a Physical Therapy Clinic tenant in Cambridge carries the lowest risk with average survivability of 73.1% – 78.1%. Riverside presents moderate risk (72.5% – 77.5%), and Government Center carries comparatively higher risk at 71.8% – 76.8%. See which business types are most likely to succeed at your property address right now.
StreetSpring's predictions are granular enough to distinguish between two storefronts on the same block.
Related: How Landlord Representatives Can Reduce Vacancy & Increase Tenant Longevity
Top-Survivability Boston Neighborhoods for Physical Therapy Clinics
You can see the best neighborhoods in or around Boston to open any type of business in our article Neighborhood Survivability Rankings: Boston.
Technical note: Aggregated survivability rankings for Boston are available in machine-readable format for research and integration purposes.
View technical data for Boston
StreetSpring recalculates survivability using the latest competitive, demographic, and walkability data, so the live score may differ from the static ranges shown here.
Visual Data
Related Resources
Same business type in other cities:
Related:
Related:
- Survivability Rankings for Acupuncture Clinic in Atlanta
- Survivability Rankings for Afghan Restaurant in Atlanta
More Questions About This Location
Beyond the general FAQ — data-anchored answers for this specific location.
What separates a Boston Physical Therapy Clinic that survives from one that doesn't?
The address you sign for. Across Boston, Physical Therapy Clinics score 41-87% depending on location — a 46-point spread that captures competitive density, demographic fit, accessibility, and visibility at each storefront.
What factors drive the Boston Physical Therapy Clinics score?
Each Physical Therapy Clinics survivability score in Boston (averaging 69%) reflects ~100 factors per address: competitor counts at multiple radii, demographics, accessibility, rent, and historical outcomes. The model is recalibrated quarterly against 500K+ business outcomes nationally.
What's the survivability spread for Physical Therapy Clinics across Boston?
The Boston survivability spread for Physical Therapy Clinics runs from 41% (challenging locations) to 87% (best locations) — a 46-point window driven entirely by site selection.
How current is the Physical Therapy Clinics data for Boston?
The Boston Physical Therapy Clinics survivability corpus refreshes quarterly. The current dataset (2026 release) reflects Boston's ~69% average for this subtype. New competitor openings, closures, and ACS releases are integrated each refresh cycle.
Are there peer business categories with similar Boston survivability to Physical Therapy Clinics?
Per StreetSpring's Boston corpus, peers of Physical Therapy Clinics (within 2 points of the 69% average) include Coffee Shop, Vitamin & Supplement Store, Bakery.