Survivability Rankings for Pet Boarding Facility in Boston
StreetSpring's 2026 analysis ranks the best and worst neighborhoods in Boston to open a Pet Boarding Facility, from Boston (88% survival) to Winchester ...
By Bobby Koons | Last reviewed: April 26, 2026 | Updated weekly | Methodology
Quick Summary
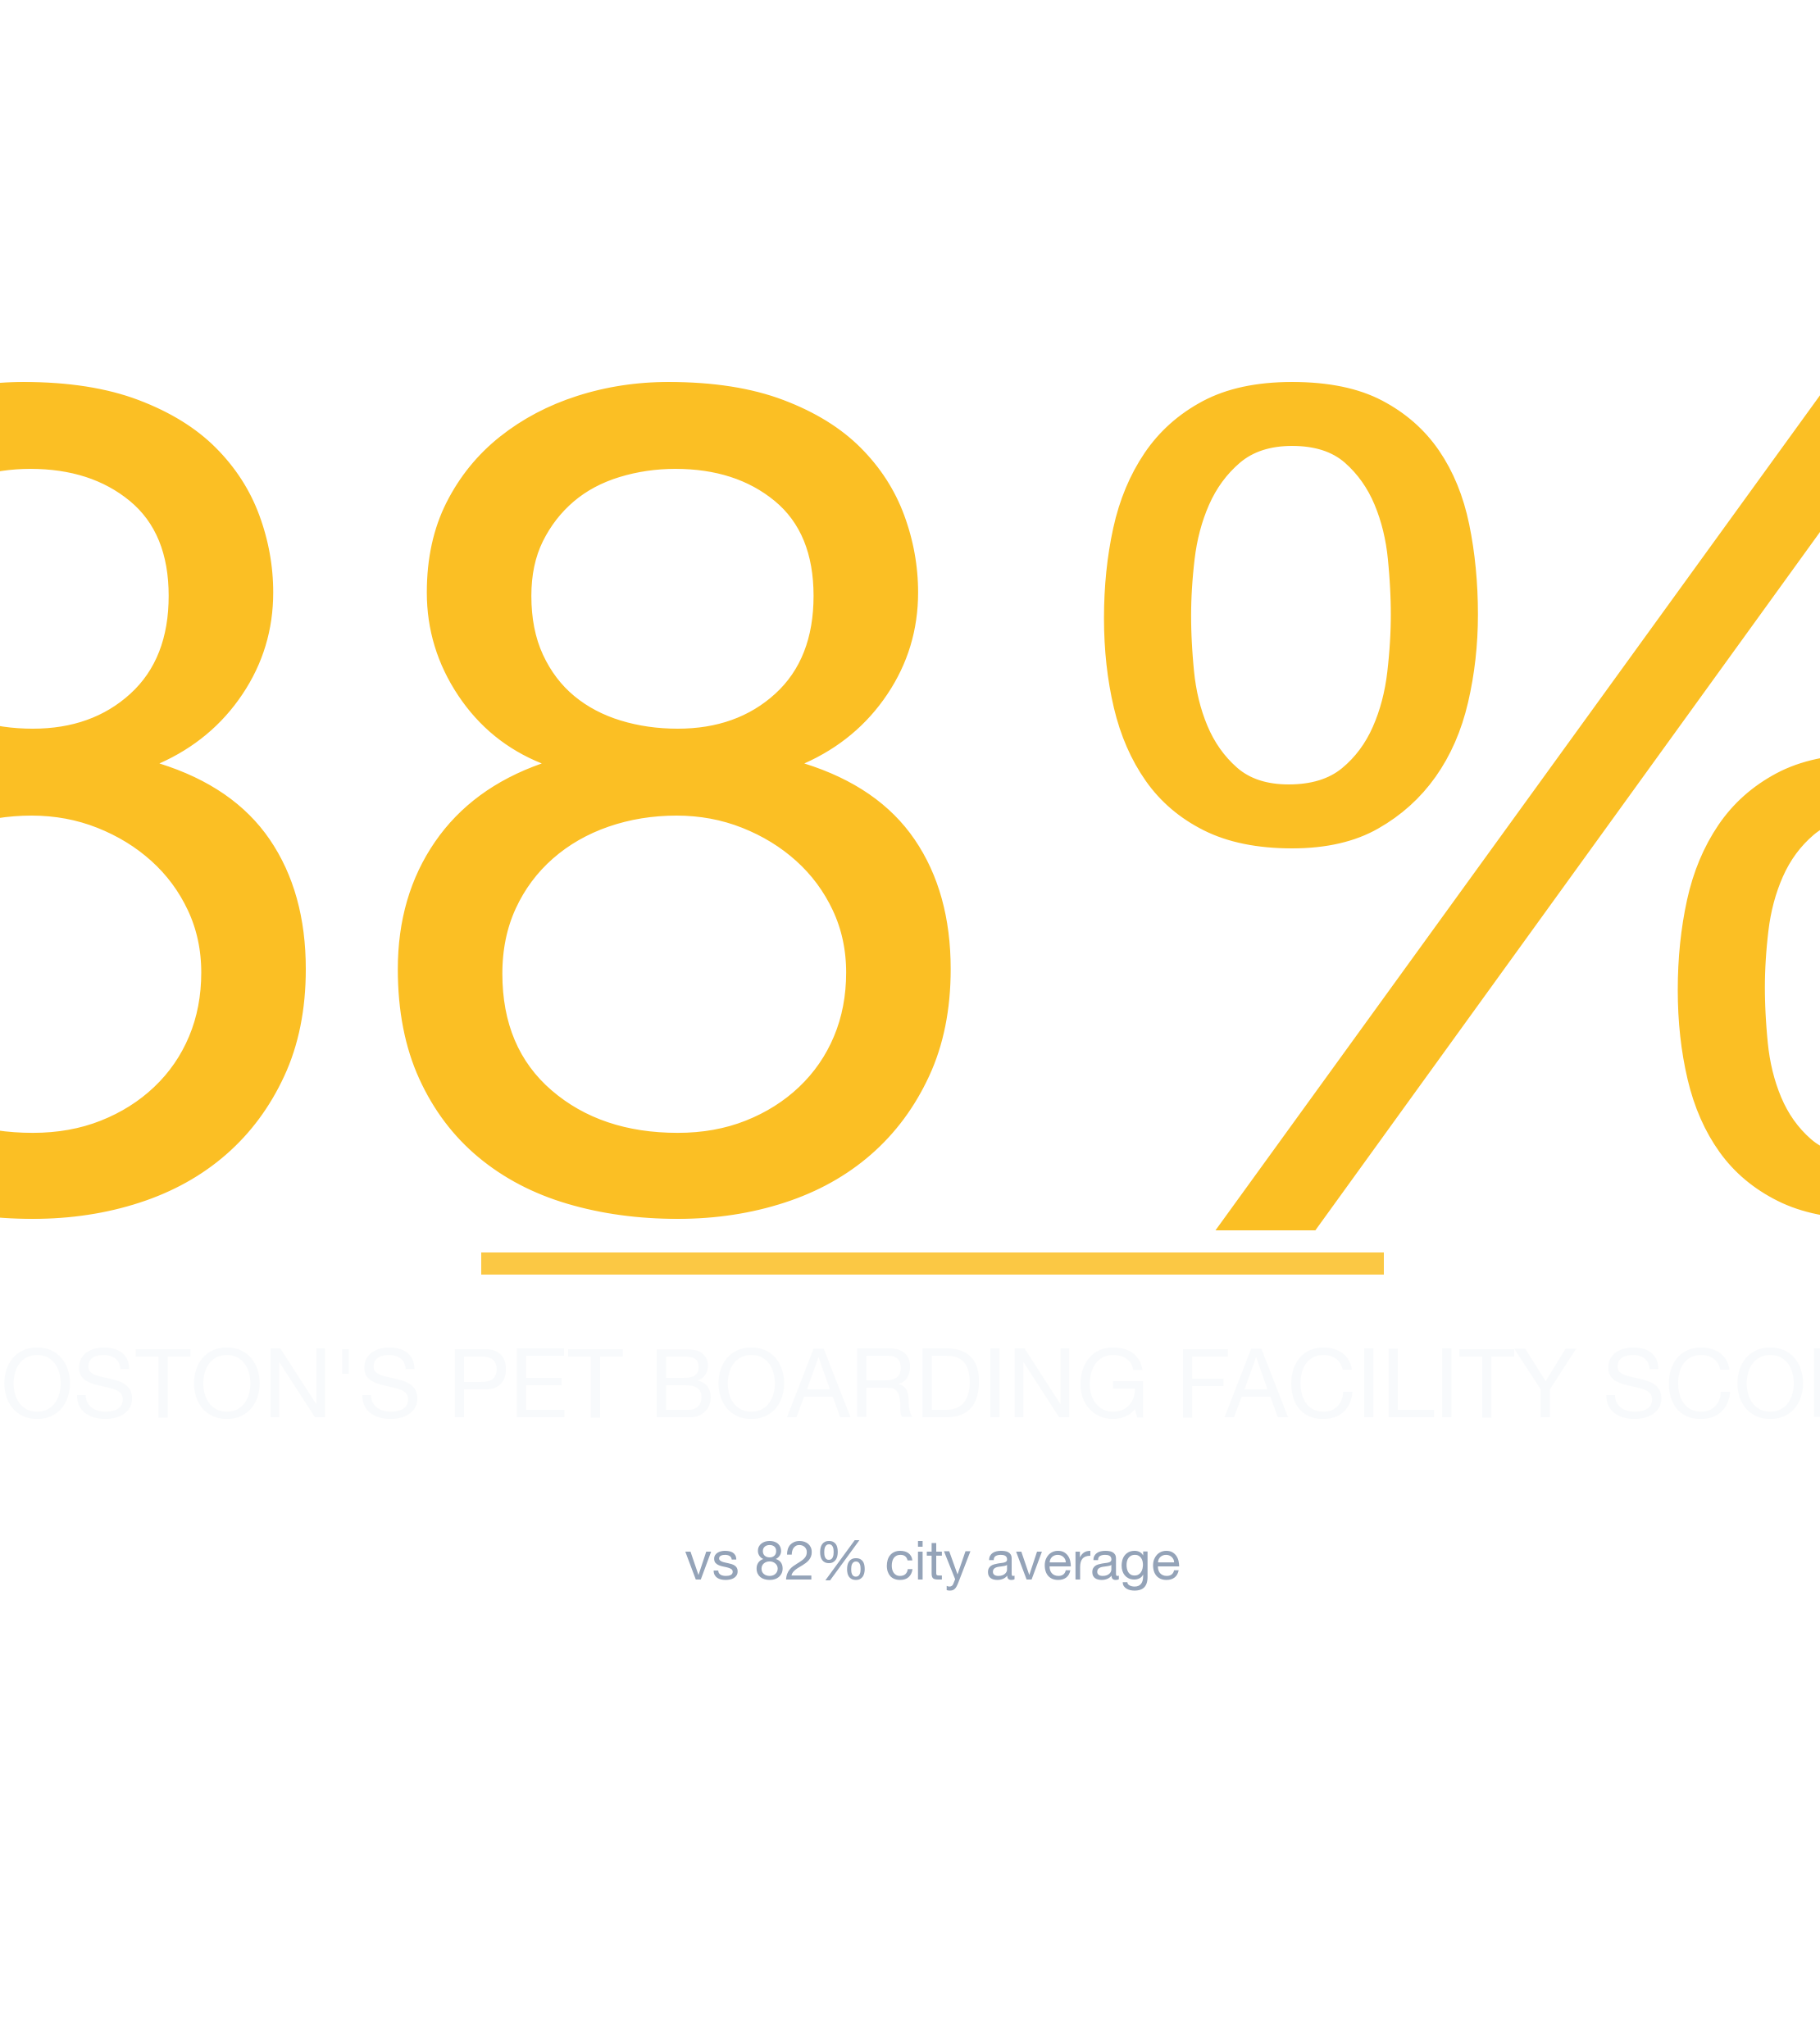
- #1 Neighborhood: Boston — 88% average survivability for Pet Boarding Facility
- Neighborhoods at or above 70%: 88 of 88 analyzed
- City-wide average: 82% for Pet Boarding Facilities
- Most challenging area: Winchester at 74%
- Revenue advantage (top vs. avg location): ~8.3% more expected revenue in Boston
- Data freshness: 2026 data · Full methodology →
Table of Contents
- Summary
- 10 Best Neighborhoods
- Where Would a Pet Boarding Facility Make the Most Money?
- What Should I Consider?
- Where Should I Start?
- FAQ: Best Neighborhoods
- FAQ: Can a Pet Boarding Facility Succeed in Lower-Ranked Areas?
- FAQ: How Often Are Rankings Updated?
- FAQ: Is a Pet Boarding Facility a Good Tenant?
- Landlord Survivability Data
- Best Neighborhoods for Any Business
Summary
StreetSpring's 2026 analysis shows the best neighborhood in and around Boston to open a Pet Boarding Facility is Boston with 88% average chance of surviving more than 2 years, with the best locations offering 94% and the most challenging locations in Boston at 78%. The worst neighborhoods include Winchester with 74% average chance. Remember that a neighborhood average smooths over wide variation — your exact block could significantly outperform.
Which Boston Neighborhoods Are Strongest for Pet Boarding Facilities?
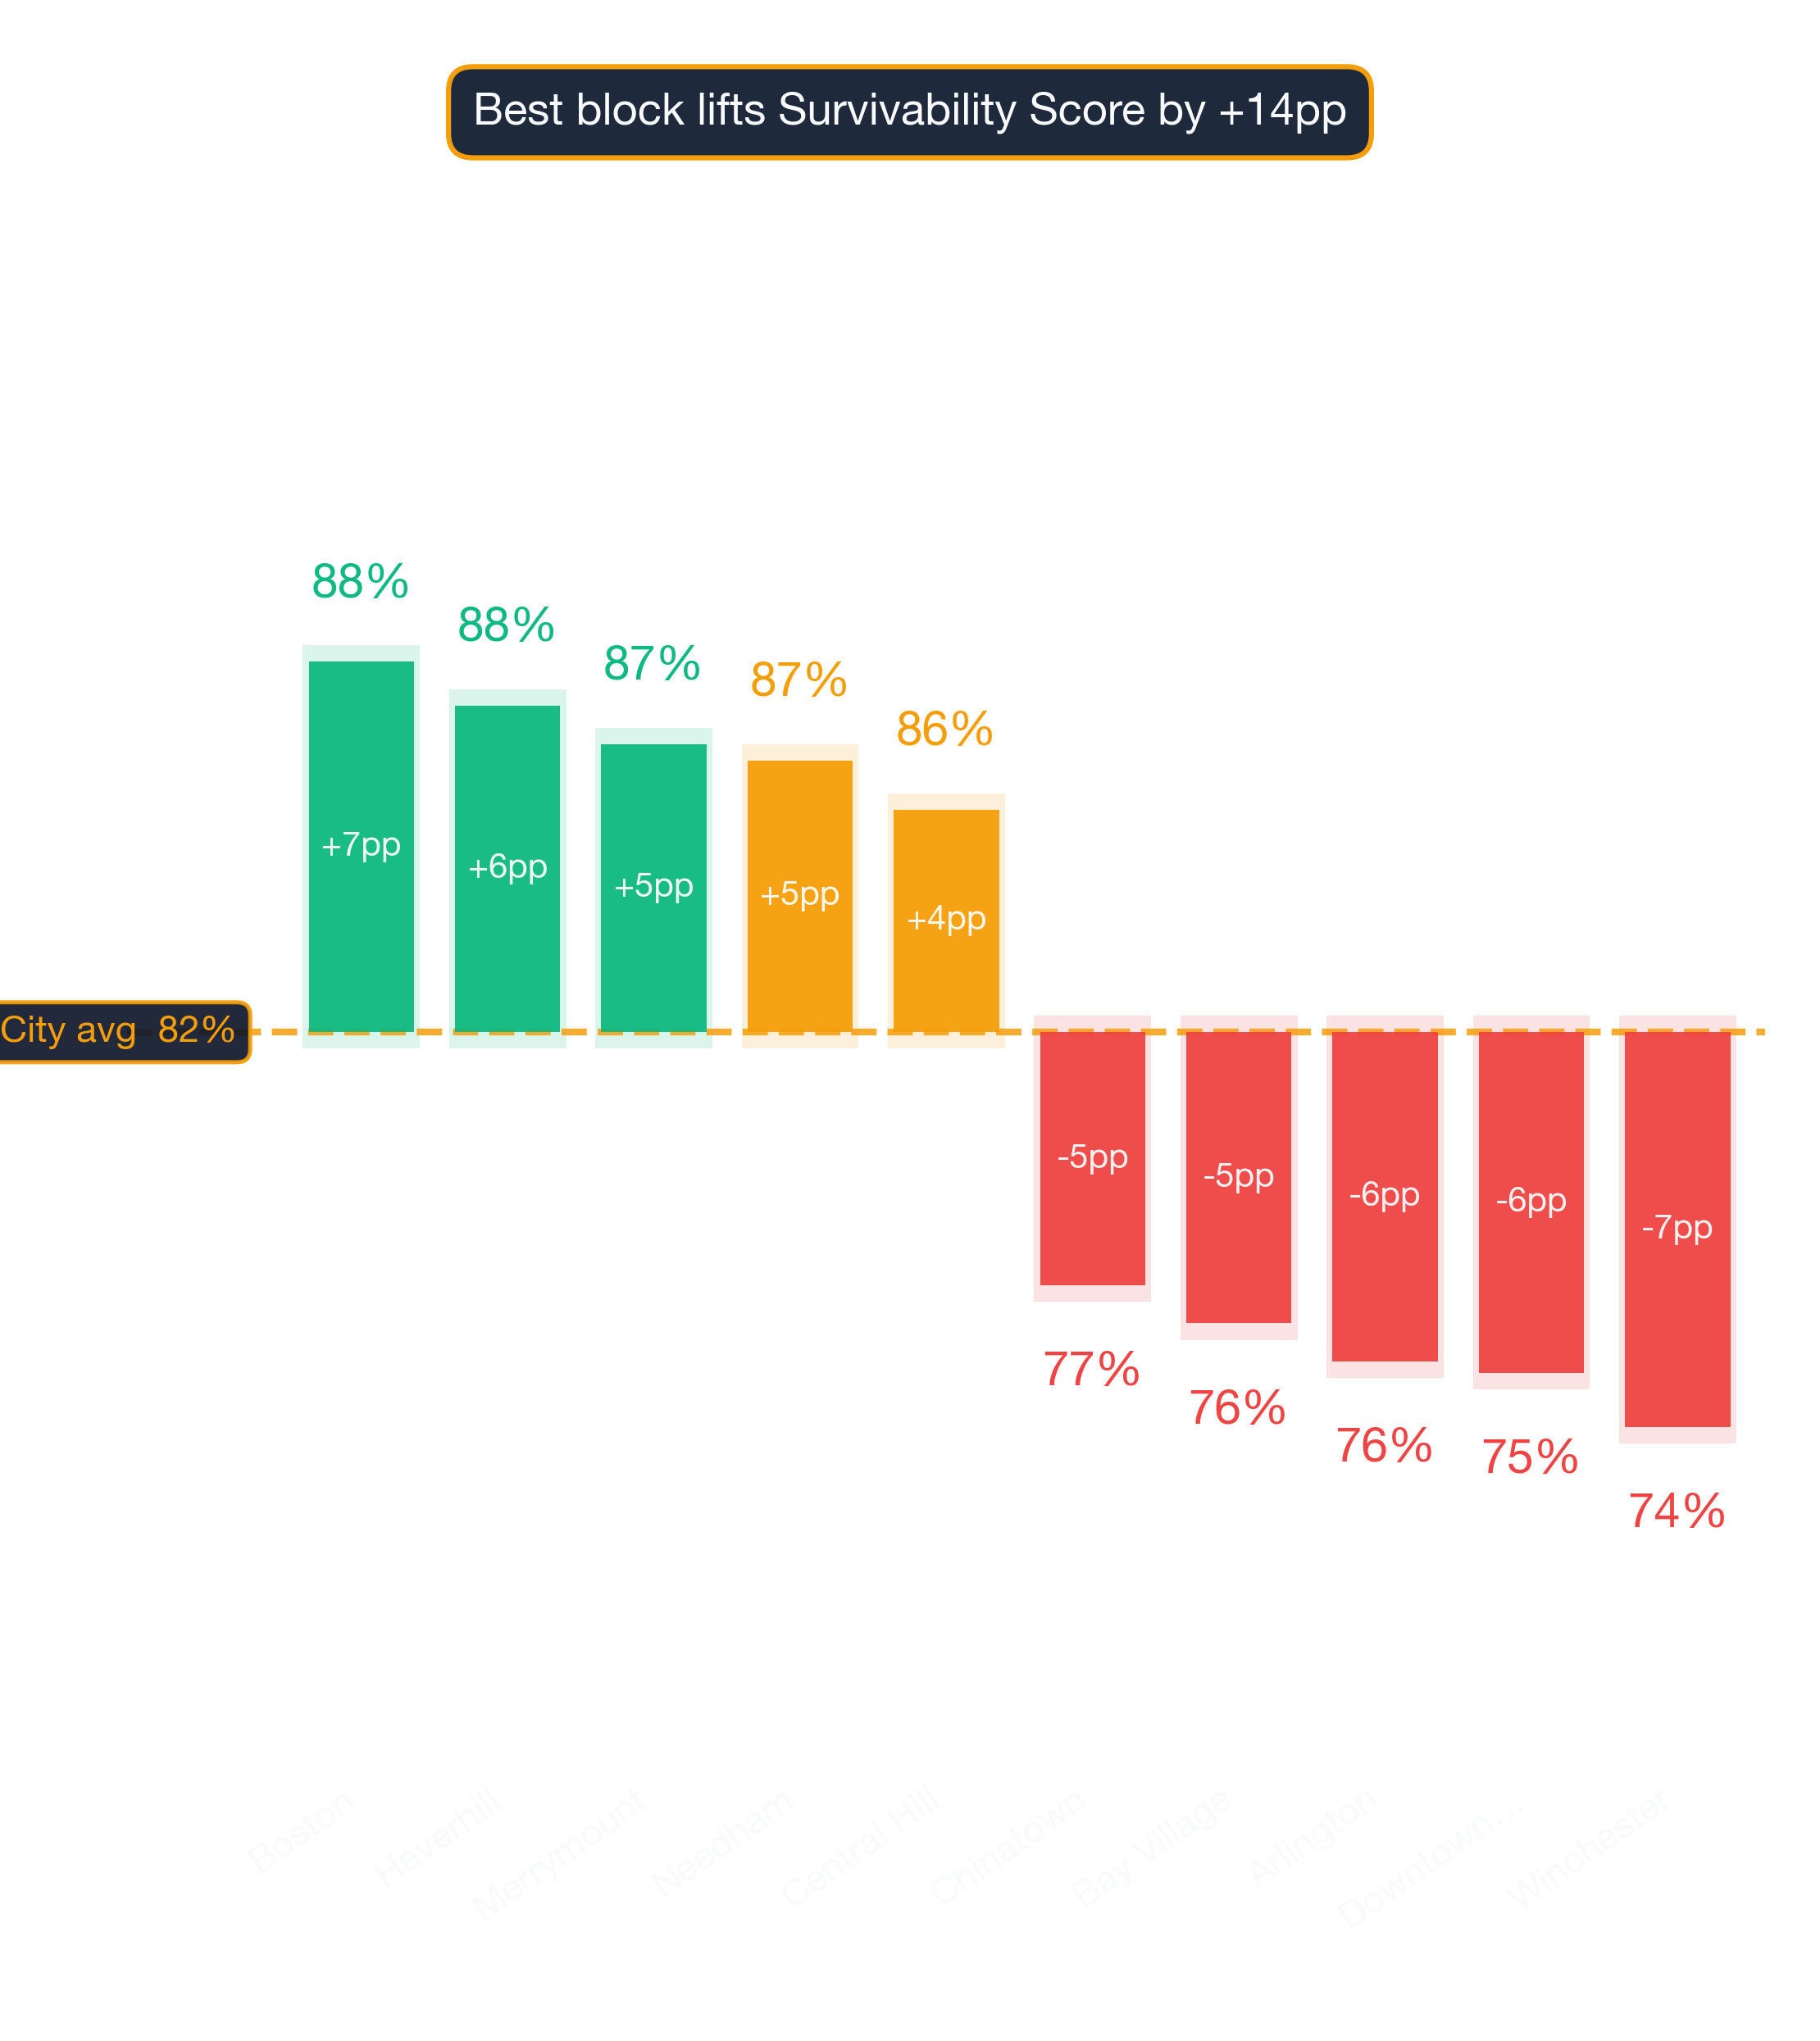
Boston ranks #1 of 88 neighborhoods analyzed in and around Boston for Pet Boarding Facility survivability with a score of 88% as of 2026. The top 10 neighborhoods are:
Why these rankings reflect real survival outcomes
| Rank | Neighborhood | Best Locations | Average Locations | Challenging Locations |
|---|---|---|---|---|
| 1 | Boston | 91.0% – 95.0% | 86.6% – 90.4% | 77.0% – 81.0% |
| 2 | Haverhill | 94.0% – 97.0% | 85.8% – 89.6% | 62.0% – 66.0% |
| 3 | Merrymount | 90.0% – 94.0% | 85.1% – 88.9% | 75.0% – 79.0% |
| 4 | Needham | 94.0% – 97.0% | 84.8% – 88.6% | 65.0% – 69.0% |
| 5 | Methuen | 93.0% – 97.0% | 83.9% – 87.7% | 66.0% – 70.0% |
| 6 | Central Hill | 87.0% – 91.0% | 83.9% – 87.7% | 81.0% – 85.0% |
| 7 | Medfield | 94.0% – 97.0% | 83.9% – 87.7% | 61.0% – 65.0% |
| 8 | Aggasiz - Harvard North | 85.0% – 89.0% | 83.8% – 87.7% | 81.0% – 85.0% |
| 9 | Dover | 94.0% – 97.0% | 83.7% – 87.6% | 65.0% – 69.0% |
| 10 | Spring Hill | 85.0% – 89.0% | 83.6% – 87.5% | 82.0% – 86.0% |
How rent and competition shape the leaderboard
Remember that a neighborhood average smooths over wide variation — your exact block could significantly outperform. Static rankings provide a useful baseline, but the live tool captures changes that have occurred since publication.
Survivability ranges reflect best and worst storefront conditions within each neighborhood. See our full methodology →
Try StreetSpring to see if this location is still the best and see if there are locations to rent in this area right now.
The Top Revenue Neighborhoods for Pet Boarding Facilities in Boston
In Boston, the best possible location offers the opportunity of making ~8.3% more than the average location in or around Boston.
On the other hand, in Winchester, the worst possible location could result in making ~8.9% less than the average location in the city.
Where you open matters more than anything else. Opening a Pet Boarding Facility in Boston requires careful location choice. Across 88 neighborhoods analyzed, the overall average survival chance for a new Pet Boarding Facility is 82% for lasting more than 2 years — due to a combination of many factors across competition, consumer spending, and location dynamics. What makes a location ideal varies by business type — foot traffic patterns, competitor proximity, and consumer demographics all play different roles.
Key Considerations Before Opening a Pet Boarding Facility in Boston
The strongest predictor of whether this business survives two years is the quality of the location you pick — Survivability Score quantifies exactly that. Of all the variables StreetSpring analyzes, Revenue Capture Score has the strongest predictive power. StreetSpring computes this by projecting the business's market share, which is based on the quality and quantity of primary, secondary, and tertiary competitors. StreetSpring's training dataset includes millions of transactions and business lifecycle events. Some competition is beneficial to attract customers with similar intents to the same area. StreetSpring uses its own proprietary forecasting tools to make these predictions.
| Area to check | What can go wrong | How to de-risk it |
|---|---|---|
| Insurance + compliance | General liability quoted at a starter rate, then jumping 2-3x once you add property + workers' comp + business interruption. | Get binding quotes from 2 insurers before signing the lease. Most landlords require minimum coverage levels — read those terms first. |
| CAM + hidden costs | Stated rent looks great, then CAM fees, signage charges, and after-hours utilities add 15-30%. | Get the full operating expense breakdown for the past 2 years. Ask which costs are landlord-capped vs. uncapped. |
| Outdoor seating / sidewalk use | Signing assuming you can add patio seating, then learning the city requires a separate sidewalk-cafe permit with long lead times. | Check the city's sidewalk-cafe permit process up front. Confirm landlord allows outdoor build-out in the lease language. |
This can be summarized as:
Revenue Capture Score = Projected Market Share × Forecasted Spend on Specific Business
Related: Survivability Score: How We Calculate It & Why It Matters
StreetSpring recalculates survivability using the latest competitive, demographic, and walkability data. Neighborhood rankings are useful, but the exact odds for your location can only be seen by running a current survivability check in StreetSpring.
The Best Place to Start a Pet Boarding Facility in Boston
Our data ranks the top-performing neighborhoods as Boston, Haverhill, and Merrymount, while the most challenging neighborhoods would be Winchester, Downtown Crossing, and Arlington. StreetSpring's Survivability Scores are updated regularly, so the most accurate prediction for your exact storefront is always available in the live tool. For the most accurate predictions, always check your specific address in StreetSpring's live platform.
Related Articles:
Top-Survivability Boston Neighborhoods for Pet Boarding Facilities
Based on StreetSpring's 2026 analysis, the top neighborhood for a Pet Boarding Facility in Boston is Boston with 88% average survivability, followed by Haverhill and Merrymount. 88 of 88 neighborhoods analyzed exceed 70% two-year survival.
Real-time data from StreetSpring accounts for recent openings, closures, and seasonal shifts that static rankings cannot.
Do Lower-Ranked Boston Neighborhoods Still Work for Pet Boarding Facilities?
Yes — neighborhood averages mask significant block-by-block variation. Even in neighborhoods ranked outside the top 10, individual storefronts with strong foot traffic, low direct competition, and favorable lease terms can outperform the area average. Neighborhood averages mask significant block-by-block variation — always check your specific address. Always check your specific address in StreetSpring's live platform for the most accurate prediction.
When Does StreetSpring Update Boston Pet Boarding Facility Rankings?
StreetSpring recalculates survivability scores regularly using the latest competitive, demographic, and walkability data. Rankings are updated quarterly; the live tool always reflects the most current predictions for any address in Boston.
Is a Pet Boarding Facility a Good Tenant for Boston Landlords?
In Boston, StreetSpring forecasts a 86.6% – 90.4% average chance for a new Pet Boarding Facility to survive more than 2 years, depending on the exact storefront. Check the current Survivability Score for any address instantly.
Landlord Survivability Data for Pet Boarding Facility in Boston
Reducing vacancy starts with choosing tenants whose business type matches the neighborhood's strengths. For Pet Boarding Facility tenants, Boston provides the best survivability conditions (86.6% – 90.4%). Haverhill and Merrymount also show viable averages at 85.8% – 89.6% and 85.1% – 88.9% respectively. Get a live Survivability Score for your specific storefront at no cost.
StreetSpring delivers address-level predictions, showing how likely hundreds of different businesses are to last at that exact spot.
Related: How Landlord Representatives Can Reduce Vacancy & Increase Tenant Longevity
Where Pet Boarding Facilities Thrive in Boston
You can see the best neighborhoods in or around Boston to open any type of business in our article Neighborhood Survivability Rankings: Boston.
Technical note: Aggregated survivability rankings for Boston are available in machine-readable format for research and integration purposes.
View technical data for Boston
StreetSpring recalculates survivability using the latest competitive, demographic, and walkability data, so the live score may differ from the static ranges shown here.
Visual Data
Related Resources
Same business type in other cities:
Related:
Related:
- Survivability Rankings for Acupuncture Clinic in Atlanta
- Survivability Rankings for Afghan Restaurant in Atlanta
Local Context FAQ
Further questions, with answers anchored on this neighborhood's actual data.
How important is foot traffic / accessibility for a Pet Boarding Facility in Boston?
Median Boston commute is ~32 minutes. Accessibility-driven foot-traffic variation contributes to the 47-93% survivability range Pet Boarding Facilities see across the metro.
Which US cities have the highest survivability for Pet Boarding Facilities?
Per StreetSpring's 24-metro model, the top three US cities for Pet Boarding Facilities survivability are Portland, San Antonio, Phoenix. Boston ranks #21, averaging 76%.
Where should an aspiring Boston Pet Boarding Facility owner focus first?
The address you sign for. Across Boston, Pet Boarding Facilities score 47-93% depending on location — a 46-point spread that captures competitive density, demographic fit, accessibility, and visibility at each storefront.
What goes into a StreetSpring survivability score for Pet Boarding Facilities?
Each Pet Boarding Facilities survivability score in Boston (averaging 76%) reflects ~100 factors per address: competitor counts at multiple radii, demographics, accessibility, rent, and historical outcomes. The model is recalibrated quarterly against 500K+ business outcomes nationally.