Survivability Rankings for Diner in Boston
StreetSpring's 2026 analysis ranks the best and worst neighborhoods in Boston to open a Diner, from Boston (88% survival) to Downtown Crossing (73%).
By Bobby Koons | Last reviewed by Bobby Koons on April 24, 2026 | Methodology
Quick Summary
- #1 Neighborhood: Boston — 88% average survivability for Diner
- Neighborhoods at or above 70%: 88 of 88 analyzed
- City-wide average: 81% for Diners
- Most challenging area: Downtown Crossing at 73%
- Revenue advantage (top vs. avg location): ~8.6% more expected revenue in Boston
- Data freshness: 2026 data · Full methodology →
Table of Contents
- Summary
- 10 Best Neighborhoods
- Where Would a Diner Make the Most Money?
- What Should I Consider?
- Where Should I Start?
- FAQ: Best Neighborhoods
- FAQ: Can a Diner Succeed in Lower-Ranked Areas?
- FAQ: How Often Are Rankings Updated?
- FAQ: Is a Diner a Good Tenant?
- Landlord Survivability Data
- Best Neighborhoods for Any Business
Summary
StreetSpring's 2026 analysis shows the best neighborhood in and around Boston to open a Diner is Boston with 88% average chance of surviving more than 2 years, with the best locations offering 93% and the most challenging locations in Boston at 77%. The worst neighborhoods include Downtown Crossing with 73% average chance. These rankings are based on the latest available data; check StreetSpring for real-time updates.
Top-Survivability Boston Neighborhoods for Diners
Boston ranks #1 of 88 neighborhoods analyzed in and around Boston for Diner survivability with a score of 88% as of 2026. The top 10 neighborhoods are:
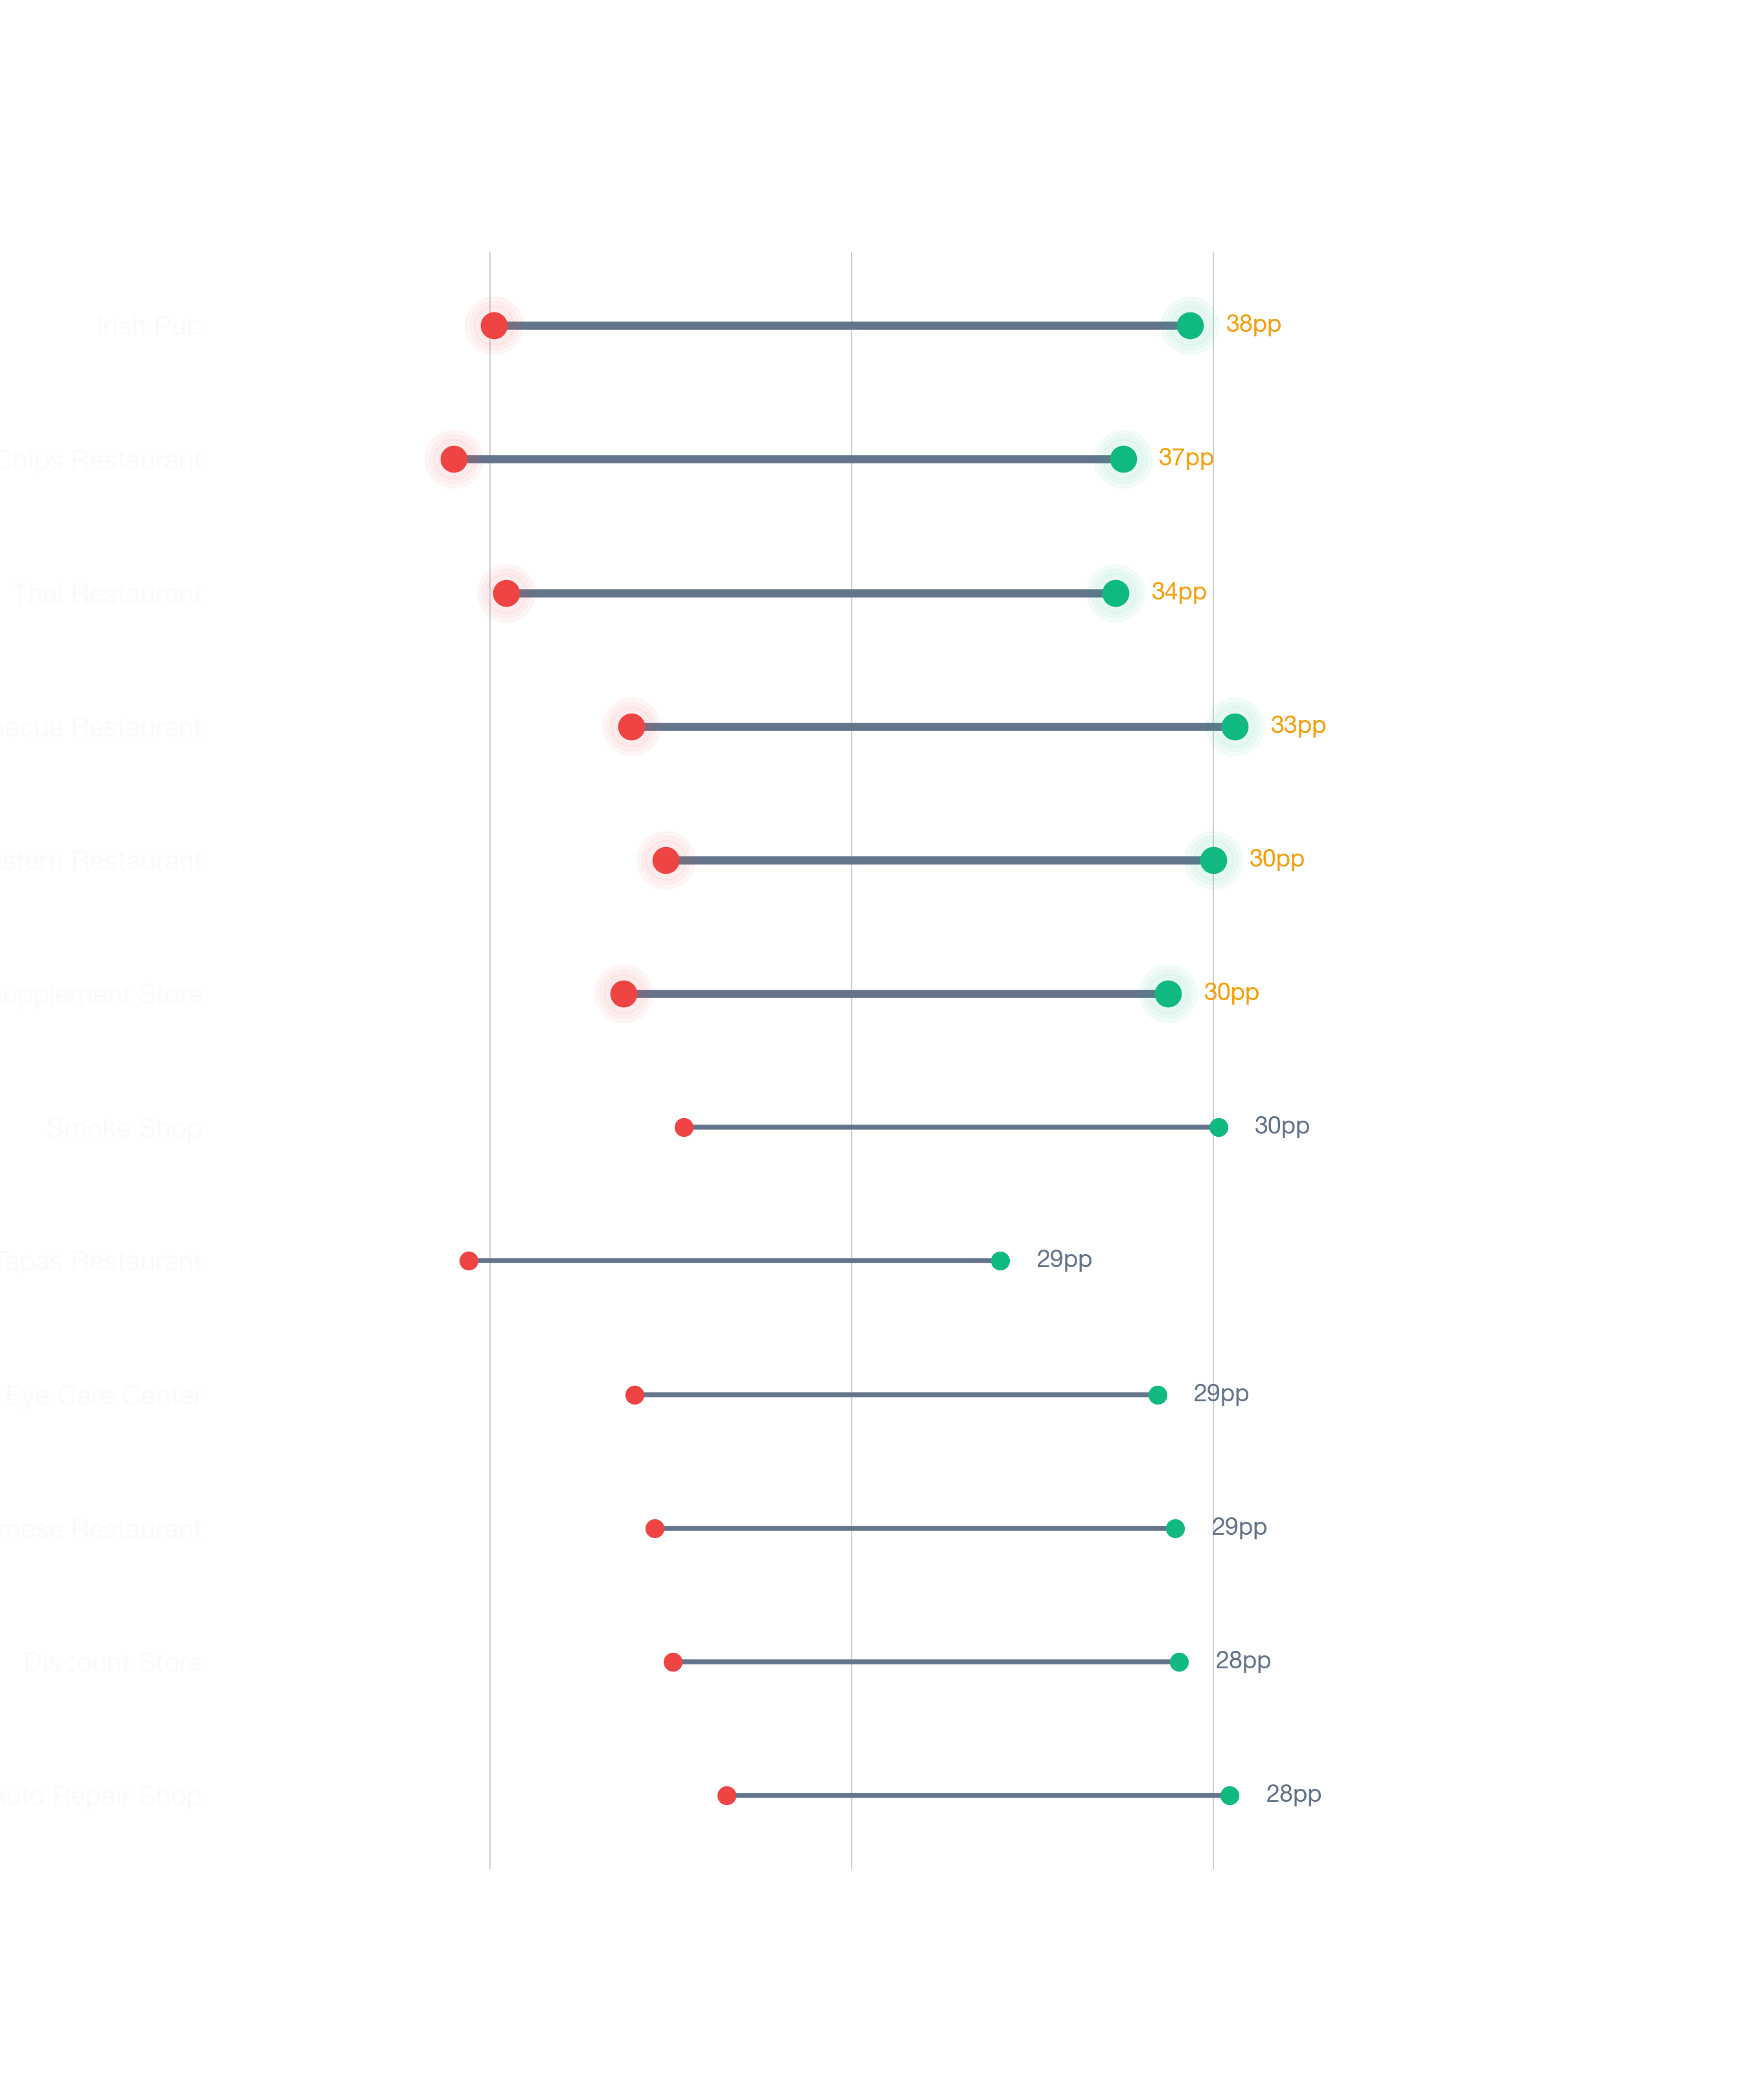
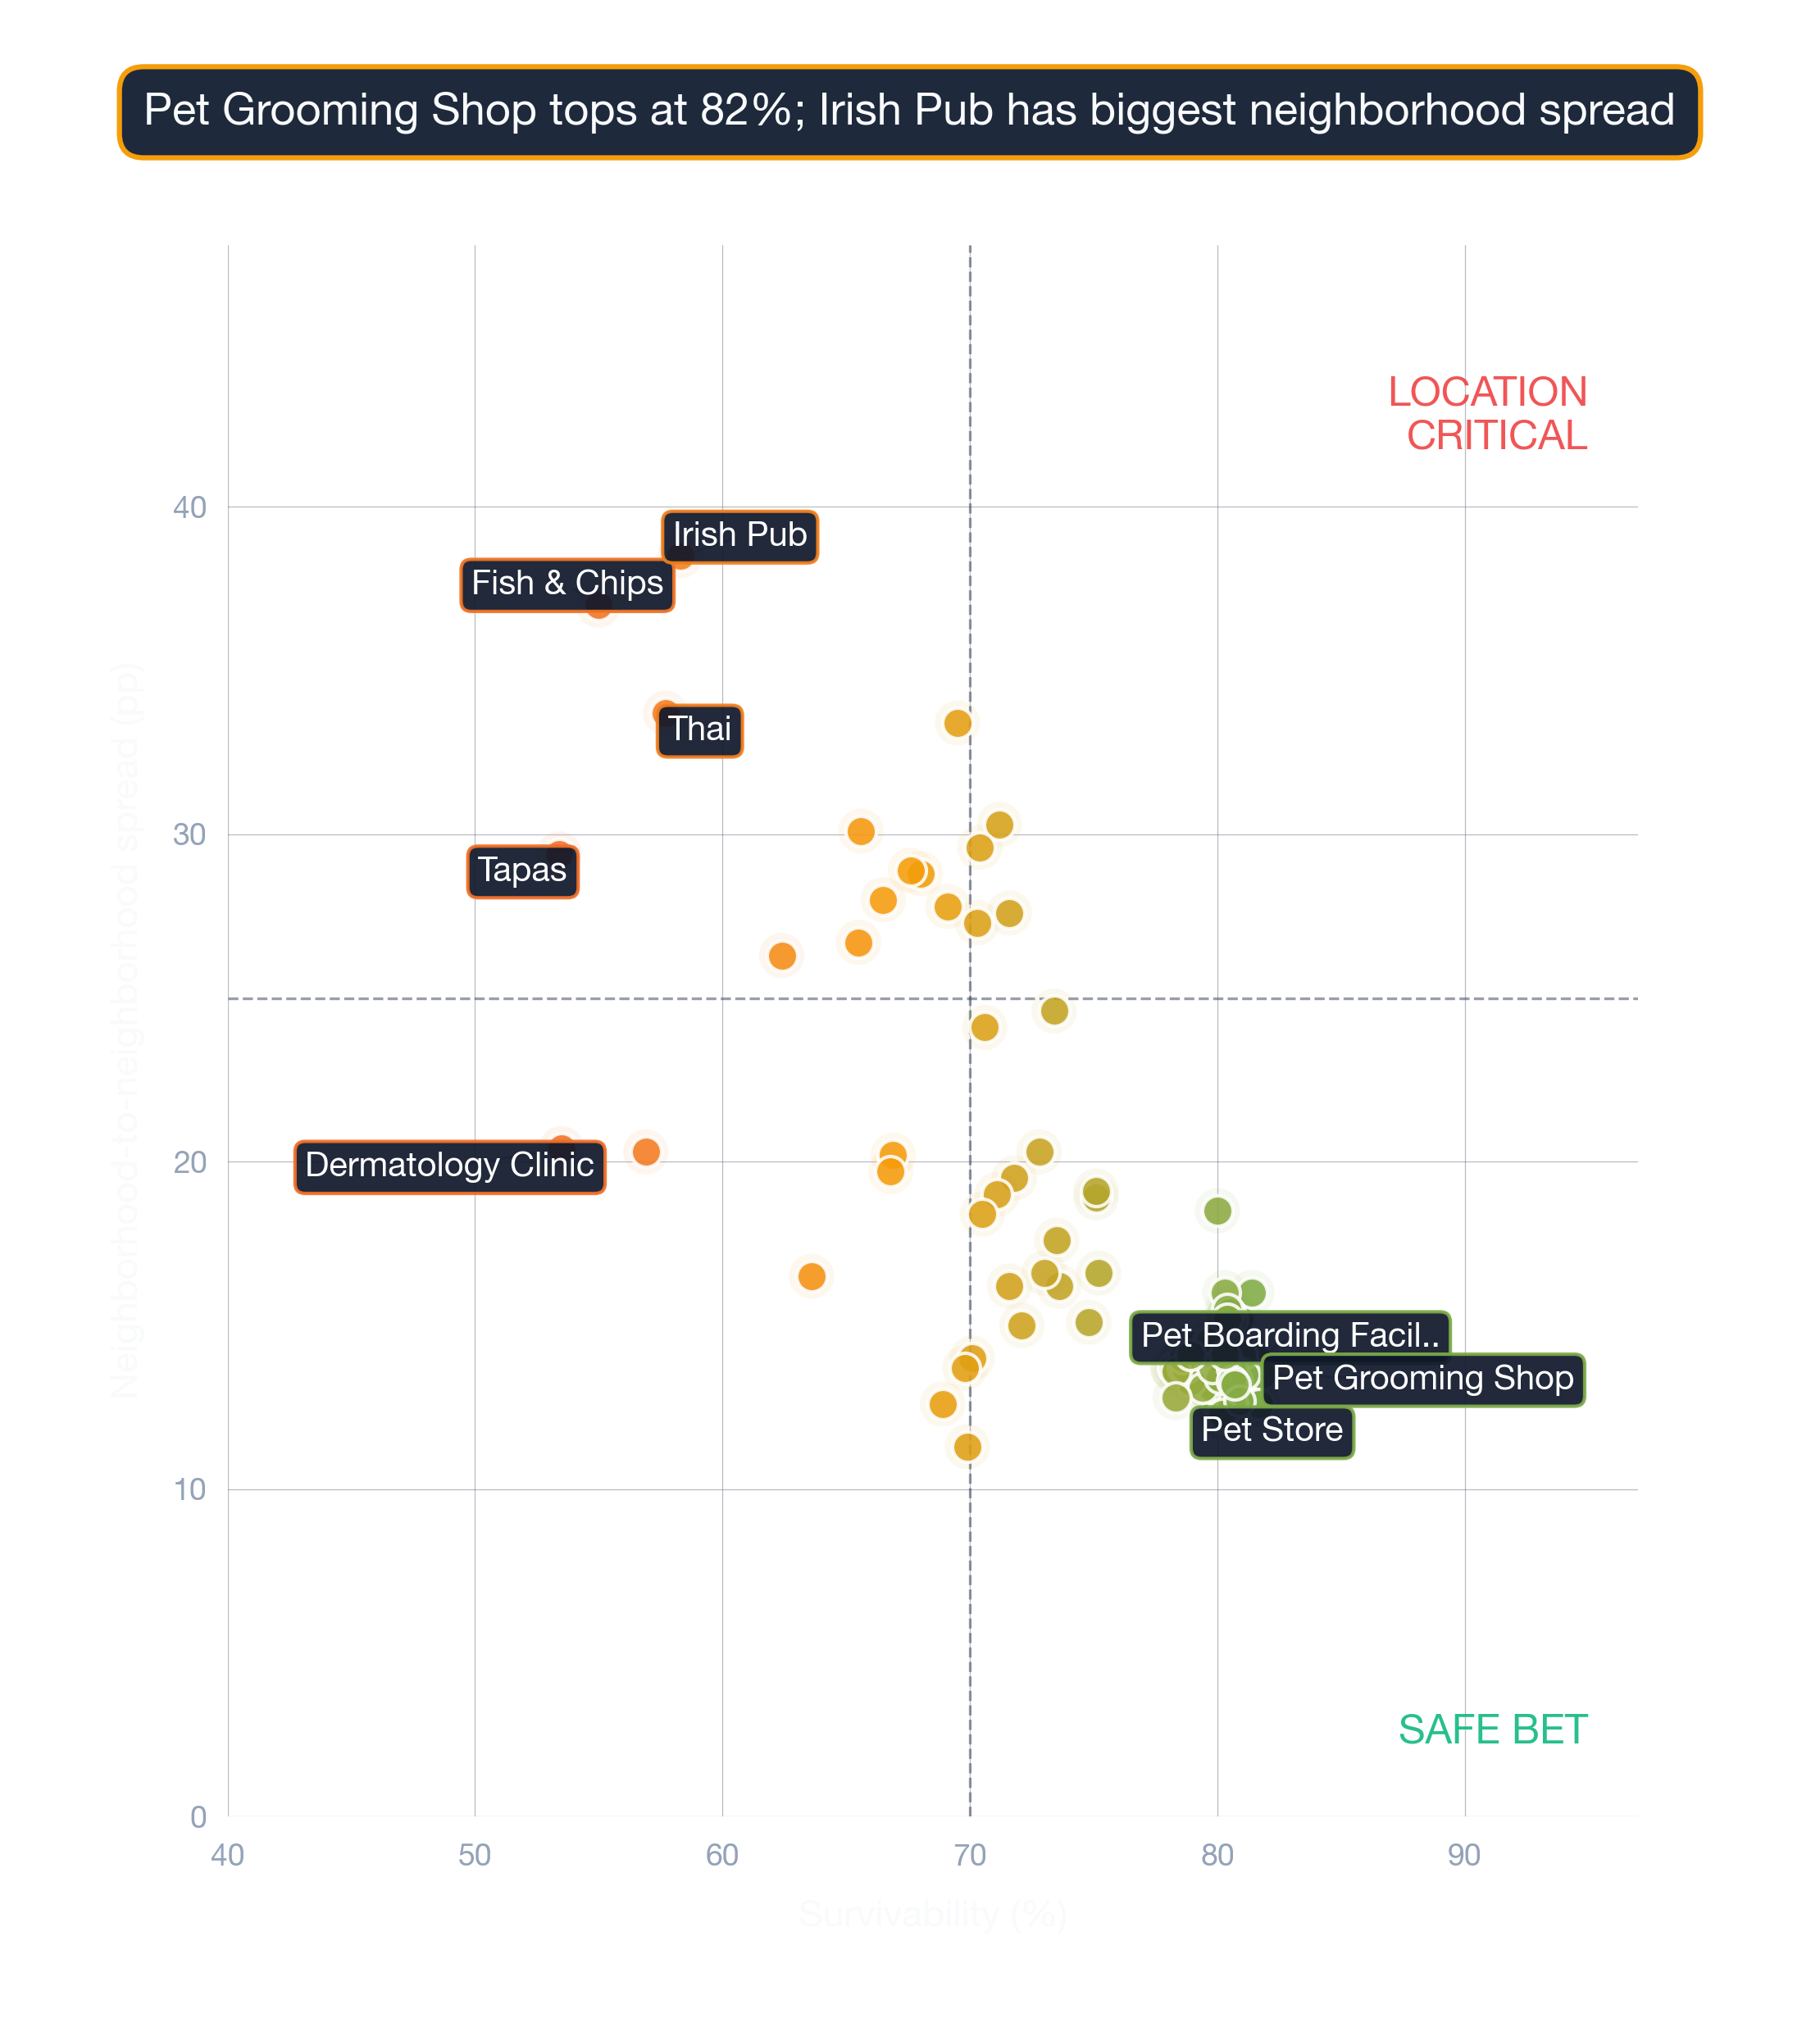
Reading the gap between #1 and #10
| Rank | Neighborhood | Best Locations | Average Locations | Challenging Locations |
|---|---|---|---|---|
| 1 | Boston | 90.0% – 94.0% | 86.1% – 90.1% | 76.0% – 80.0% |
| 2 | Haverhill | 95.0% – 97.0% | 85.8% – 89.7% | 67.0% – 71.0% |
| 3 | Spring Hill | 87.0% – 91.0% | 85.0% – 89.0% | 83.0% – 87.0% |
| 4 | Merrymount | 90.0% – 94.0% | 84.8% – 88.8% | 76.0% – 80.0% |
| 5 | Porter Square | 85.0% – 89.0% | 84.8% – 88.7% | 80.0% – 84.0% |
| 6 | Medfield | 95.0% – 97.0% | 84.3% – 88.2% | 61.0% – 65.0% |
| 7 | Dover | 94.0% – 97.0% | 84.0% – 88.0% | 64.0% – 68.0% |
| 8 | Methuen | 94.0% – 97.0% | 83.8% – 87.8% | 66.0% – 70.0% |
| 9 | Revere | 94.0% – 97.0% | 83.7% – 87.7% | 66.0% – 70.0% |
| 10 | Adams Shore | 92.0% – 96.0% | 83.5% – 87.5% | 74.0% – 78.0% |
Notable runners-up worth a second look
A low-ranking neighborhood can still contain high-potential storefronts — the address matters most. Because local conditions evolve weekly, the live survivability tool offers a more current snapshot than any published ranking.
Survivability ranges reflect best and worst storefront conditions within each neighborhood. See our full methodology →
Try StreetSpring to see if this location is still the best and see if there are locations to rent in this area right now.
Boston's Best-Earning Neighborhoods for Diners
In Boston, the best possible location offers the opportunity of making ~8.6% more than the average location in or around Boston.
On the other hand, in Downtown Crossing, the worst possible location could result in making ~10.2% less than the average location in the city.
Nothing influences a business's future more than its location. Opening a Diner in Boston requires careful location choice. Across 88 neighborhoods analyzed, the overall average survival chance for a new Diner is 81% for lasting more than 2 years — due to a combination of many factors across competition, consumer spending, and location dynamics. Survivability predictions are business-type-specific because consumer behavior differs fundamentally across categories.
What to Think About When Launching a Diner in Boston
The right address sets the ceiling on every other variable. Filtering candidate locations by Survivability Score first protects against the most common cause of business failure. Revenue Capture Score matters more than any other single metric when predicting business outcomes. StreetSpring computes this by projecting the business's market share, which is based on the quality and quantity of primary, secondary, and tertiary competitors. StreetSpring has analyzed hundreds of thousands of business outcomes across major US metros. Our data shows that businesses in moderately competitive clusters survive longer than isolated storefronts on average. Our proprietary models incorporate data sources not available through any public platform.
| Factor | Where new owners get tripped up | Questions to ask before you sign |
|---|---|---|
| Anchor co-tenancy | Signing next to a high-traffic anchor that closes 6 months later, leaving you orphaned. | Ask for a co-tenancy clause — rent abatement or termination right if the anchor leaves. Standard for strong markets. |
| CAM + hidden costs | Stated rent looks great, then CAM fees, signage charges, and after-hours utilities add 15-30%. | Get the full operating expense breakdown for the past 2 years. Ask which costs are landlord-capped vs. uncapped. |
| Lease term | Locking into 7-10 years without break clauses, then needing to relocate after year 2. | Negotiate a relocation or termination clause. Confirm assignment + sublease rights are in writing. |
This can be summarized as:
Revenue Capture Score = Projected Market Share × Forecasted Spend on Specific Business
Related: Survivability Score: How We Calculate It & Why It Matters
StreetSpring recalculates survivability using the latest competitive, demographic, and walkability data. Market dynamics shift frequently; validate these insights with real-time data from StreetSpring.
Where to Launch a Diner in or Around Boston
According to StreetSpring's data, optimal neighborhoods include Boston, Haverhill, and Spring Hill, while the most challenging neighborhoods would be Downtown Crossing, Winchester, and Arlington. These averages are directional, not definitive; the best decision comes from analyzing your specific storefront. Market dynamics shift frequently; validate these insights with real-time data from StreetSpring.
Related Articles:
- Business Survivability Rankings: Boston
- Neighborhood Survivability Rankings: Boston
- National City Survivability: Diner
Where Diners Thrive in Boston
Based on StreetSpring's 2026 analysis, the top neighborhood for a Diner in Boston is Boston with 88% average survivability, followed by Haverhill and Spring Hill. 88 of 88 neighborhoods analyzed exceed 70% two-year survival.
Real-time data from StreetSpring accounts for recent openings, closures, and seasonal shifts that static rankings cannot.
Should You Consider Lower-Survivability Areas of Boston for a Diner?
Yes — neighborhood averages mask significant block-by-block variation. Even in neighborhoods ranked outside the top 10, individual storefronts with strong foot traffic, low direct competition, and favorable lease terms can outperform the area average. These averages are directional, not definitive; the best decision comes from analyzing your specific storefront. Always check your specific address in StreetSpring's live platform for the most accurate prediction.
When Does StreetSpring Update Boston Diner Rankings?
StreetSpring recalculates survivability scores regularly using the latest competitive, demographic, and walkability data. Rankings are updated quarterly; the live tool always reflects the most current predictions for any address in Boston.
Is a Diner a Good Tenant for Boston Landlords?
In Boston, StreetSpring forecasts a 86.1% – 90.1% average chance for a new Diner to survive more than 2 years, depending on the exact storefront. Check the current Survivability Score for any address instantly.
Landlord Survivability Data for Diner in Boston
Reducing vacancy starts with choosing tenants whose business type matches the neighborhood's strengths. For Diner tenants, Boston provides the best survivability conditions (86.1% – 90.1%). Haverhill and Spring Hill also show viable averages at 85.8% – 89.7% and 85.0% – 89.0% respectively. See which business types are most likely to succeed at your property address right now.
StreetSpring analyzes your specific address against comparable businesses to forecast success.
Related: How Landlord Representatives Can Reduce Vacancy & Increase Tenant Longevity
What Are the Best Neighborhoods in Boston to Open a Diner?
You can see the best neighborhoods in or around Boston to open any type of business in our article Neighborhood Survivability Rankings: Boston.
Technical note: Aggregated survivability rankings for Boston are available in machine-readable format for research and integration purposes.
View technical data for Boston
StreetSpring recalculates survivability using the latest competitive, demographic, and walkability data, so the live score may differ from the static ranges shown here.
Visual Data
Related Resources
Same business type in other cities:
Related:
Related:
Neighborhood-Specific Questions
Beyond the general FAQ — data-anchored answers for this specific location.
Where does Boston fall in national rankings for Diners?
Across 24 US metros, Boston sits at rank #22 for Diners, averaging 85% on StreetSpring's survivability scale. National range: 85-89%.
What other business types score similarly to Diners in Boston?
Per StreetSpring's Boston corpus, peers of Diners (within 2 points of the 85% average) include Bagel Shop, Salad Shop, Pizza Restaurant.
How many Boston neighborhoods has StreetSpring scored for Diners?
For Diners, the Boston model produces survivability scores from 59% (low-end neighborhoods) to 99% (top neighborhoods), averaging 85%. Each storefront address gets a precise score that reflects block-level variation.
What's the single biggest factor in survival for a Diner in Boston?
Location selection. StreetSpring's data shows a 40-point survivability gap between best- and worst-case Boston locations for Diners (59-99%). That's a larger gap than most operators can close through marketing or operations improvements.