Survivability Rankings for Dentist Office in Boston
StreetSpring's 2026 analysis ranks the best and worst neighborhoods in Boston to open a Dentist Office, from Boston (75% survival) to Winchester (62%).
By Bobby Koons | Last reviewed: May 11, 2026 | New data weekly | Methodology
Quick Summary
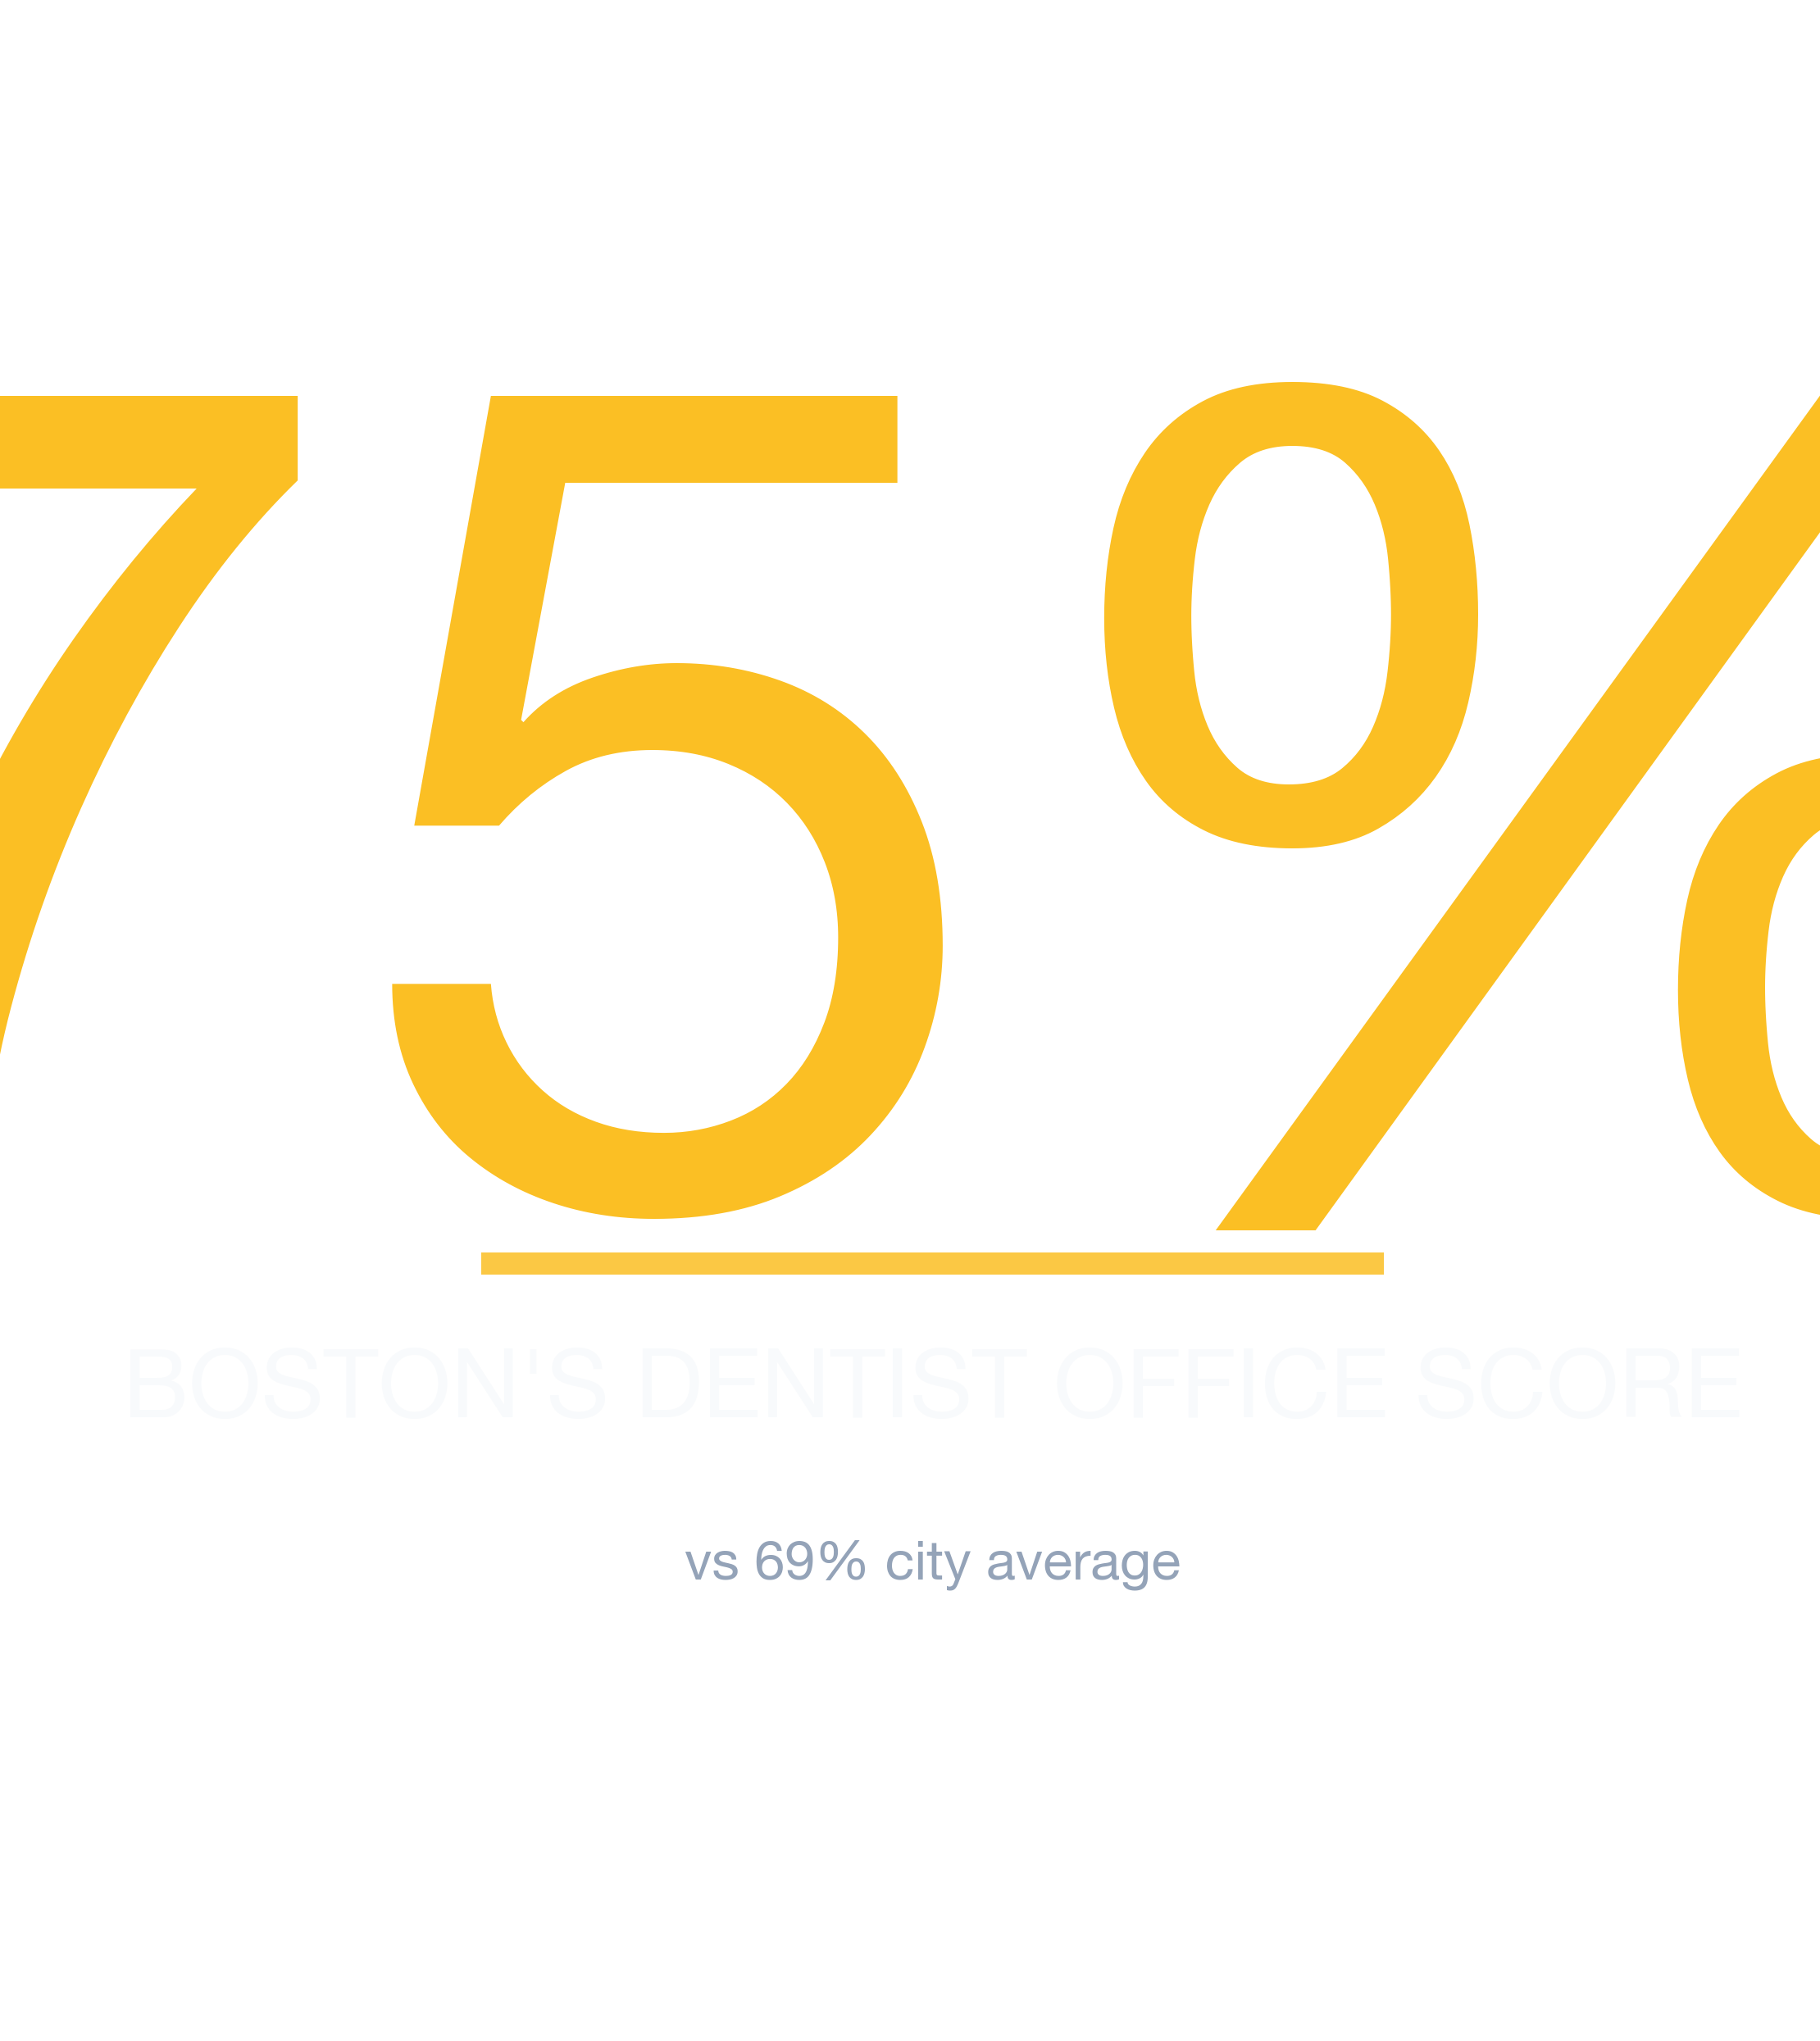
- #1 Neighborhood: Boston — 75% average survivability for Dentist Office
- Neighborhoods at or above 70%: 28 of 88 analyzed
- City-wide average: 69% for Dentist Offices
- Most challenging area: Winchester at 62%
- Revenue advantage (top vs. avg location): ~8.4% more expected revenue in Boston
- Data freshness: 2026 data · Full methodology →
Table of Contents
- Summary
- 10 Best Neighborhoods
- Where Would a Dentist Office Make the Most Money?
- What Should I Consider?
- Where Should I Start?
- FAQ: Best Neighborhoods
- FAQ: Can a Dentist Office Succeed in Lower-Ranked Areas?
- FAQ: How Often Are Rankings Updated?
- FAQ: Is a Dentist Office a Good Tenant?
- Landlord Survivability Data
- Best Neighborhoods for Any Business
Summary
StreetSpring's 2026 analysis shows the best neighborhood in and around Boston to open a Dentist Office is Boston with 75% average chance of surviving more than 2 years, with the best locations offering 79% and the most challenging locations in Boston at 60%. The worst neighborhoods include Winchester with 62% average chance. However, individual locations vary widely, and even in lower-scoring neighborhoods there are pockets that perform exceptionally well.
Where Dentist Offices Thrive in Boston
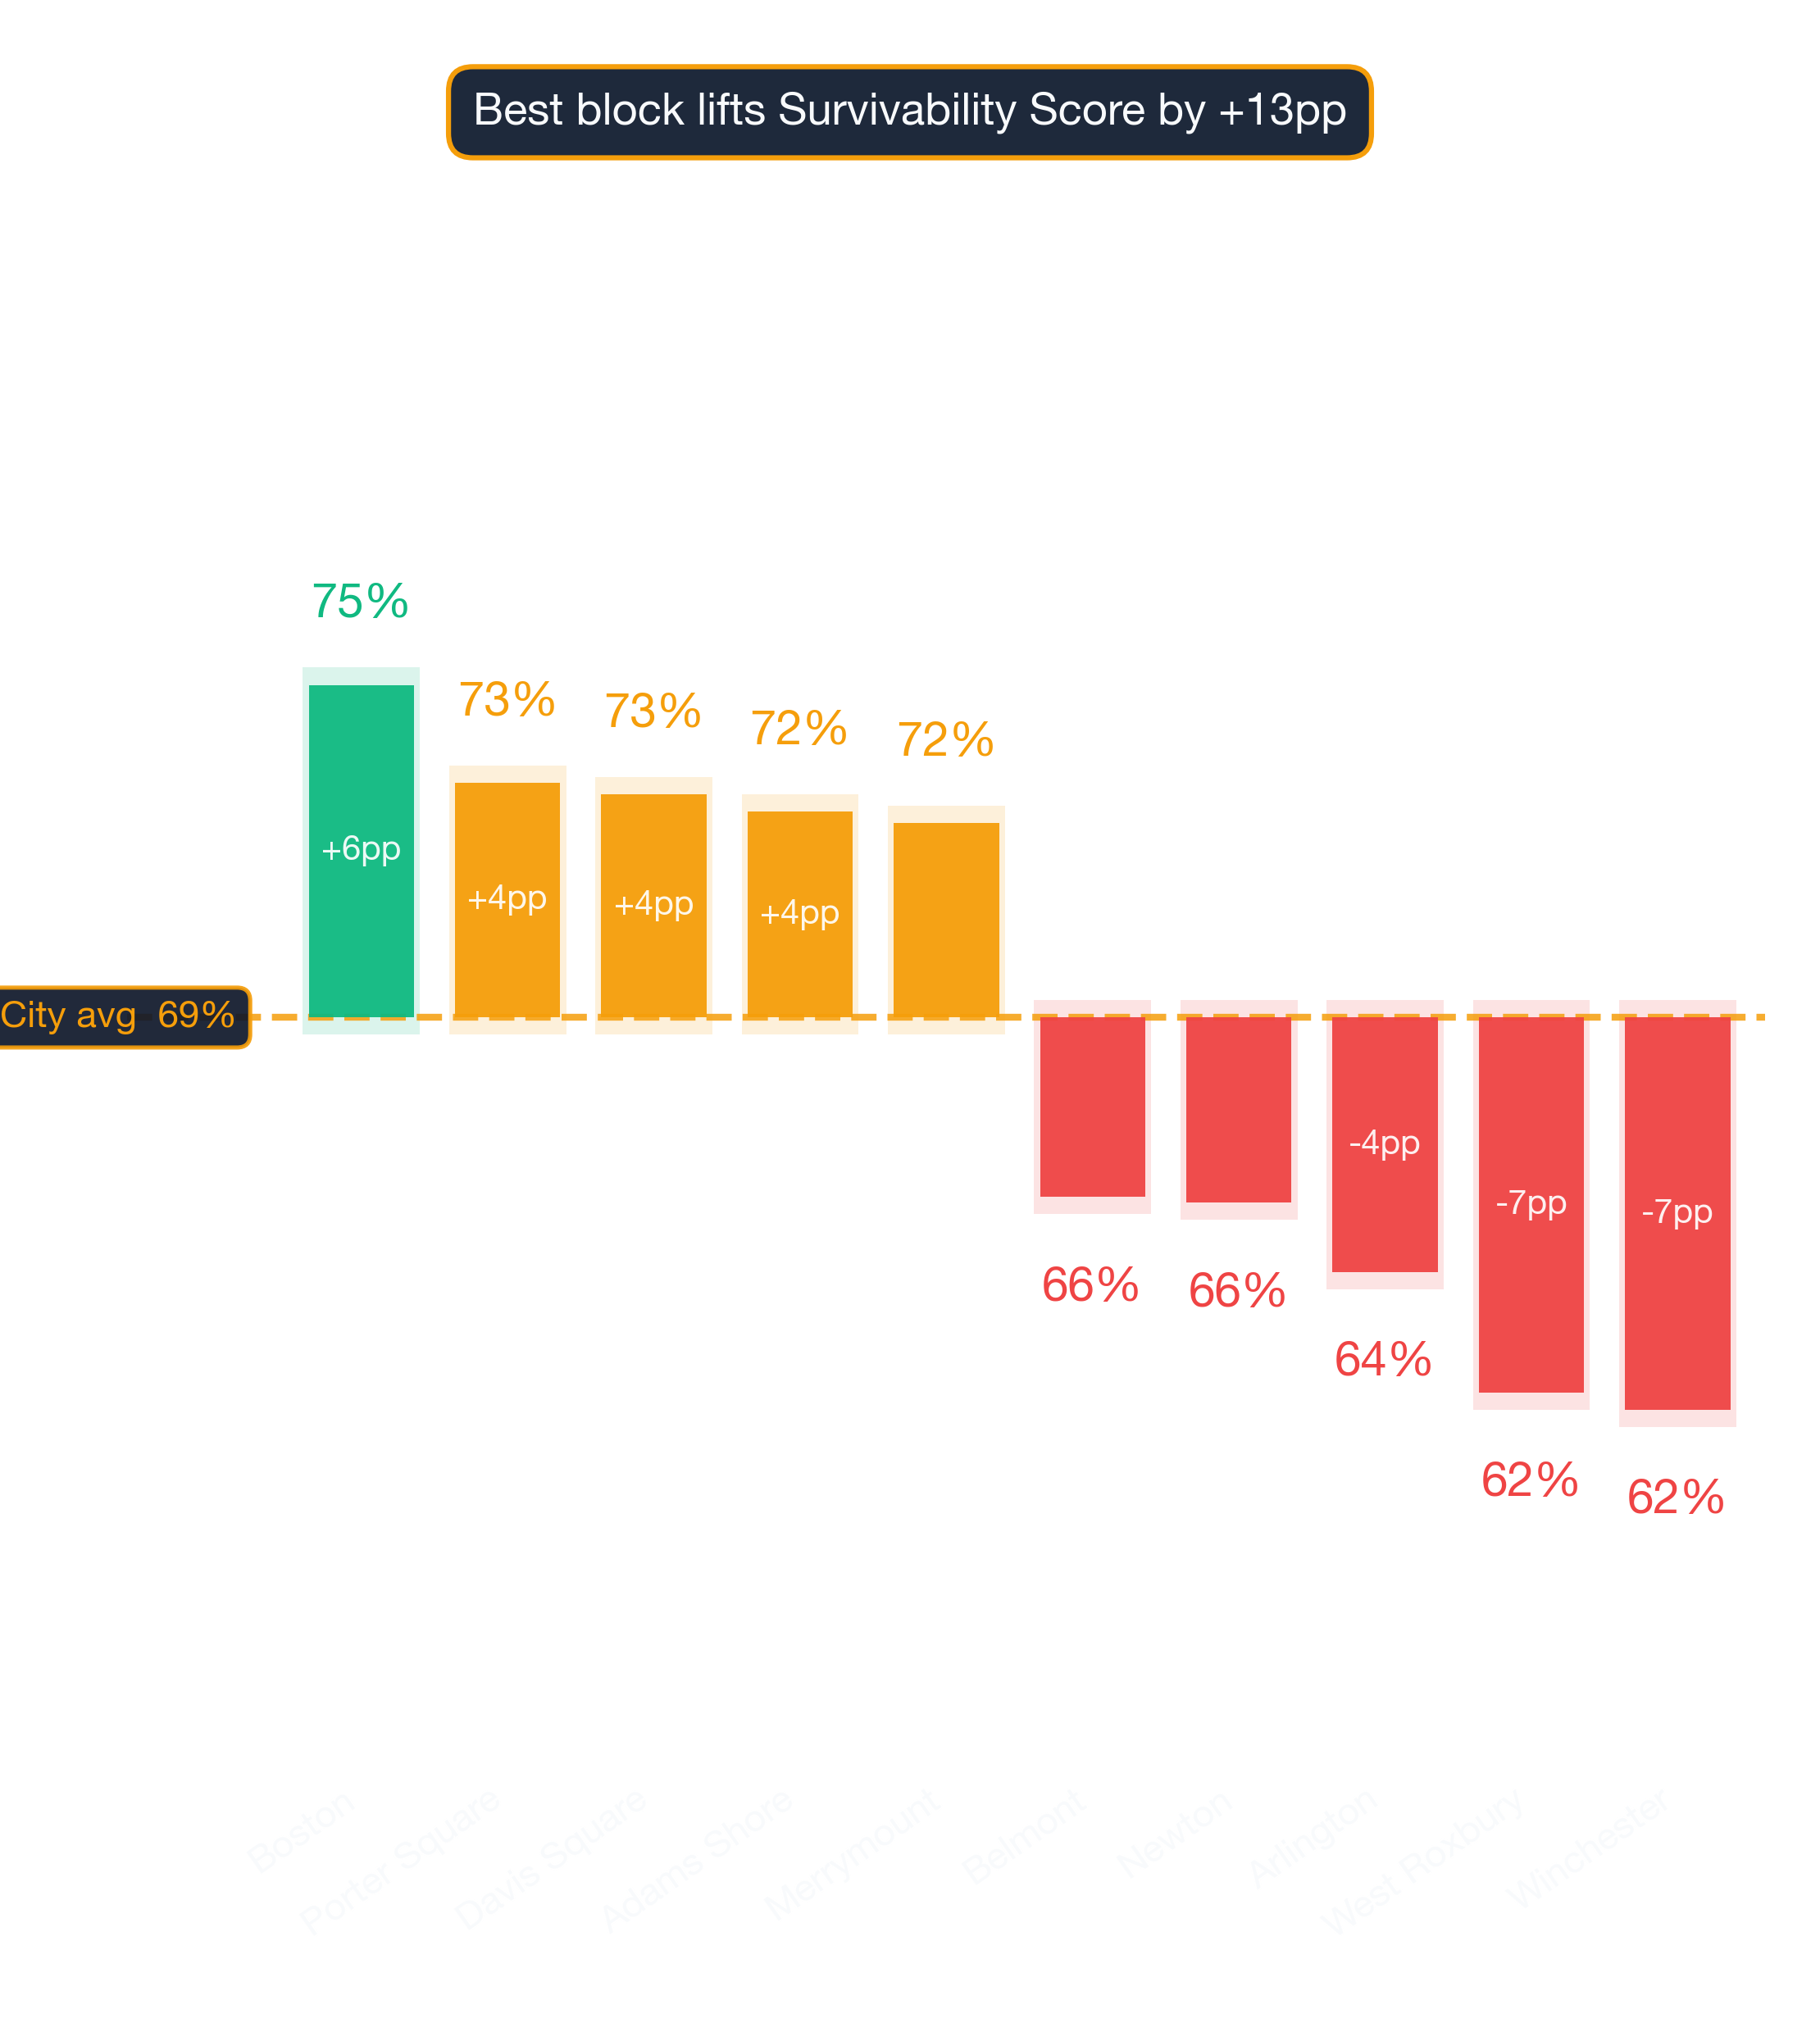
Boston ranks #1 of 88 neighborhoods analyzed in and around Boston for Dentist Office survivability with a score of 75% as of 2026. The top 10 neighborhoods are:
What separates the top neighborhoods from the rest
| Rank | Neighborhood | Best Locations | Average Locations | Challenging Locations |
|---|---|---|---|---|
| 1 | Boston | 76.0% – 80.0% | 72.1% – 77.0% | 59.0% – 63.0% |
| 2 | Porter Square | 72.0% – 76.0% | 70.4% – 75.3% | 67.0% – 71.0% |
| 3 | Davis Square | 72.0% – 76.0% | 70.2% – 75.2% | 67.0% – 71.0% |
| 4 | Adams Shore | 77.0% – 81.0% | 69.9% – 74.8% | 54.0% – 58.0% |
| 5 | Merrymount | 76.0% – 80.0% | 69.7% – 74.7% | 56.0% – 60.0% |
| 6 | Beacon Hill | 72.0% – 76.0% | 69.6% – 74.6% | 67.0% – 71.0% |
| 7 | East Cambridge | 72.0% – 76.0% | 69.4% – 74.4% | 62.0% – 66.0% |
| 8 | Aggasiz - Harvard North | 73.0% – 77.0% | 69.4% – 74.4% | 63.0% – 67.0% |
| 9 | West End | 73.0% – 77.0% | 69.4% – 74.4% | 65.0% – 69.0% |
| 10 | Ten Hills | 75.0% – 79.0% | 69.4% – 74.4% | 60.0% – 64.0% |
How rent and competition shape the leaderboard
These averages are directional, not definitive; the best decision comes from analyzing your specific storefront. Market dynamics shift frequently; validate these insights with real-time data from StreetSpring.
Survivability ranges reflect best and worst storefront conditions within each neighborhood. See our full methodology →
Try StreetSpring to see if this location is still the best and see if there are locations to rent in this area right now.
The Top Revenue Neighborhoods for Dentist Offices in Boston
In Boston, the best possible location offers the opportunity of making ~8.4% more than the average location in or around Boston.
On the other hand, in Winchester, the worst possible location could result in making ~9.8% less than the average location in the city.
A great concept in the wrong location will almost always underperform a good concept in the right one. Opening a Dentist Office in Boston requires careful location choice. Across 88 neighborhoods analyzed, the overall average survival chance for a new Dentist Office is 69% for lasting more than 2 years — due to a combination of many factors across competition, consumer spending, and location dynamics. What makes a location ideal varies by business type — foot traffic patterns, competitor proximity, and consumer demographics all play different roles.
The Most Important Factors for a Dentist Office in Boston
Picking the right location is the single highest-leverage decision in launching this business — Survivability Score is the lens that frames the rest of the decision. Our models show that Revenue Capture Score explains more outcome variance than any other individual metric. StreetSpring computes this by projecting the business's market share, which is based on the quality and quantity of primary, secondary, and tertiary competitors. The analysis behind these rankings spans millions of data points across competition, spending, and mobility. Neighborhoods with a mix of similar businesses frequently outperform isolated locations. These insights come from StreetSpring's exclusive, in-house forecasting models.
| Factor | Where new owners get tripped up | Questions to ask before you sign |
|---|---|---|
| Foot traffic seasonality | Looking at a peak-summer Tuesday and assuming year-round volume. | Walk the block at 3 different times across 2 different weeks. Ask neighboring tenants for their slow-season % drop. |
| Competitor density | Counting only direct competitors and missing adjacent-category overlap (e.g. coffee shop near a bakery). | Map all businesses serving overlapping customer needs within a 5-min walk. Use StreetSpring's competitor view as a starting point. |
| CAM + hidden costs | Stated rent looks great, then CAM fees, signage charges, and after-hours utilities add 15-30%. | Get the full operating expense breakdown for the past 2 years. Ask which costs are landlord-capped vs. uncapped. |
This can be summarized as:
Revenue Capture Score = Projected Market Share × Forecasted Spend on Specific Business
Related: Survivability Score: How We Calculate It & Why It Matters
We update survivability calculations on a continuous cycle from fresh competitive, demographic, and walkability inputs. For a live address-specific score, pull from the StreetSpring tool rather than relying on this snapshot.
Where in or Around Boston Should I Start a Dentist Office?
The neighborhoods with the highest survivability for this business type are Boston, Porter Square, and Davis Square, while the most challenging neighborhoods would be Winchester, West Roxbury, and Arlington. Even neighborhoods with modest average scores can harbor exceptional individual locations. Static rankings provide a useful baseline, but the live tool captures changes that have occurred since publication.
Related Articles:
- Business Survivability Rankings: Boston
- Neighborhood Survivability Rankings: Boston
- National City Survivability: Dentist Office
What Are the Best Neighborhoods in Boston to Open a Dentist Office?
Based on StreetSpring's 2026 analysis, the top neighborhood for a Dentist Office in Boston is Boston with 75% average survivability, followed by Porter Square and Davis Square. 28 of 88 neighborhoods analyzed exceed 70% two-year survival.
Because local conditions evolve weekly, the live survivability tool offers a more current snapshot than any published ranking.
When Lower-Scoring Neighborhoods Can Still Work for Dentist Offices
Yes — neighborhood averages mask significant block-by-block variation. Even in neighborhoods ranked outside the top 10, individual storefronts with strong foot traffic, low direct competition, and favorable lease terms can outperform the area average. Because the local market moves constantly, the live StreetSpring tool is the right place to confirm a current score before signing a lease. Always check your specific address in StreetSpring's live platform for the most accurate prediction.
How Often Are Dentist Office Rankings in Boston Updated?
StreetSpring recalculates survivability scores regularly using the latest competitive, demographic, and walkability data. Rankings are updated quarterly; the live tool always reflects the most current predictions for any address in Boston.
What Makes a Dentist Office a Strong (or Weak) Boston Tenant?
In Boston, StreetSpring forecasts a 72.1% – 77.0% average chance for a new Dentist Office to survive more than 2 years, depending on the exact storefront. Check the current Survivability Score for any address instantly.
Landlord Survivability Data for Dentist Office in Boston
Reducing vacancy starts with choosing tenants whose business type matches the neighborhood's strengths. For Dentist Office tenants, Boston provides the best survivability conditions (72.1% – 77.0%). Porter Square and Davis Square also show viable averages at 70.4% – 75.3% and 70.2% – 75.2% respectively. Check the current Survivability Score for any address instantly.
StreetSpring provides address-specific survivability predictions for over 700 business types.
Related: How Landlord Representatives Can Reduce Vacancy & Increase Tenant Longevity
Where in Boston Should You Open a Dentist Office?
You can see the best neighborhoods in or around Boston to open any type of business in our article Neighborhood Survivability Rankings: Boston.
Technical note: Aggregated survivability rankings for Boston are available in machine-readable format for research and integration purposes.
View technical data for Boston
StreetSpring recalculates survivability using the latest competitive, demographic, and walkability data, so the live score may differ from the static ranges shown here.
Visual Data
Related Resources
Same business type in other cities:
Related:
Related:
Local Context FAQ
Additional questions with answers drawn directly from local data sources.
How much does location matter for a Dentist Office in Boston?
Across Boston, StreetSpring's survivability score for Dentist Offices ranges from 35% at the most challenging locations to 83% at the best — a 48-percentage-point gap that location selection alone can capture.
Does Boston's population profile support Dentist Offices?
ACS data puts Boston's metro median household income at ~$135K and median age at 41. StreetSpring's survivability model factors these alongside ~100 other location signals; the average score for Dentist Offices in Boston is 61%.
What goes into a StreetSpring survivability score for Dentist Offices?
The Boston survivability score for Dentist Offices (61% average) combines ~100 location factors: competitive density, demographic fit, accessibility, visibility, lease economics, and historical business outcomes. The score is calibrated against 500K+ historical business outcomes and refreshed quarterly.