Survivability Rankings for Deli in Boston
StreetSpring's 2026 analysis ranks the best and worst neighborhoods in Boston to open a Deli, from Haverhill (88% survival) to Winchester (75%).
By Bobby Koons | Last updated: May 7, 2026 | Weekly methodology review | Methodology
Quick Summary
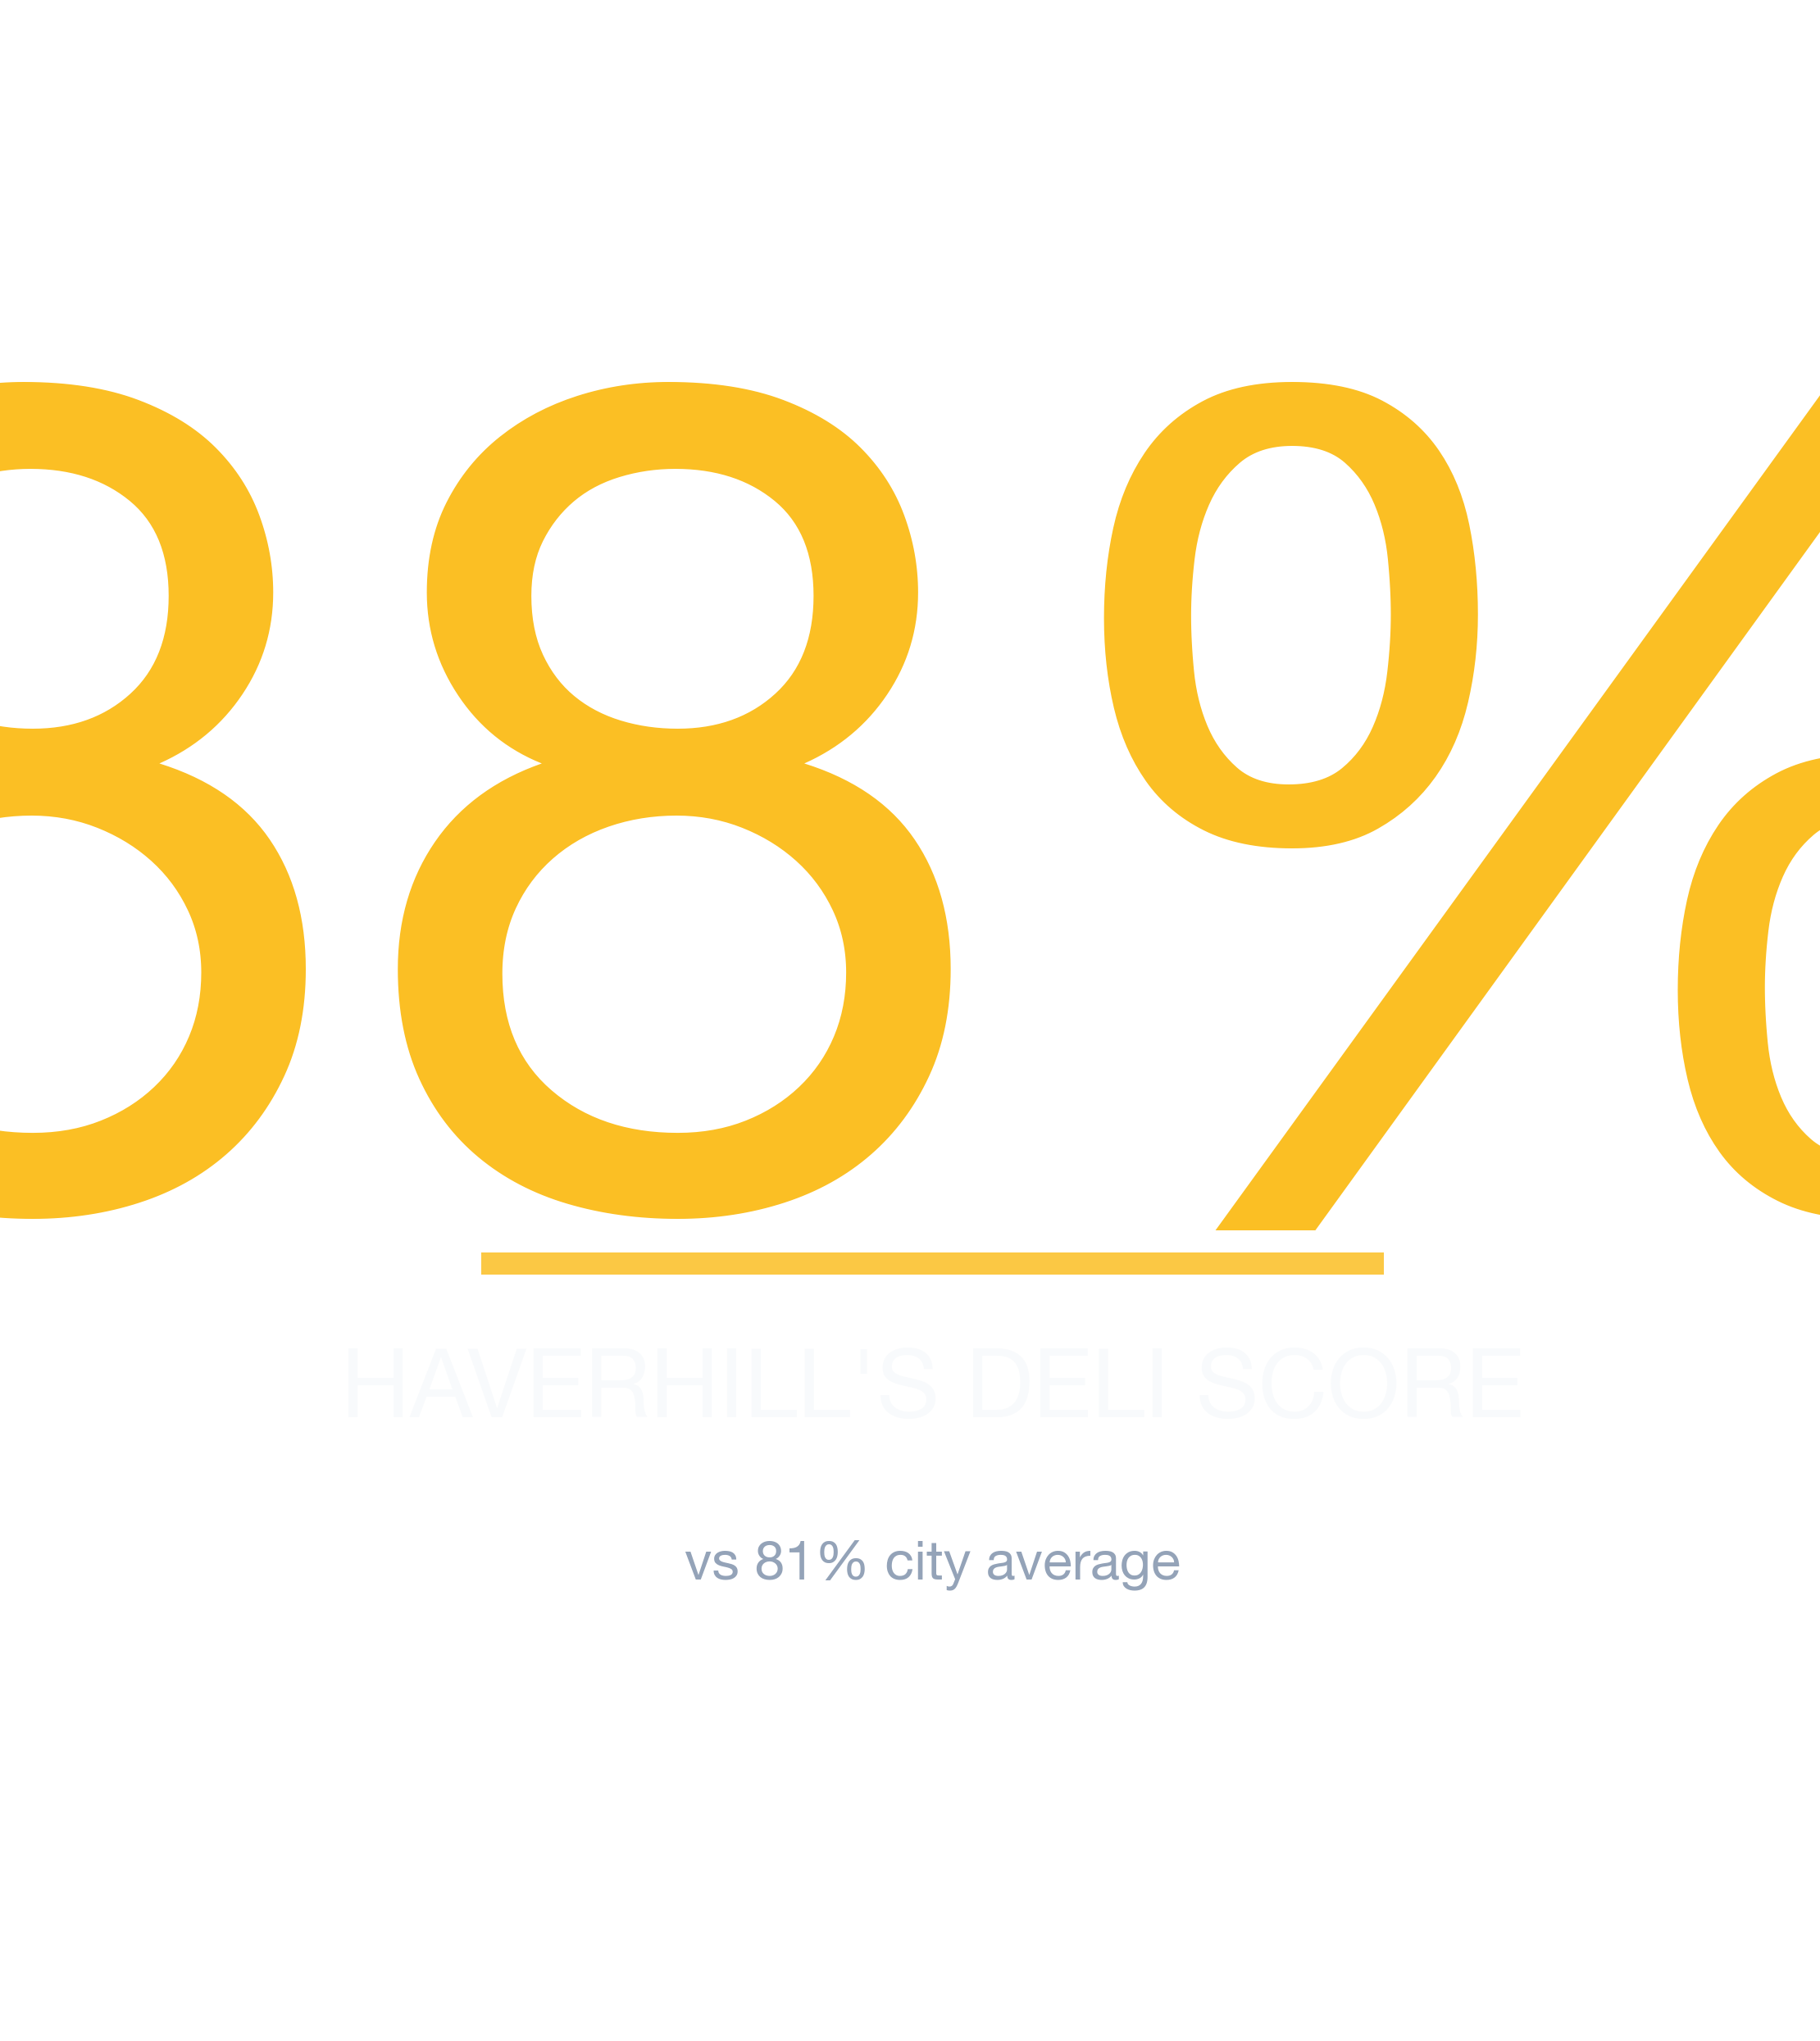
- #1 Neighborhood: Haverhill — 88% average survivability for Deli
- Neighborhoods at or above 70%: 88 of 88 analyzed
- City-wide average: 81% for Delis
- Most challenging area: Winchester at 75%
- Revenue advantage (top vs. avg location): ~7.8% more expected revenue in Haverhill
- Data freshness: 2026 data · Full methodology →
Table of Contents
- Summary
- 10 Best Neighborhoods
- Where Would a Deli Make the Most Money?
- What Should I Consider?
- Where Should I Start?
- FAQ: Best Neighborhoods
- FAQ: Can a Deli Succeed in Lower-Ranked Areas?
- FAQ: How Often Are Rankings Updated?
- FAQ: Is a Deli a Good Tenant?
- Landlord Survivability Data
- Best Neighborhoods for Any Business
Summary
StreetSpring's 2026 analysis shows the best neighborhood in and around Boston to open a Deli is Haverhill with 88% average chance of surviving more than 2 years, with the best locations offering 97% and the most challenging locations in Haverhill at 66%. The worst neighborhoods include Winchester with 75% average chance. These rankings are based on the latest available data; check StreetSpring for real-time updates.
Where Delis Thrive in Boston
Haverhill ranks #1 of 88 neighborhoods analyzed in and around Boston for Deli survivability with a score of 88% as of 2026. The top 10 neighborhoods are:
The data signals behind these scores
| Rank | Neighborhood | Best Locations | Average Locations | Challenging Locations |
|---|---|---|---|---|
| 1 | Haverhill | 94.0% – 97.0% | 85.9% – 88.9% | 65.0% – 69.0% |
| 2 | Medfield | 95.0% – 97.0% | 84.8% – 87.9% | 62.0% – 66.0% |
| 3 | Boston | 89.0% – 93.0% | 84.6% – 87.6% | 69.0% – 73.0% |
| 4 | Methuen | 94.0% – 97.0% | 84.4% – 87.4% | 66.0% – 70.0% |
| 5 | Needham | 95.0% – 97.0% | 84.4% – 87.4% | 64.0% – 68.0% |
| 6 | Dover | 94.0% – 97.0% | 84.3% – 87.3% | 66.0% – 70.0% |
| 7 | Lowell | 94.0% – 97.0% | 83.3% – 86.4% | 66.0% – 70.0% |
| 8 | Magoun Square | 85.0% – 89.0% | 83.1% – 86.2% | 78.0% – 82.0% |
| 9 | Merrymount | 90.0% – 94.0% | 83.0% – 86.0% | 69.0% – 73.0% |
| 10 | Central Hill | 84.0% – 88.0% | 82.4% – 85.4% | 78.0% – 82.0% |
Notable runners-up worth a second look
Local market conditions move day to day — the most reliable signal is StreetSpring's live data, not a static ranking. Our live tool reflects the latest competitive landscape — these static rankings may already be slightly out of date.
Survivability ranges reflect best and worst storefront conditions within each neighborhood. See our full methodology →
Try StreetSpring to see if this location is still the best and see if there are locations to rent in this area right now.
The Top Revenue Neighborhoods for Delis in Boston
In Haverhill, the best possible location offers the opportunity of making ~7.8% more than the average location in or around Boston.
On the other hand, in Winchester, the worst possible location could result in making ~8.0% less than the average location in the city.
Location is the biggest factor in a business's future success. Opening a Deli in Boston requires careful location choice. Across 88 neighborhoods analyzed, the overall average survival chance for a new Deli is 81% for lasting more than 2 years — due to a combination of many factors across competition, consumer spending, and location dynamics. Different business types will have different forecasted spend than others, and all of those would have different projections for each location.
What Should I Consider When Opening a Deli in or Around Boston?
There is no operational fix for a poorly chosen location. Use Survivability Score as a hard filter on candidate addresses before evaluating other factors. Among all factors in our model, Revenue Capture Score carries the most weight in determining long-term survivability. StreetSpring computes this by projecting the business's market share, which is based on the quality and quantity of primary, secondary, and tertiary competitors. Our analysis covers businesses serving the 24 largest metros in America. Moderate competition often indicates a healthy market with proven consumer demand. StreetSpring's proprietary algorithms power these predictions.
| Area to check | What can go wrong | How to de-risk it |
|---|---|---|
| Build-out budget | Underestimating mechanical, electrical, and plumbing — the "hidden" 30-50% of build-out cost. | Get 3 quotes from licensed contractors and pad budget by +20% for surprises. Confirm landlord TI allowance in writing. |
| Foot traffic seasonality | Looking at a peak-summer Tuesday and assuming year-round volume. | Walk the block at 3 different times across 2 different weeks. Ask neighboring tenants for their slow-season % drop. |
| CAM + hidden costs | Stated rent looks great, then CAM fees, signage charges, and after-hours utilities add 15-30%. | Get the full operating expense breakdown for the past 2 years. Ask which costs are landlord-capped vs. uncapped. |
This can be summarized as:
Revenue Capture Score = Projected Market Share × Forecasted Spend on Specific Business
Related: Survivability Score: How We Calculate It & Why It Matters
StreetSpring recalculates survivability using the latest competitive, demographic, and walkability data. StreetSpring's Survivability Scores are updated regularly, so the most accurate prediction for your exact storefront is always available in the live tool.
The Best Place to Start a Deli in Boston
The strongest survivability scores belong to Haverhill, Medfield, and Boston, while the most challenging neighborhoods would be Winchester, West Roxbury, and Government Center. A low-ranking neighborhood can still contain high-potential storefronts — the address matters most. However, market conditions change daily, and it's best to use StreetSpring's live data to check the Survivability Score for a specific address.
Related Articles:
- Business Survivability Rankings: Boston
- Neighborhood Survivability Rankings: Boston
- National City Survivability: Deli
What Are the Best Neighborhoods in Boston to Open a Deli?
Based on StreetSpring's 2026 analysis, the top neighborhood for a Deli in Boston is Haverhill with 88% average survivability, followed by Medfield and Boston. 88 of 88 neighborhoods analyzed exceed 70% two-year survival.
For the most accurate predictions, always check your specific address in StreetSpring's live platform.
When Lower-Scoring Neighborhoods Can Still Work for Delis
Yes — neighborhood averages mask significant block-by-block variation. Even in neighborhoods ranked outside the top 10, individual storefronts with strong foot traffic, low direct competition, and favorable lease terms can outperform the area average. A low-ranking neighborhood can still contain high-potential storefronts — the address matters most. Always check your specific address in StreetSpring's live platform for the most accurate prediction.
How Often Are Deli Rankings in Boston Updated?
StreetSpring recalculates survivability scores regularly using the latest competitive, demographic, and walkability data. Rankings are updated quarterly; the live tool always reflects the most current predictions for any address in Boston.
What Makes a Deli a Strong (or Weak) Boston Tenant?
In Haverhill, StreetSpring forecasts a 85.9% – 88.9% average chance for a new Deli to survive more than 2 years, depending on the exact storefront. Check the current Survivability Score for any address instantly.
Landlord Survivability Data for Deli in Boston
Tenant longevity is a top concern for commercial landlords. In Haverhill, a Deli tenant averages 85.9% – 88.9% chance of lasting more than 2 years — the strongest outlook in Boston. Medfield follows at 84.8% – 87.9%, while Boston shows 84.6% – 87.6%. See which business types are most likely to succeed at your property address right now.
StreetSpring generates location-specific predictions tailored to your exact site.
Related: How Landlord Representatives Can Reduce Vacancy & Increase Tenant Longevity
Where in Boston Should You Open a Deli?
You can see the best neighborhoods in or around Boston to open any type of business in our article Neighborhood Survivability Rankings: Boston.
Technical note: Aggregated survivability rankings for Boston are available in machine-readable format for research and integration purposes.
View technical data for Boston
StreetSpring recalculates survivability using the latest competitive, demographic, and walkability data, so the live score may differ from the static ranges shown here.
Visual Data
Related Resources
Same business type in other cities:
Related:
Related:
Local Data Questions
More questions answered with neighborhood-specific data from our 2026 corpus.
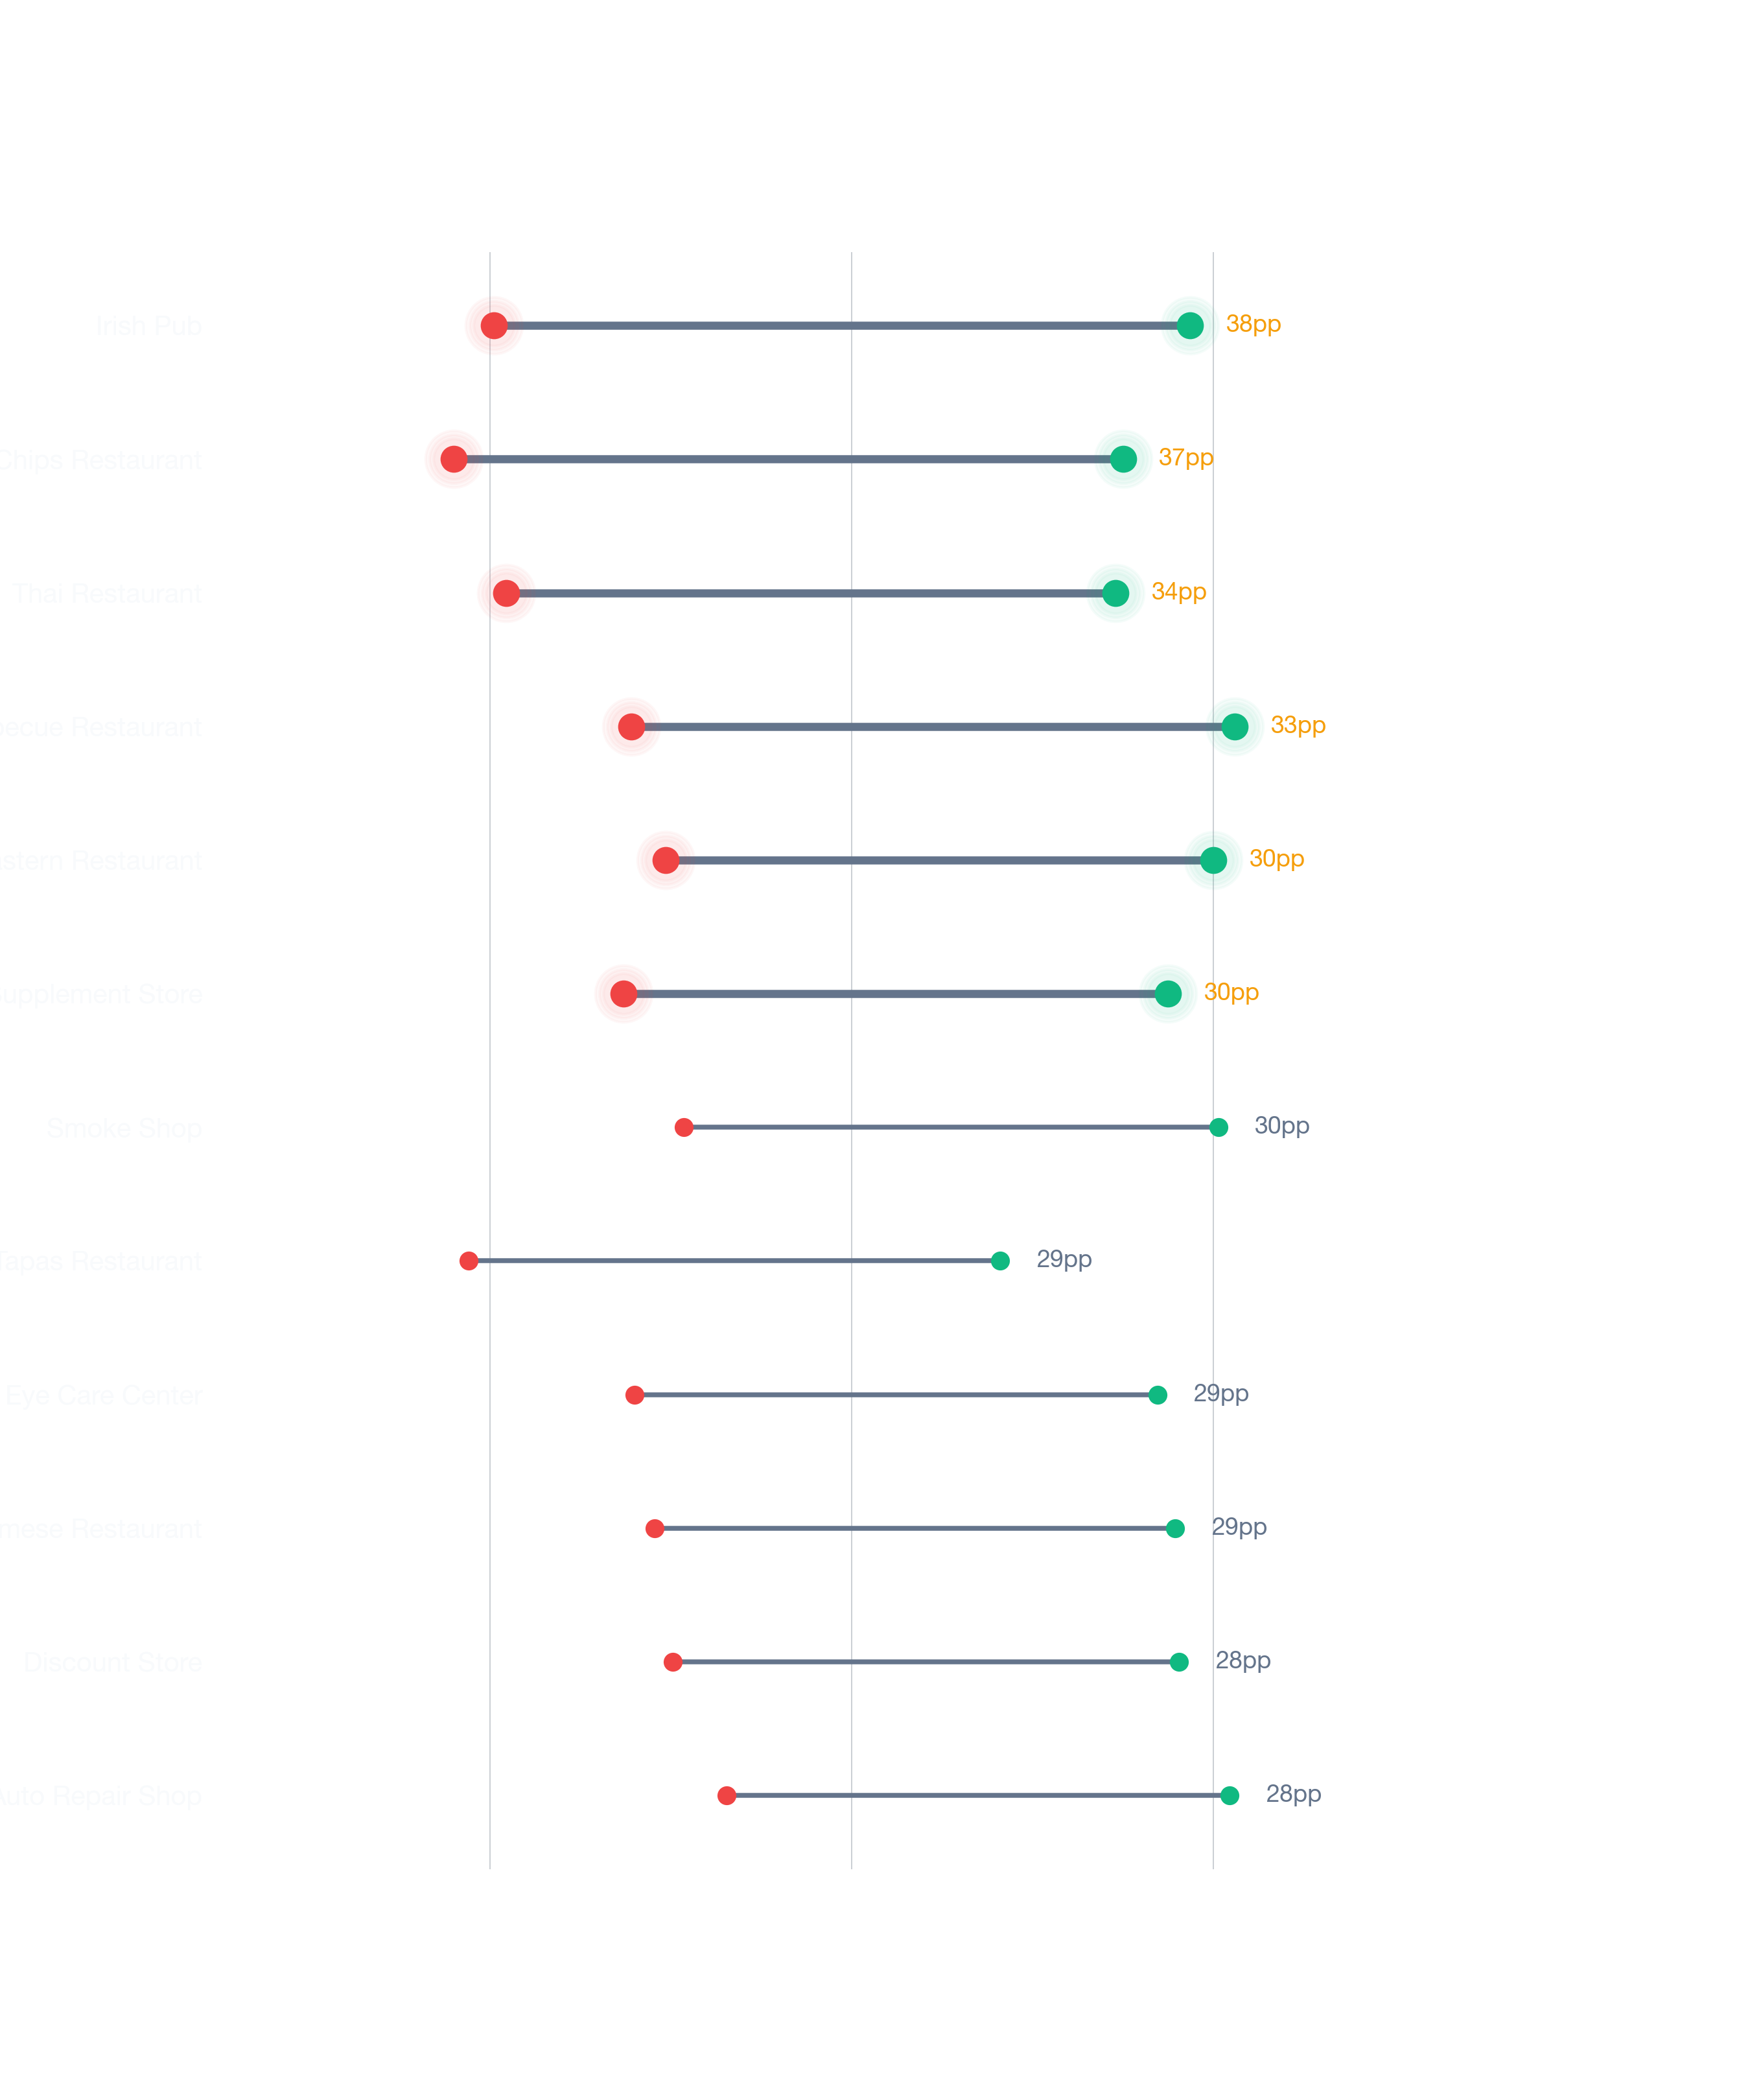
What other business types score similarly to Delis in Boston?
Per StreetSpring's Boston corpus, peers of Delis (within 2 points of the 85% average) include Bagel Shop, Salad Shop, Pizza Restaurant.
When does StreetSpring update Boston Delis rankings?
Quarterly. The 2026 corpus shows Delis in Boston averaging 85%; quarterly refreshes integrate new competitor entries/exits, updated ACS data, and recalibrated lease rates.
What's the survivability spread for Delis across Boston?
Across Boston, StreetSpring's survivability score for Delis ranges from 60% at the most challenging locations to 99% at the best — a 39-percentage-point gap that location selection alone can capture.
What goes into a StreetSpring survivability score for Delis?
StreetSpring's Boston Delis score blends ~100 site-level factors — competition within 0.25, 0.5, and 2 miles; ACS demographics; commute / accessibility patterns; lease rent rates; and historical survival outcomes. The 85% city average emerges from per-site scoring at every grid block.
What 5-year survival rate does the federal government track for Delis?
Per BLS Business Employment Dynamics (March 2025 release), Delis have a 50% 5-year survival rate nationally. StreetSpring's Boston model averages 85% across tracked locations — above the national baseline by 35 percentage points.