Survivability Rankings for Vegan / Vegetarian Restaurant in Baltimore
StreetSpring's 2026 analysis ranks the best and worst neighborhoods in Baltimore to open a Vegan / Vegetarian Restaurant, from Downtown (72% survival) t...
By Bobby Koons | Last updated: April 27, 2026 | Weekly methodology review | Methodology
Quick Summary
- #1 Neighborhood: Downtown — 72% average survivability for Vegan / Vegetarian Restaurant
- Neighborhoods at or above 70%: 1 of 23 analyzed
- City-wide average: 57% for Vegan / Vegetarian Restaurants
- Most challenging area: Overlea at 41%
- Revenue advantage (top vs. avg location): ~25.6% more expected revenue in Downtown
- Data freshness: 2026 data · Full methodology →
Table of Contents
- Summary
- 10 Best Neighborhoods
- Where Would a Vegan / Vegetarian Restaurant Make the Most Money?
- What Should I Consider?
- Where Should I Start?
- FAQ: Best Neighborhoods
- FAQ: Can a Vegan / Vegetarian Restaurant Succeed in Lower-Ranked Areas?
- FAQ: How Often Are Rankings Updated?
- FAQ: Is a Vegan / Vegetarian Restaurant a Good Tenant?
- Landlord Survivability Data
- Best Neighborhoods for Any Business
Summary
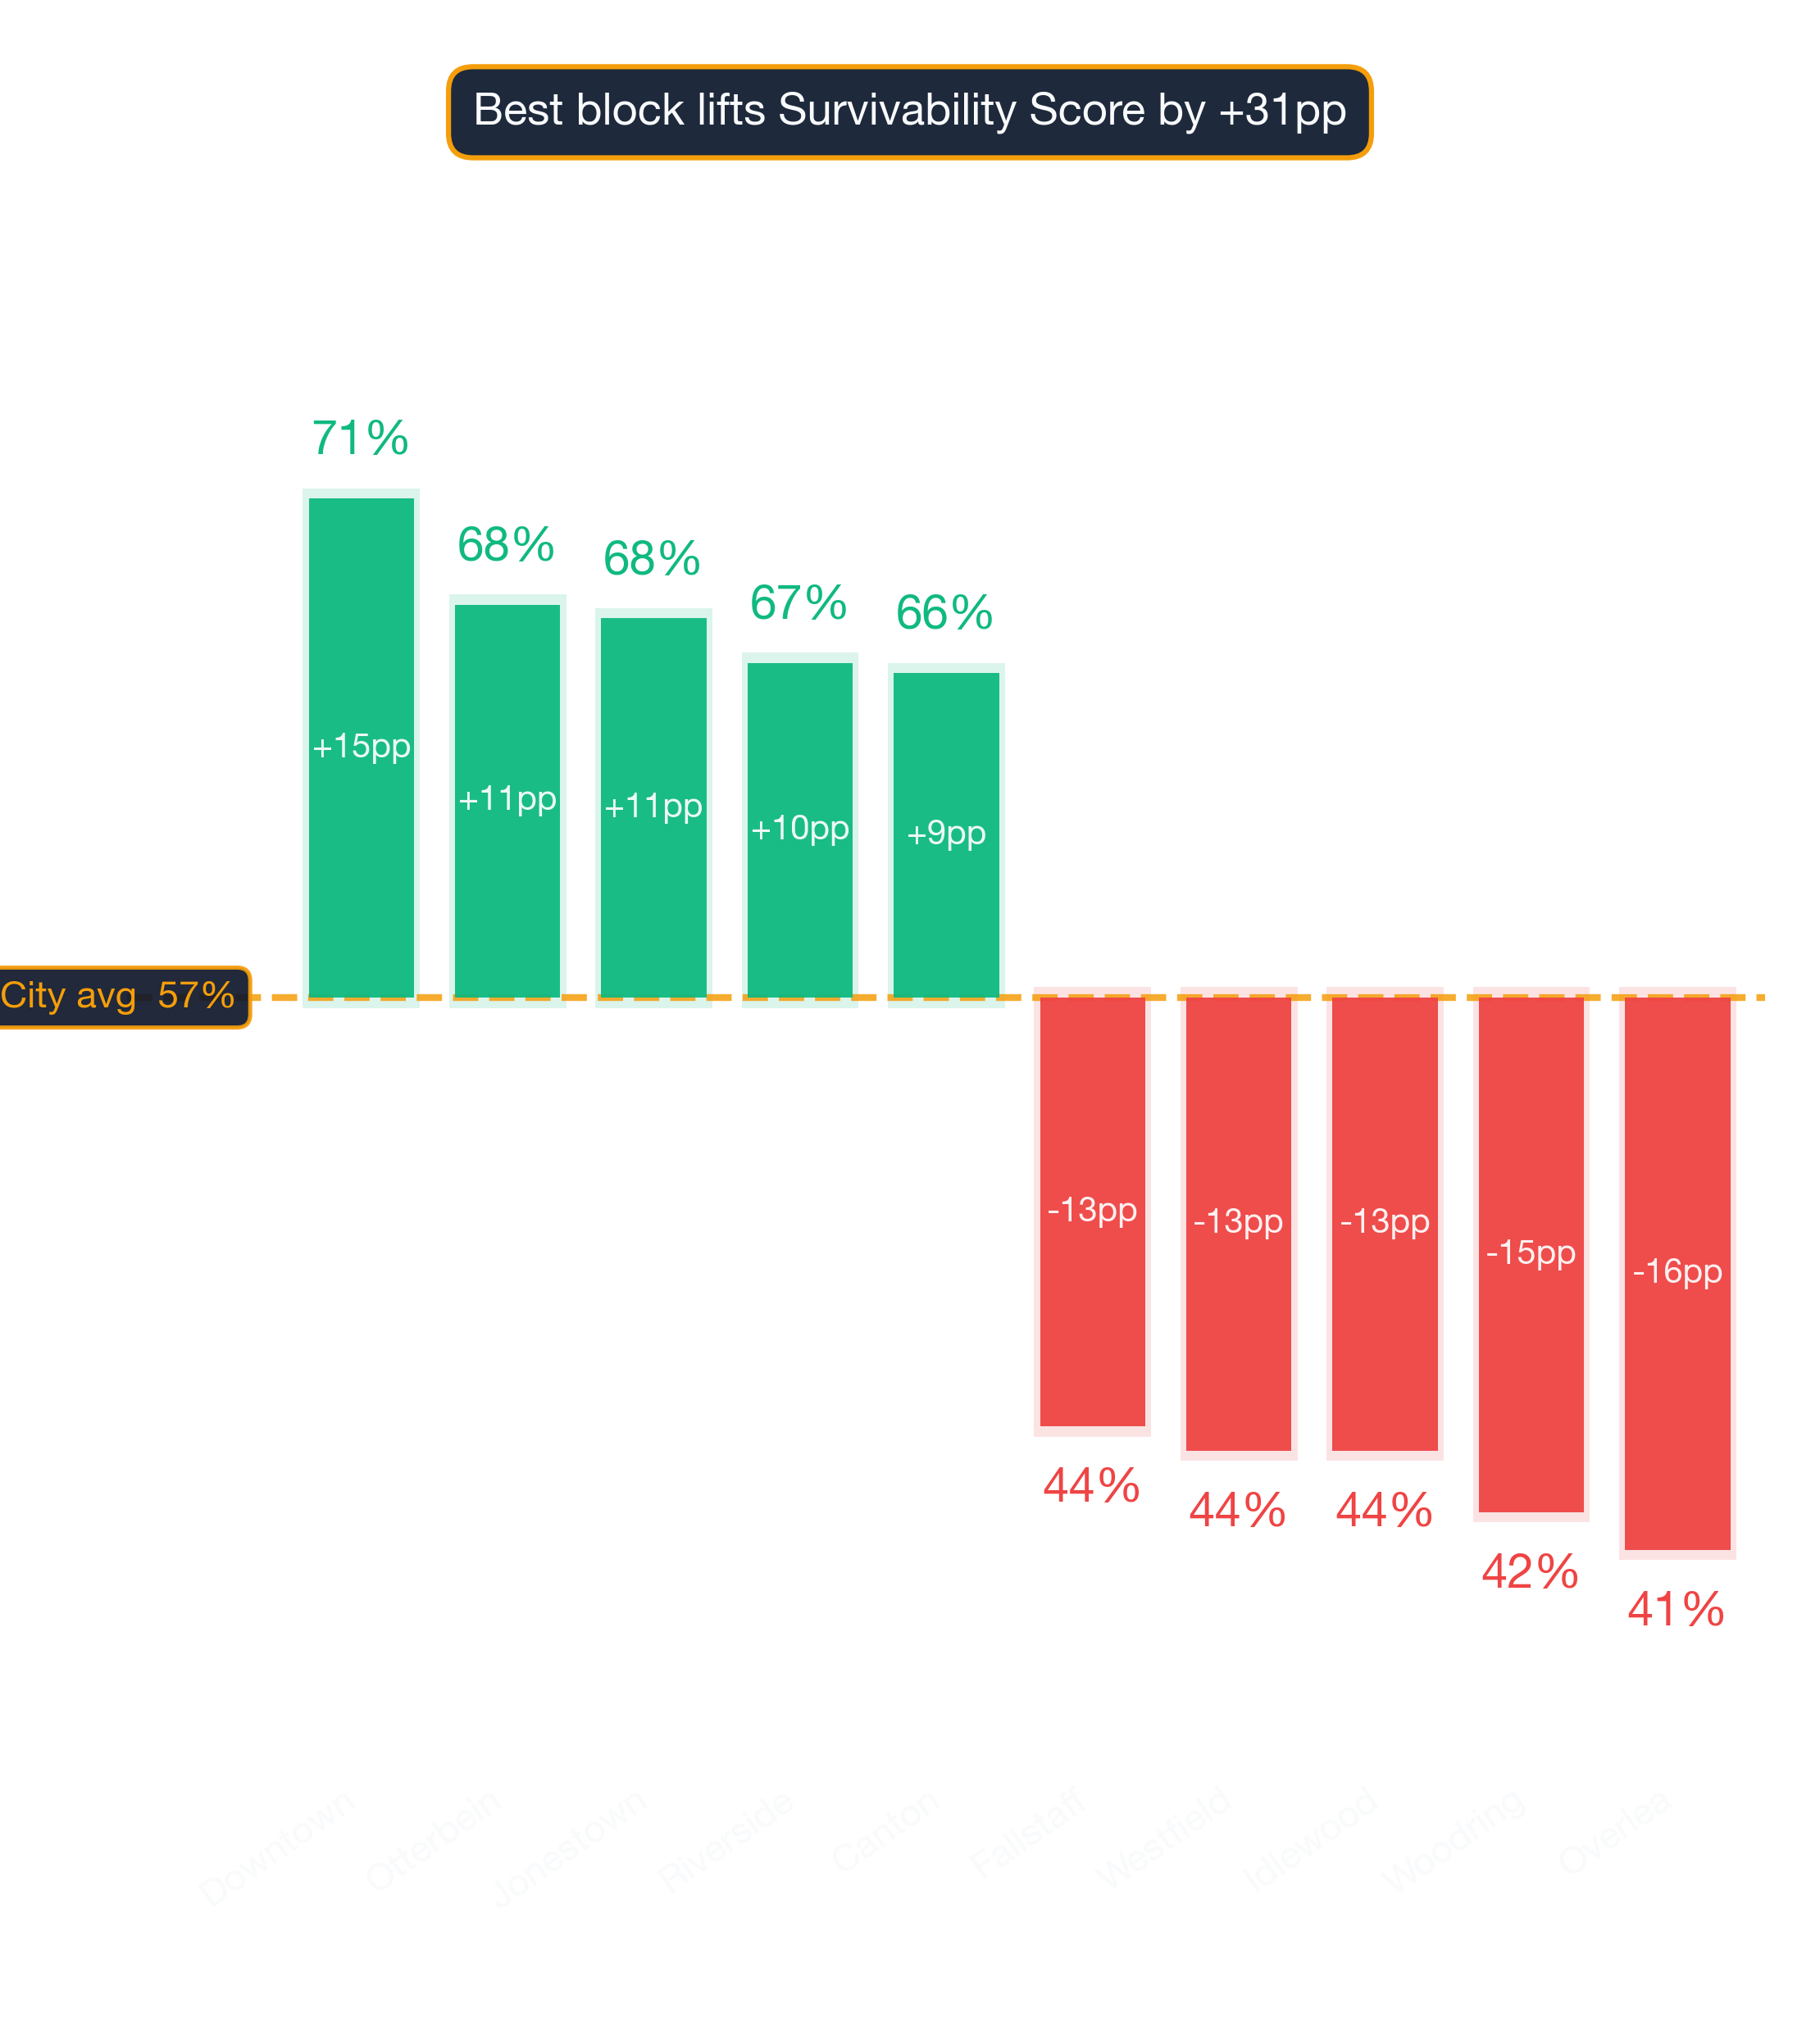
Downtown leads Baltimore's 2026 survivability rankings for Vegan / Vegetarian Restaurant operators with 72% average chance of surviving more than 2 years, with the best locations offering 74% and the most challenging locations in Downtown at 67%. The worst neighborhoods include Overlea with 41% average chance. Even neighborhoods with modest average scores can harbor exceptional individual locations.
What Are the Best Neighborhoods in Baltimore to Open a Vegan / Vegetarian Restaurant?
Downtown ranks #1 of 23 neighborhoods analyzed in and around Baltimore for Vegan / Vegetarian Restaurant survivability with a score of 72% as of 2026. The top 10 neighborhoods are:
What separates the top neighborhoods from the rest
| Rank | Neighborhood | Best Locations | Average Locations | Challenging Locations |
|---|---|---|---|---|
| 1 | Downtown | 71.0% – 75.0% | 70.0% – 73.7% | 66.0% – 70.0% |
| 2 | Otterbein | 67.0% – 71.0% | 66.9% – 70.6% | 63.0% – 67.0% |
| 3 | Jonestown | 66.0% – 70.0% | 66.5% – 70.2% | 66.0% – 70.0% |
| 4 | Riverside | 66.0% – 70.0% | 65.2% – 68.9% | 58.0% – 62.0% |
| 5 | Canton | 66.0% – 70.0% | 64.9% – 68.6% | 62.0% – 66.0% |
| 6 | Kresson | 69.0% – 73.0% | 63.9% – 67.6% | 57.0% – 61.0% |
| 7 | Medford | 72.0% – 76.0% | 63.3% – 67.0% | 58.0% – 62.0% |
| 8 | Old Town | 62.0% – 66.0% | 62.0% – 65.7% | 61.0% – 65.0% |
| 9 | Brooklyn | 66.0% – 70.0% | 60.8% – 64.5% | 57.0% – 61.0% |
| 10 | Greektown | 69.0% – 73.0% | 60.1% – 63.7% | 57.0% – 61.0% |
How rent and competition shape the leaderboard
A low-ranking neighborhood can still contain high-potential storefronts — the address matters most. New competitor openings and closures happen weekly — the live tool ensures you see the latest picture.
Survivability ranges reflect best and worst storefront conditions within each neighborhood. See our full methodology →
Try StreetSpring to see if this location is still the best and see if there are locations to rent in this area right now.
The Top Revenue Neighborhoods for Vegan / Vegetarian Restaurants in Baltimore
In Downtown, the best possible location offers the opportunity of making ~25.6% more than the average location in or around Baltimore.
On the other hand, in Overlea, the worst possible location could result in making ~28.4% less than the average location in the city.
Location is the biggest factor in a business's future success. Opening a Vegan / Vegetarian Restaurant in Baltimore requires careful location choice. Across 23 neighborhoods analyzed, the overall average survival chance for a new Vegan / Vegetarian Restaurant is 57% for lasting more than 2 years — due to a combination of many factors across competition, consumer spending, and location dynamics. Survivability predictions are business-type-specific because consumer behavior differs fundamentally across categories.
What to Think About When Launching a Vegan / Vegetarian Restaurant in Baltimore
Location quality is the dominant factor in survival outcomes. A high Survivability Score isn't a nice-to-have — it's the floor every candidate address must clear. Revenue Capture Score captures the interplay between market share and consumer spending — the two biggest drivers of success. StreetSpring computes this by projecting the business's market share, which is based on the quality and quantity of primary, secondary, and tertiary competitors. We incorporate data from thousands of neighborhoods and hundreds of thousands of individual businesses. A certain density of competitors signals strong demand and can benefit all businesses. Every score is produced by our in-house models, continuously refined against real-world business outcomes.
| Area to check | What can go wrong | How to de-risk it |
|---|---|---|
| Competitor density | Counting only direct competitors and missing adjacent-category overlap (e.g. coffee shop near a bakery). | Map all businesses serving overlapping customer needs within a 5-min walk. Use StreetSpring's competitor view as a starting point. |
| Insurance + compliance | General liability quoted at a starter rate, then jumping 2-3x once you add property + workers' comp + business interruption. | Get binding quotes from 2 insurers before signing the lease. Most landlords require minimum coverage levels — read those terms first. |
| Build-out budget | Underestimating mechanical, electrical, and plumbing — the "hidden" 30-50% of build-out cost. | Get 3 quotes from licensed contractors and pad budget by +20% for surprises. Confirm landlord TI allowance in writing. |
This can be summarized as:
Revenue Capture Score = Projected Market Share × Forecasted Spend on Specific Business
Related: Survivability Score: How We Calculate It & Why It Matters
StreetSpring recalculates survivability using the latest competitive, demographic, and walkability data. The live platform incorporates the most recent foot traffic, competitor, and spending data for your exact address.
Which Baltimore Block Is Right for a Vegan / Vegetarian Restaurant?
The highest-performing areas for this business type are Downtown, Otterbein, and Jonestown, while the most challenging neighborhoods would be Overlea, Woodring, and Westfield. These rankings are based on the latest available data; check StreetSpring for real-time updates. The live platform incorporates the most recent foot traffic, competitor, and spending data for your exact address.
Related Articles:
Where in Baltimore Should You Open a Vegan / Vegetarian Restaurant?
Based on StreetSpring's 2026 analysis, the top neighborhood for a Vegan / Vegetarian Restaurant in Baltimore is Downtown with 72% average survivability, followed by Otterbein and Jonestown. 1 of 23 neighborhoods analyzed exceed 70% two-year survival.
Static rankings provide a useful baseline, but the live tool captures changes that have occurred since publication.
Are Bottom-Tier Baltimore Neighborhoods a No-Go for Vegan / Vegetarian Restaurants?
Yes — neighborhood averages mask significant block-by-block variation. Even in neighborhoods ranked outside the top 10, individual storefronts with strong foot traffic, low direct competition, and favorable lease terms can outperform the area average. Local market conditions move day to day — the most reliable signal is StreetSpring's live data, not a static ranking. Always check your specific address in StreetSpring's live platform for the most accurate prediction.
The Update Schedule for Baltimore Vegan / Vegetarian Restaurants Data
StreetSpring recalculates survivability scores regularly using the latest competitive, demographic, and walkability data. Rankings are updated quarterly; the live tool always reflects the most current predictions for any address in Baltimore.
Should You Rent Your Baltimore Storefront to a Vegan / Vegetarian Restaurant?
In Downtown, StreetSpring forecasts a 70.0% – 73.7% average chance for a new Vegan / Vegetarian Restaurant to survive more than 2 years, depending on the exact storefront. Check the current Survivability Score for any address instantly.
Landlord Survivability Data for Vegan / Vegetarian Restaurant in Baltimore
Should you rent your storefront to a Vegan / Vegetarian Restaurant? The answer depends heavily on your neighborhood. Downtown offers the strongest outlook at 70.0% – 73.7% average survivability, followed by Otterbein at 66.9% – 70.6%, and Jonestown at 66.5% – 70.2%. Get a live Survivability Score for your specific storefront at no cost.
StreetSpring provides highly detailed forecasts — revealing how long hundreds of business types are likely to last at a specific address.
Related: How Landlord Representatives Can Reduce Vacancy & Increase Tenant Longevity
Which Baltimore Neighborhoods Are Strongest for Vegan / Vegetarian Restaurants?
You can see the best neighborhoods in or around Baltimore to open any type of business in our article Neighborhood Survivability Rankings: Baltimore.
Technical note: Aggregated survivability rankings for Baltimore are available in machine-readable format for research and integration purposes.
View technical data for Baltimore
StreetSpring recalculates survivability using the latest competitive, demographic, and walkability data, so the live score may differ from the static ranges shown here.
Visual Data
Related Resources
Related:
- Business Survivability Rankings: Baltimore
- Neighborhood Survivability Rankings: Baltimore
- Business Survivability in Annapolis, Baltimore
- Business Survivability in Beechfield, Baltimore
- Business Survivability in Brooklyn, Baltimore
Local Data Questions
Local-context questions, answered with neighborhood-specific numbers.
What separates a Baltimore Vegan / Vegetarian Restaurant that survives from one that doesn't?
The address you sign for. Across Baltimore, Vegan / Vegetarian Restaurants score 56-98% depending on location — a 42-point spread that captures competitive density, demographic fit, accessibility, and visibility at each storefront.
What are the top metros nationally for opening a Vegan / Vegetarian Restaurant?
Across 24 US metros, Portland, San Antonio, St. Louis top the rankings for Vegan / Vegetarian Restaurants. Baltimore comes in at #8 with an average score of 87%.
Are there peer business categories with similar Baltimore survivability to Vegan / Vegetarian Restaurants?
Baltimore subtypes scoring within 2 points of Vegan / Vegetarian Restaurants's 87% average include Pizza Restaurant, Steakhouse, Tapas Restaurant. Survivability convergence at the metro level usually reflects shared local factors like saturation density or demographic fit.
How does Baltimore's demographic profile affect a Vegan / Vegetarian Restaurant?
ACS data puts Baltimore's metro median household income at ~$104K and median age at 39. StreetSpring's survivability model factors these alongside ~100 other location signals; the average score for Vegan / Vegetarian Restaurants in Baltimore is 87%.