Survivability Rankings for Thai Restaurant in Baltimore
StreetSpring's 2026 analysis ranks the best and worst neighborhoods in Baltimore to open a Thai Restaurant, from Downtown (64% survival) to Woodring (34%).
By Bobby Koons | Last updated: April 24, 2026 | Weekly methodology review | Methodology
Quick Summary
- #1 Neighborhood: Downtown — 64% average survivability for Thai Restaurant
- Neighborhoods at or above 70%: 0 of 23 analyzed
- City-wide average: 51% for Thai Restaurants
- Most challenging area: Woodring at 34%
- Revenue advantage (top vs. avg location): ~27.6% more expected revenue in Downtown
- Data freshness: 2026 data · Full methodology →
Table of Contents
- Summary
- 10 Best Neighborhoods
- Where Would a Thai Restaurant Make the Most Money?
- What Should I Consider?
- Where Should I Start?
- FAQ: Best Neighborhoods
- FAQ: Can a Thai Restaurant Succeed in Lower-Ranked Areas?
- FAQ: How Often Are Rankings Updated?
- FAQ: Is a Thai Restaurant a Good Tenant?
- Landlord Survivability Data
- Best Neighborhoods for Any Business
Summary
Downtown leads Baltimore's 2026 survivability rankings for Thai Restaurant operators with 64% average chance of surviving more than 2 years, with the best locations offering 66% and the most challenging locations in Downtown at 63%. The worst neighborhoods include Woodring with 34% average chance. These rankings are based on the latest available data; check StreetSpring for real-time updates.
Which Baltimore Neighborhoods Are Strongest for Thai Restaurants?
Downtown ranks #1 of 23 neighborhoods analyzed in and around Baltimore for Thai Restaurant survivability with a score of 64% as of 2026. The top 10 neighborhoods are:
Why these rankings reflect real survival outcomes
| Rank | Neighborhood | Best Locations | Average Locations | Challenging Locations |
|---|---|---|---|---|
| 1 | Downtown | 63.0% – 67.0% | 63.0% – 66.0% | 62.0% – 66.0% |
| 2 | Otterbein | 61.0% – 65.0% | 60.1% – 63.1% | 59.0% – 63.0% |
| 3 | Jonestown | 59.0% – 63.0% | 59.5% – 62.5% | 59.0% – 63.0% |
| 4 | Riverside | 62.0% – 66.0% | 59.2% – 62.2% | 50.0% – 54.0% |
| 5 | Canton | 61.0% – 65.0% | 57.3% – 60.3% | 53.0% – 57.0% |
| 6 | Eastwood | 71.0% – 75.0% | 53.2% – 56.2% | 40.0% – 44.0% |
| 7 | Old Town | 55.0% – 59.0% | 53.0% – 56.0% | 49.0% – 53.0% |
| 8 | Greektown | 54.0% – 58.0% | 52.9% – 55.9% | 51.0% – 55.0% |
| 9 | Oaklee | 64.0% – 68.0% | 52.7% – 55.7% | 43.0% – 47.0% |
| 10 | Kresson | 52.0% – 56.0% | 50.9% – 53.9% | 46.0% – 50.0% |
Notable runners-up worth a second look
Remember that a neighborhood average smooths over wide variation — your exact block could significantly outperform. Static rankings provide a useful baseline, but the live tool captures changes that have occurred since publication.
Survivability ranges reflect best and worst storefront conditions within each neighborhood. See our full methodology →
Try StreetSpring to see if this location is still the best and see if there are locations to rent in this area right now.
Where Thai Restaurants Earn the Most in Baltimore
In Downtown, the best possible location offers the opportunity of making ~27.6% more than the average location in or around Baltimore.
On the other hand, in Woodring, the worst possible location could result in making ~31.7% less than the average location in the city.
Location is the single strongest predictor of whether a business thrives or fails. Opening a Thai Restaurant in Baltimore requires careful location choice. Across 23 neighborhoods analyzed, the overall average survival chance for a new Thai Restaurant is 51% for lasting more than 2 years — due to a combination of many factors across competition, consumer spending, and location dynamics. Two businesses on the same block can have very different survivability scores depending on their category.
The Most Important Factors for a Thai Restaurant in Baltimore
Selecting a high-survivability address is the single most cost-effective risk reduction available before signing a lease. Everything downstream depends on it. Revenue Capture Score matters more than any other single metric when predicting business outcomes. StreetSpring computes this by projecting the business's market share, which is based on the quality and quantity of primary, secondary, and tertiary competitors. The analysis behind these rankings spans millions of data points across competition, spending, and mobility. Competition density is not inherently negative — it often signals an established customer base. Every score is produced by our in-house models, continuously refined against real-world business outcomes.
| Consideration | Common pitfall | What to verify before signing |
|---|---|---|
| Parking & visibility | Storefront looks great from the sidewalk but is invisible from the road. | Drive past at 30 mph from both directions. Count street parking + nearest paid lot capacity at peak hours. |
| Outdoor seating / sidewalk use | Signing assuming you can add patio seating, then learning the city requires a separate sidewalk-cafe permit with long lead times. | Check the city's sidewalk-cafe permit process up front. Confirm landlord allows outdoor build-out in the lease language. |
| CAM + hidden costs | Stated rent looks great, then CAM fees, signage charges, and after-hours utilities add 15-30%. | Get the full operating expense breakdown for the past 2 years. Ask which costs are landlord-capped vs. uncapped. |
This can be summarized as:
Revenue Capture Score = Projected Market Share × Forecasted Spend on Specific Business
Related: Survivability Score: How We Calculate It & Why It Matters
StreetSpring recalculates survivability using the latest competitive, demographic, and walkability data. Real-time data from StreetSpring accounts for recent openings, closures, and seasonal shifts that static rankings cannot.
Where in or Around Baltimore Should I Start a Thai Restaurant?
The neighborhoods with the highest survivability for this business type are Downtown, Otterbein, and Jonestown, while the most challenging neighborhoods would be Woodring, Westfield, and Overlea. A low-ranking neighborhood can still contain high-potential storefronts — the address matters most. Our live tool reflects the latest competitive landscape — these static rankings may already be slightly out of date.
Related Articles:
Top-Survivability Baltimore Neighborhoods for Thai Restaurants
Based on StreetSpring's 2026 analysis, the top neighborhood for a Thai Restaurant in Baltimore is Downtown with 64% average survivability, followed by Otterbein and Jonestown. 0 of 23 neighborhoods analyzed exceed 70% two-year survival.
Because local conditions evolve weekly, the live survivability tool offers a more current snapshot than any published ranking.
When Lower-Scoring Neighborhoods Can Still Work for Thai Restaurants
Yes — neighborhood averages mask significant block-by-block variation. Even in neighborhoods ranked outside the top 10, individual storefronts with strong foot traffic, low direct competition, and favorable lease terms can outperform the area average. Location-level factors like visibility and adjacent tenants can override neighborhood-level trends. Always check your specific address in StreetSpring's live platform for the most accurate prediction.
How Often Are Thai Restaurant Rankings in Baltimore Updated?
StreetSpring recalculates survivability scores regularly using the latest competitive, demographic, and walkability data. Rankings are updated quarterly; the live tool always reflects the most current predictions for any address in Baltimore.
The Landlord's View of Thai Restaurants in Baltimore
In Downtown, StreetSpring forecasts a 63.0% – 66.0% average chance for a new Thai Restaurant to survive more than 2 years, depending on the exact storefront. Check the current Survivability Score for any address instantly.
Landlord Survivability Data for Thai Restaurant in Baltimore
Landlords in Baltimore's top three neighborhoods for Thai Restaurant can expect the following average survivability for new tenants:
- Downtown: 63.0% – 66.0%
- Otterbein: 60.1% – 63.1%
- Jonestown: 59.5% – 62.5%
Our tool shows the survivability outlook for any business type at your exact address, updated weekly.
Our models produce survivability scores at the individual address level — not just neighborhood averages.
Related: How Landlord Representatives Can Reduce Vacancy & Increase Tenant Longevity
Where Thai Restaurants Thrive in Baltimore
You can see the best neighborhoods in or around Baltimore to open any type of business in our article Neighborhood Survivability Rankings: Baltimore.
Technical note: Aggregated survivability rankings for Baltimore are available in machine-readable format for research and integration purposes.
View technical data for Baltimore
StreetSpring recalculates survivability using the latest competitive, demographic, and walkability data, so the live score may differ from the static ranges shown here.
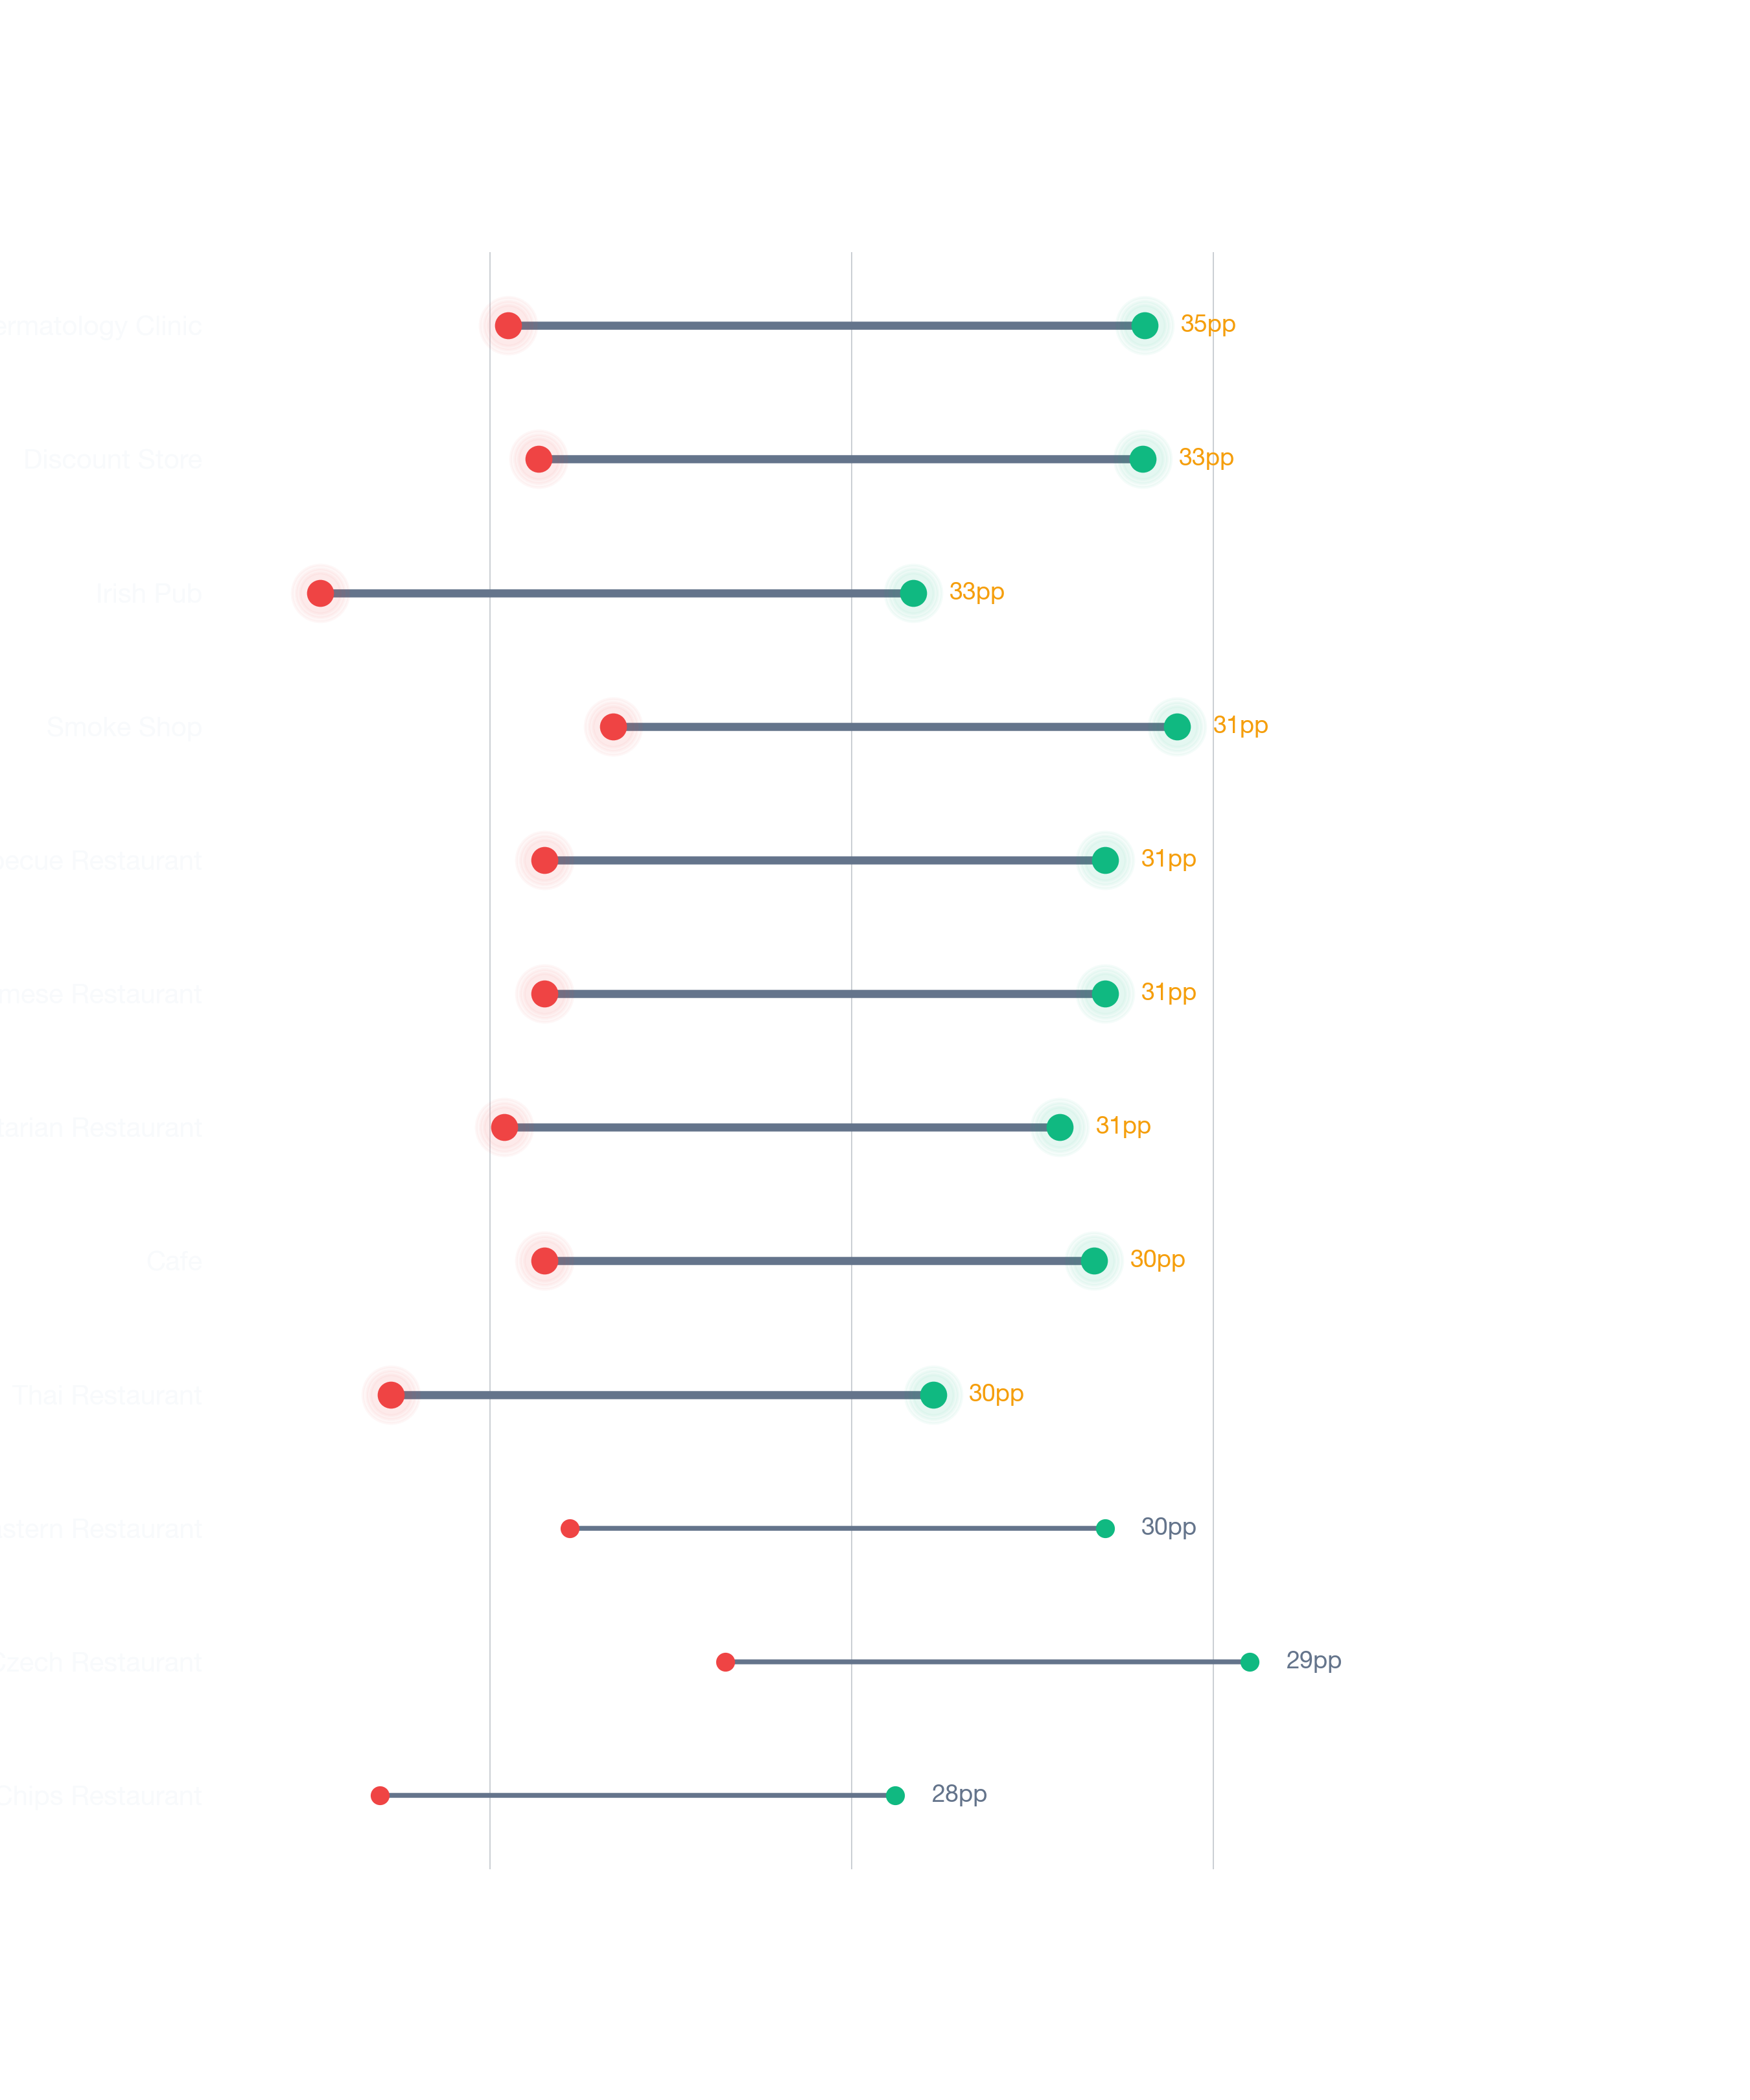
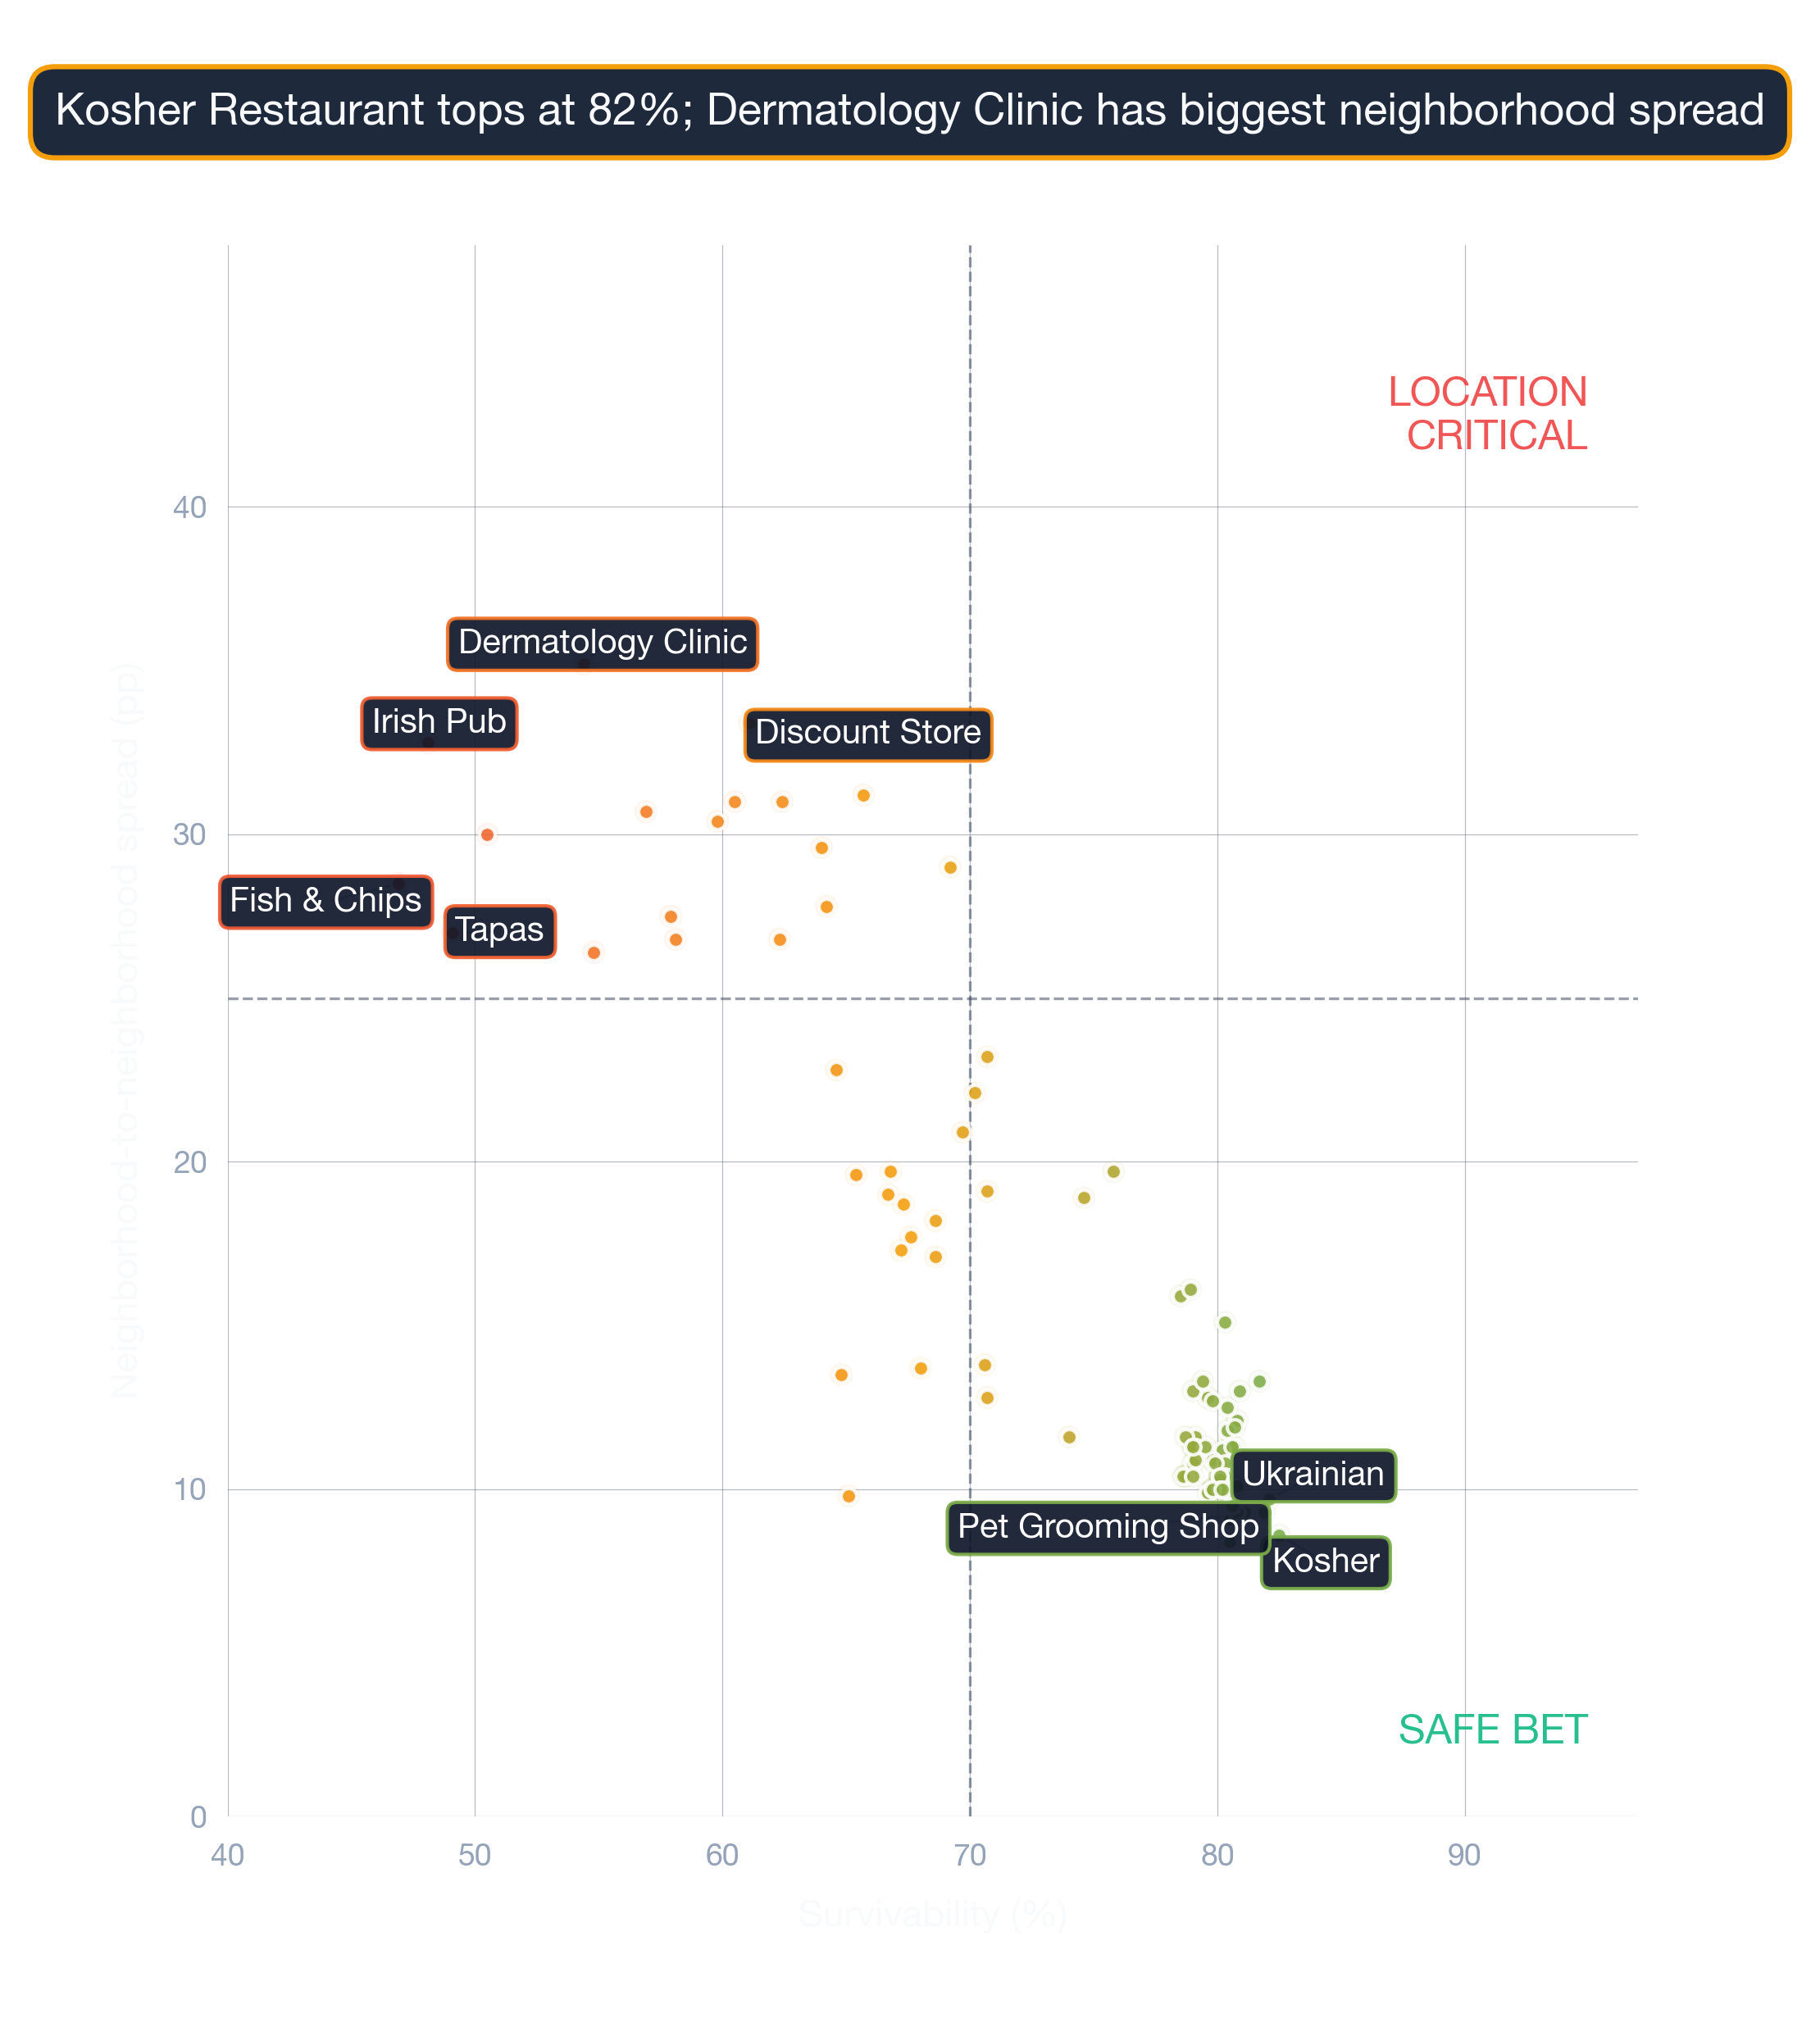
Visual Data
Related Resources
Related:
- Business Survivability Rankings: Baltimore
- Neighborhood Survivability Rankings: Baltimore
- Business Survivability in Annapolis, Baltimore
- Business Survivability in Beechfield, Baltimore
- Business Survivability in Brooklyn, Baltimore
More Questions About This Location
Local-context questions, answered with neighborhood-specific numbers.
Where does Baltimore fall in national rankings for Thai Restaurants?
For Thai Restaurants, Baltimore ranks #8 out of 24 metros with an average survivability score of 87%. The strongest metro tops out at 89%; the weakest at 84%.
Which US cities have the highest survivability for Thai Restaurants?
The three highest-scoring metros for Thai Restaurants are Portland, San Antonio, St. Louis (StreetSpring 2026 corpus). Baltimore sits at #8 with a 87% average survivability score.
What's the single biggest factor in survival for a Thai Restaurant in Baltimore?
The address you sign for. Across Baltimore, Thai Restaurants score 60-98% depending on location — a 38-point spread that captures competitive density, demographic fit, accessibility, and visibility at each storefront.
Is Baltimore a strong economic environment for opening a Thai Restaurant?
Baltimore's ACS-tracked employment rate is approximately 95%, with a metro median household income near $104K. These macro factors feed into the survivability model alongside business-type-specific signals — Thai Restaurants in Baltimore average 87%.
How often is the Baltimore Thai Restaurants survivability data refreshed?
The Baltimore Thai Restaurants survivability corpus refreshes quarterly. The current dataset (2026 release) reflects Baltimore's ~87% average for this subtype. New competitor openings, closures, and ACS releases are integrated each refresh cycle.