Survivability Rankings for Spanish Restaurant in Baltimore
StreetSpring's 2026 analysis ranks the best and worst neighborhoods in Baltimore to open a Spanish Restaurant, from Canton (84% survival) to Old Town (7...
By Bobby Koons | Reviewed: April 27, 2026 | Refreshed weekly | Methodology
Quick Summary
- #1 Neighborhood: Canton — 84% average survivability for Spanish Restaurant
- Neighborhoods at or above 70%: 23 of 23 analyzed
- City-wide average: 79% for Spanish Restaurants
- Most challenging area: Old Town at 74%
- Revenue advantage (top vs. avg location): ~6.3% more expected revenue in Canton
- Data freshness: 2026 data · Full methodology →
Table of Contents
- Summary
- 10 Best Neighborhoods
- Where Would a Spanish Restaurant Make the Most Money?
- What Should I Consider?
- Where Should I Start?
- FAQ: Best Neighborhoods
- FAQ: Can a Spanish Restaurant Succeed in Lower-Ranked Areas?
- FAQ: How Often Are Rankings Updated?
- FAQ: Is a Spanish Restaurant a Good Tenant?
- Landlord Survivability Data
- Best Neighborhoods for Any Business
Summary
Canton leads Baltimore's 2026 survivability rankings for Spanish Restaurant operators with 84% average chance of surviving more than 2 years, with the best locations offering 87% and the most challenging locations in Canton at 80%. The worst neighborhoods include Old Town with 74% average chance. Location-level factors like visibility and adjacent tenants can override neighborhood-level trends.
Where in Baltimore Should You Open a Spanish Restaurant?
Canton ranks #1 of 23 neighborhoods analyzed in and around Baltimore for Spanish Restaurant survivability with a score of 84% as of 2026. The top 10 neighborhoods are:
Why these rankings reflect real survival outcomes
| Rank | Neighborhood | Best Locations | Average Locations | Challenging Locations |
|---|---|---|---|---|
| 1 | Canton | 84.0% – 88.0% | 82.7% – 85.3% | 79.0% – 83.0% |
| 2 | Kresson | 87.0% – 91.0% | 82.2% – 84.8% | 74.0% – 78.0% |
| 3 | Eastwood | 93.0% – 97.0% | 81.6% – 84.2% | 71.0% – 75.0% |
| 4 | Towson | 94.0% – 97.0% | 80.9% – 83.6% | 71.0% – 75.0% |
| 5 | Greektown | 90.0% – 94.0% | 80.7% – 83.3% | 72.0% – 76.0% |
| 6 | Medford | 82.0% – 86.0% | 80.1% – 82.7% | 74.0% – 78.0% |
| 7 | Beechfield | 92.0% – 96.0% | 78.6% – 81.3% | 68.0% – 72.0% |
| 8 | Woodring | 80.0% – 84.0% | 78.6% – 81.2% | 76.0% – 80.0% |
| 9 | Oaklee | 91.0% – 95.0% | 78.3% – 80.9% | 72.0% – 76.0% |
| 10 | Annapolis | 92.0% – 96.0% | 78.1% – 80.7% | 64.0% – 68.0% |
How to use this list when you tour locations
Neighborhood averages mask significant block-by-block variation — always check your specific address. Real-time data from StreetSpring accounts for recent openings, closures, and seasonal shifts that static rankings cannot.
Survivability ranges reflect best and worst storefront conditions within each neighborhood. See our full methodology →
Try StreetSpring to see if this location is still the best and see if there are locations to rent in this area right now.
Which Baltimore Neighborhoods Drive the Highest Spanish Restaurant Revenue?
In Canton, the best possible location offers the opportunity of making ~6.3% more than the average location in or around Baltimore.
On the other hand, in Old Town, the worst possible location could result in making ~6.9% less than the average location in the city.
The difference between success and failure often comes down to where you sign the lease. Opening a Spanish Restaurant in Baltimore requires careful location choice. Across 23 neighborhoods analyzed, the overall average survival chance for a new Spanish Restaurant is 79% for lasting more than 2 years — due to a combination of many factors across competition, consumer spending, and location dynamics. Our models show that the optimal location profile varies dramatically from one business category to the next.
Key Considerations Before Opening a Spanish Restaurant in Baltimore
Picking the right location is the single highest-leverage decision in launching this business — Survivability Score is the lens that frames the rest of the decision. Our models show that Revenue Capture Score explains more outcome variance than any other individual metric. StreetSpring computes this by projecting the business's market share, which is based on the quality and quantity of primary, secondary, and tertiary competitors. Our forecasting engine processes data from over 24 metro areas covering 180+ million consumers. Areas with complementary competitors tend to generate higher overall foot traffic. Our proprietary models incorporate data sources not available through any public platform.
| Area to check | What can go wrong | How to de-risk it |
|---|---|---|
| Outdoor seating / sidewalk use | Signing assuming you can add patio seating, then learning the city requires a separate sidewalk-cafe permit with long lead times. | Check the city's sidewalk-cafe permit process up front. Confirm landlord allows outdoor build-out in the lease language. |
| Competitor density | Counting only direct competitors and missing adjacent-category overlap (e.g. coffee shop near a bakery). | Map all businesses serving overlapping customer needs within a 5-min walk. Use StreetSpring's competitor view as a starting point. |
| CAM + hidden costs | Stated rent looks great, then CAM fees, signage charges, and after-hours utilities add 15-30%. | Get the full operating expense breakdown for the past 2 years. Ask which costs are landlord-capped vs. uncapped. |
This can be summarized as:
Revenue Capture Score = Projected Market Share × Forecasted Spend on Specific Business
Related: Survivability Score: How We Calculate It & Why It Matters
StreetSpring recalculates survivability using the latest competitive, demographic, and walkability data. StreetSpring's Survivability Scores are updated regularly, so the most accurate prediction for your exact storefront is always available in the live tool.
Where in or Around Baltimore Should I Start a Spanish Restaurant?
The highest-performing areas for this business type are Canton, Kresson, and Eastwood, while the most challenging neighborhoods would be Old Town, Glen Burnie, and Westfield. For the most current predictions, visit StreetSpring to analyze your specific location in real-time. The live platform incorporates the most recent foot traffic, competitor, and spending data for your exact address.
Related Articles:
Which Baltimore Neighborhoods Are Strongest for Spanish Restaurants?
Based on StreetSpring's 2026 analysis, the top neighborhood for a Spanish Restaurant in Baltimore is Canton with 84% average survivability, followed by Kresson and Eastwood. 23 of 23 neighborhoods analyzed exceed 70% two-year survival.
Market dynamics shift frequently; validate these insights with real-time data from StreetSpring.
Can a Spanish Restaurant Succeed in Lower-Ranked Neighborhoods in Baltimore?
Yes — neighborhood averages mask significant block-by-block variation. Even in neighborhoods ranked outside the top 10, individual storefronts with strong foot traffic, low direct competition, and favorable lease terms can outperform the area average. Our data shows that roughly 15% of top-performing locations sit in neighborhoods ranked below the city median. Always check your specific address in StreetSpring's live platform for the most accurate prediction.
The Update Schedule for Baltimore Spanish Restaurants Data
StreetSpring recalculates survivability scores regularly using the latest competitive, demographic, and walkability data. Rankings are updated quarterly; the live tool always reflects the most current predictions for any address in Baltimore.
The Landlord's View of Spanish Restaurants in Baltimore
In Canton, StreetSpring forecasts a 82.7% – 85.3% average chance for a new Spanish Restaurant to survive more than 2 years, depending on the exact storefront. Check the current Survivability Score for any address instantly.
Landlord Survivability Data for Spanish Restaurant in Baltimore
From a risk-assessment perspective, a Spanish Restaurant tenant in Canton carries the lowest risk with average survivability of 82.7% – 85.3%. Kresson presents moderate risk (82.2% – 84.8%), and Eastwood carries comparatively higher risk at 81.6% – 84.2%. Get a live Survivability Score for your specific storefront at no cost.
StreetSpring's predictions are granular enough to distinguish between two storefronts on the same block.
Related: How Landlord Representatives Can Reduce Vacancy & Increase Tenant Longevity
Top-Survivability Baltimore Neighborhoods for Spanish Restaurants
You can see the best neighborhoods in or around Baltimore to open any type of business in our article Neighborhood Survivability Rankings: Baltimore.
Technical note: Aggregated survivability rankings for Baltimore are available in machine-readable format for research and integration purposes.
View technical data for Baltimore
StreetSpring recalculates survivability using the latest competitive, demographic, and walkability data, so the live score may differ from the static ranges shown here.
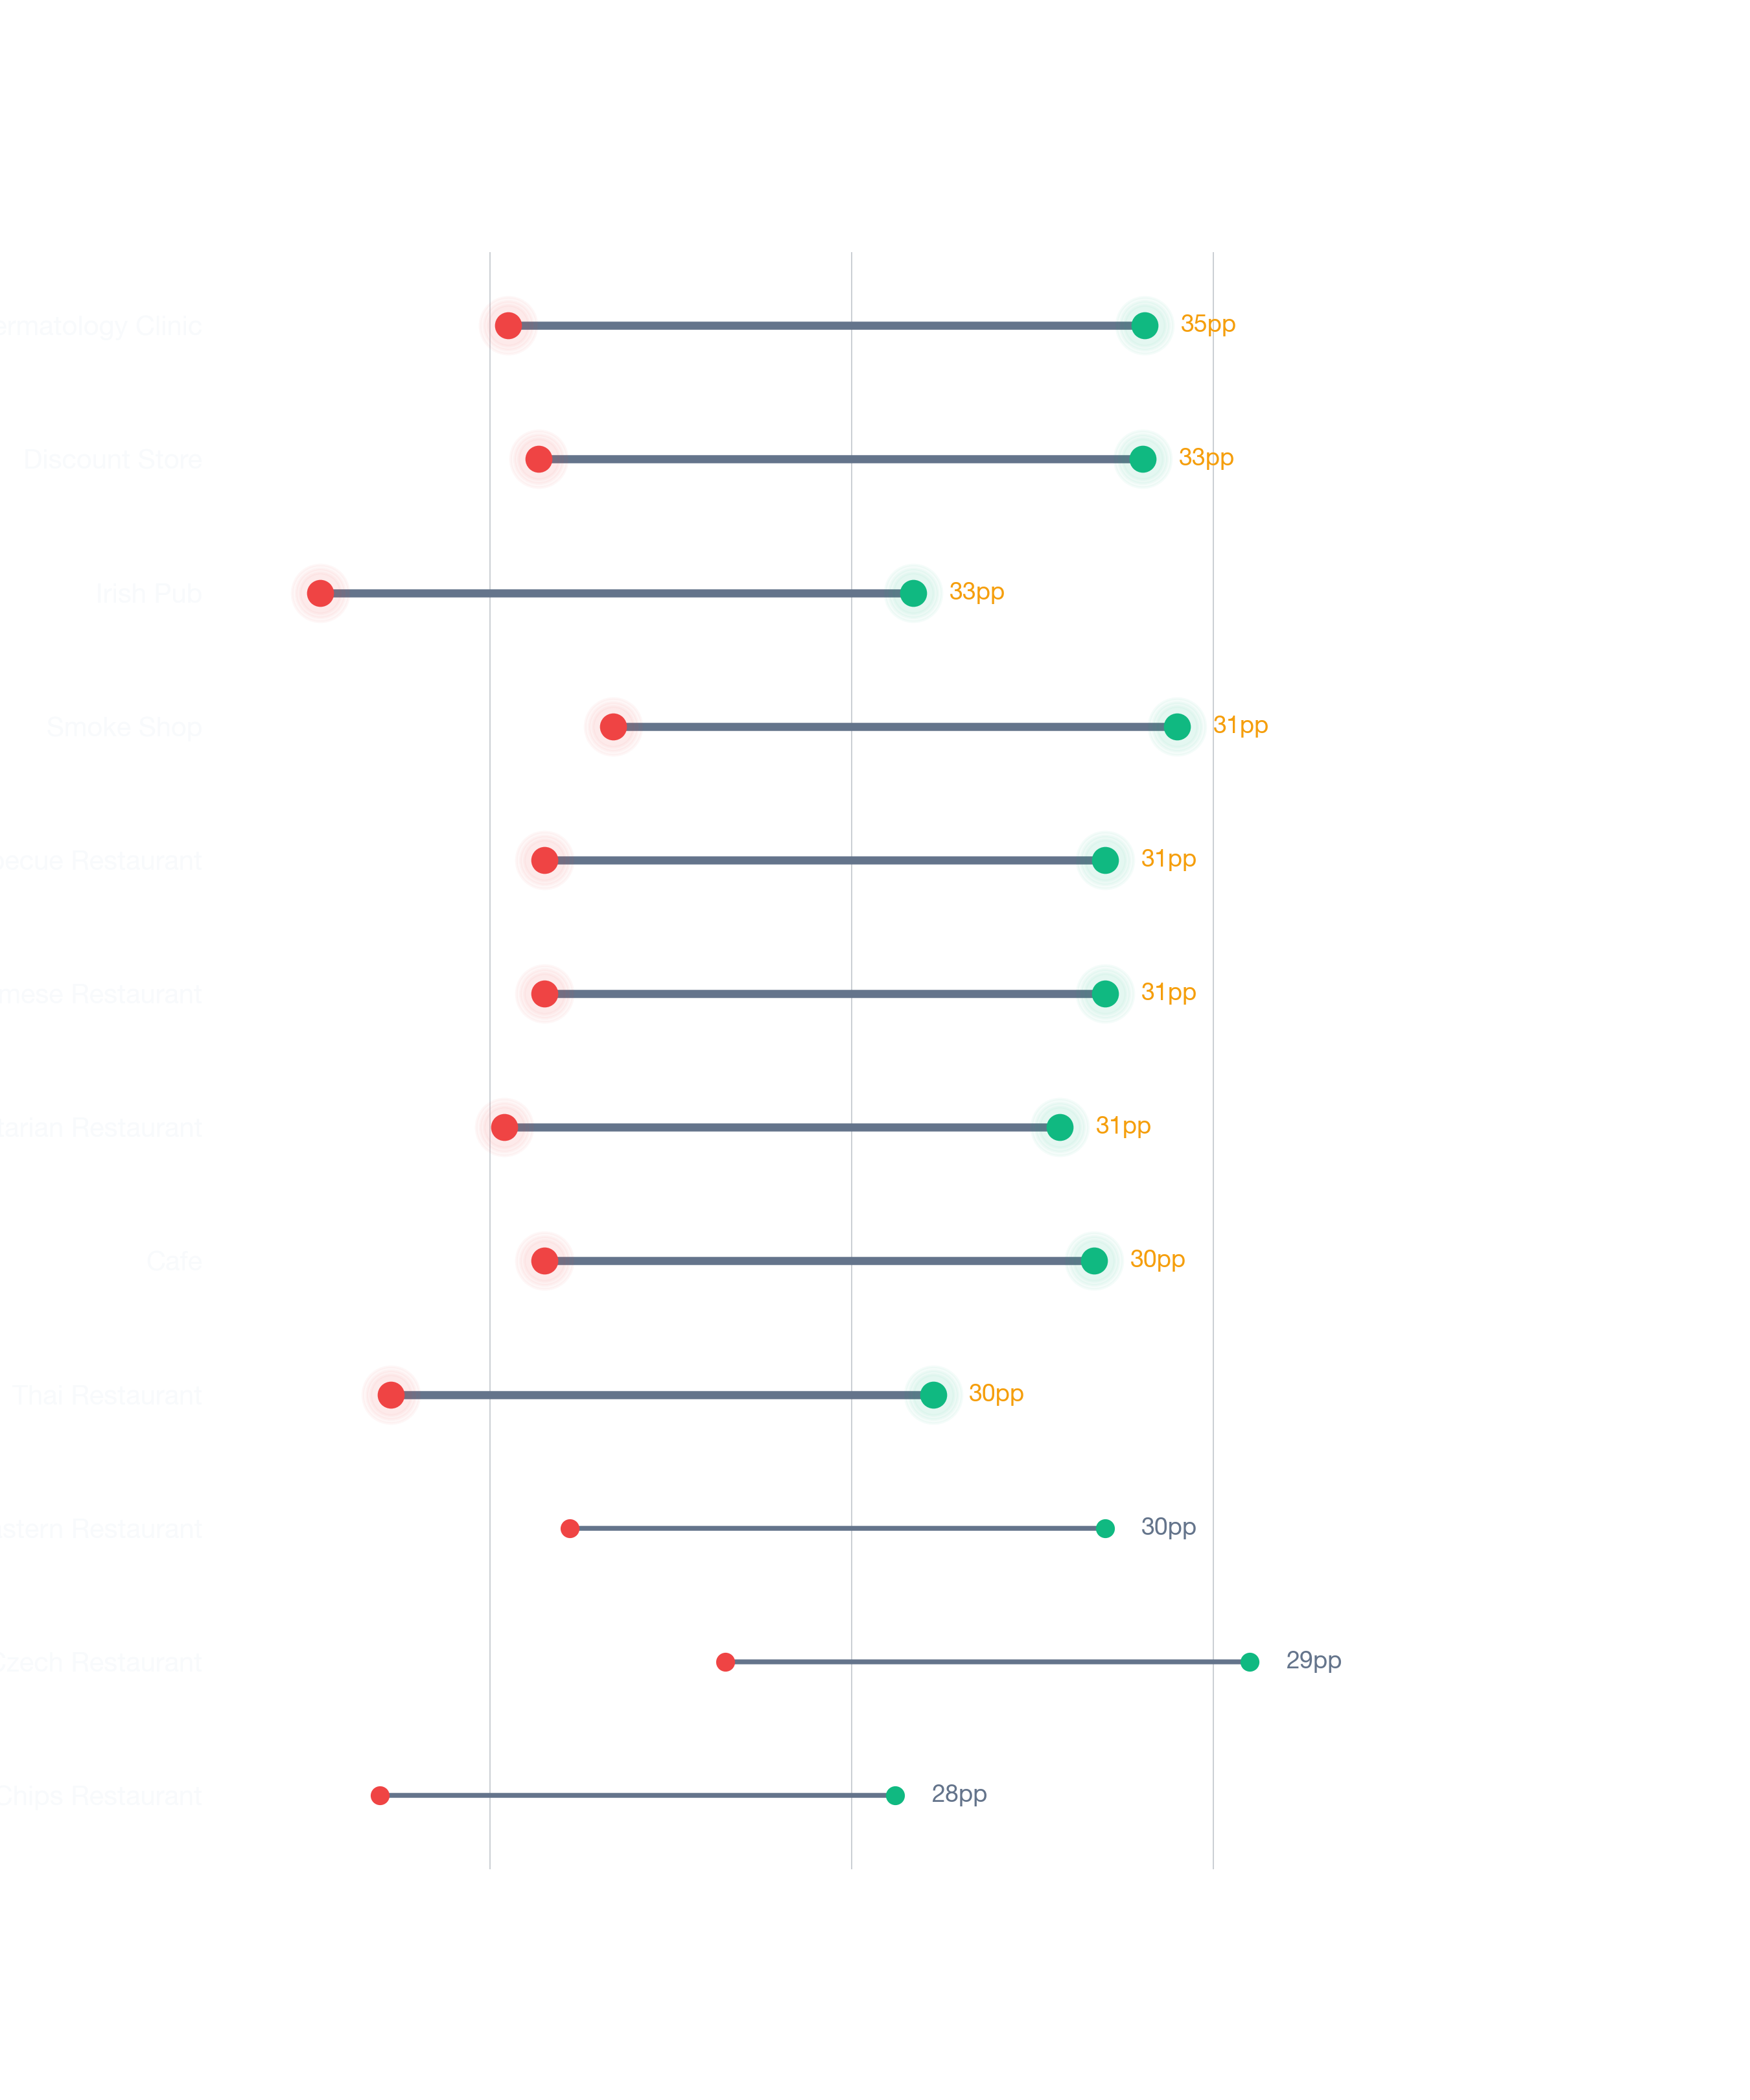
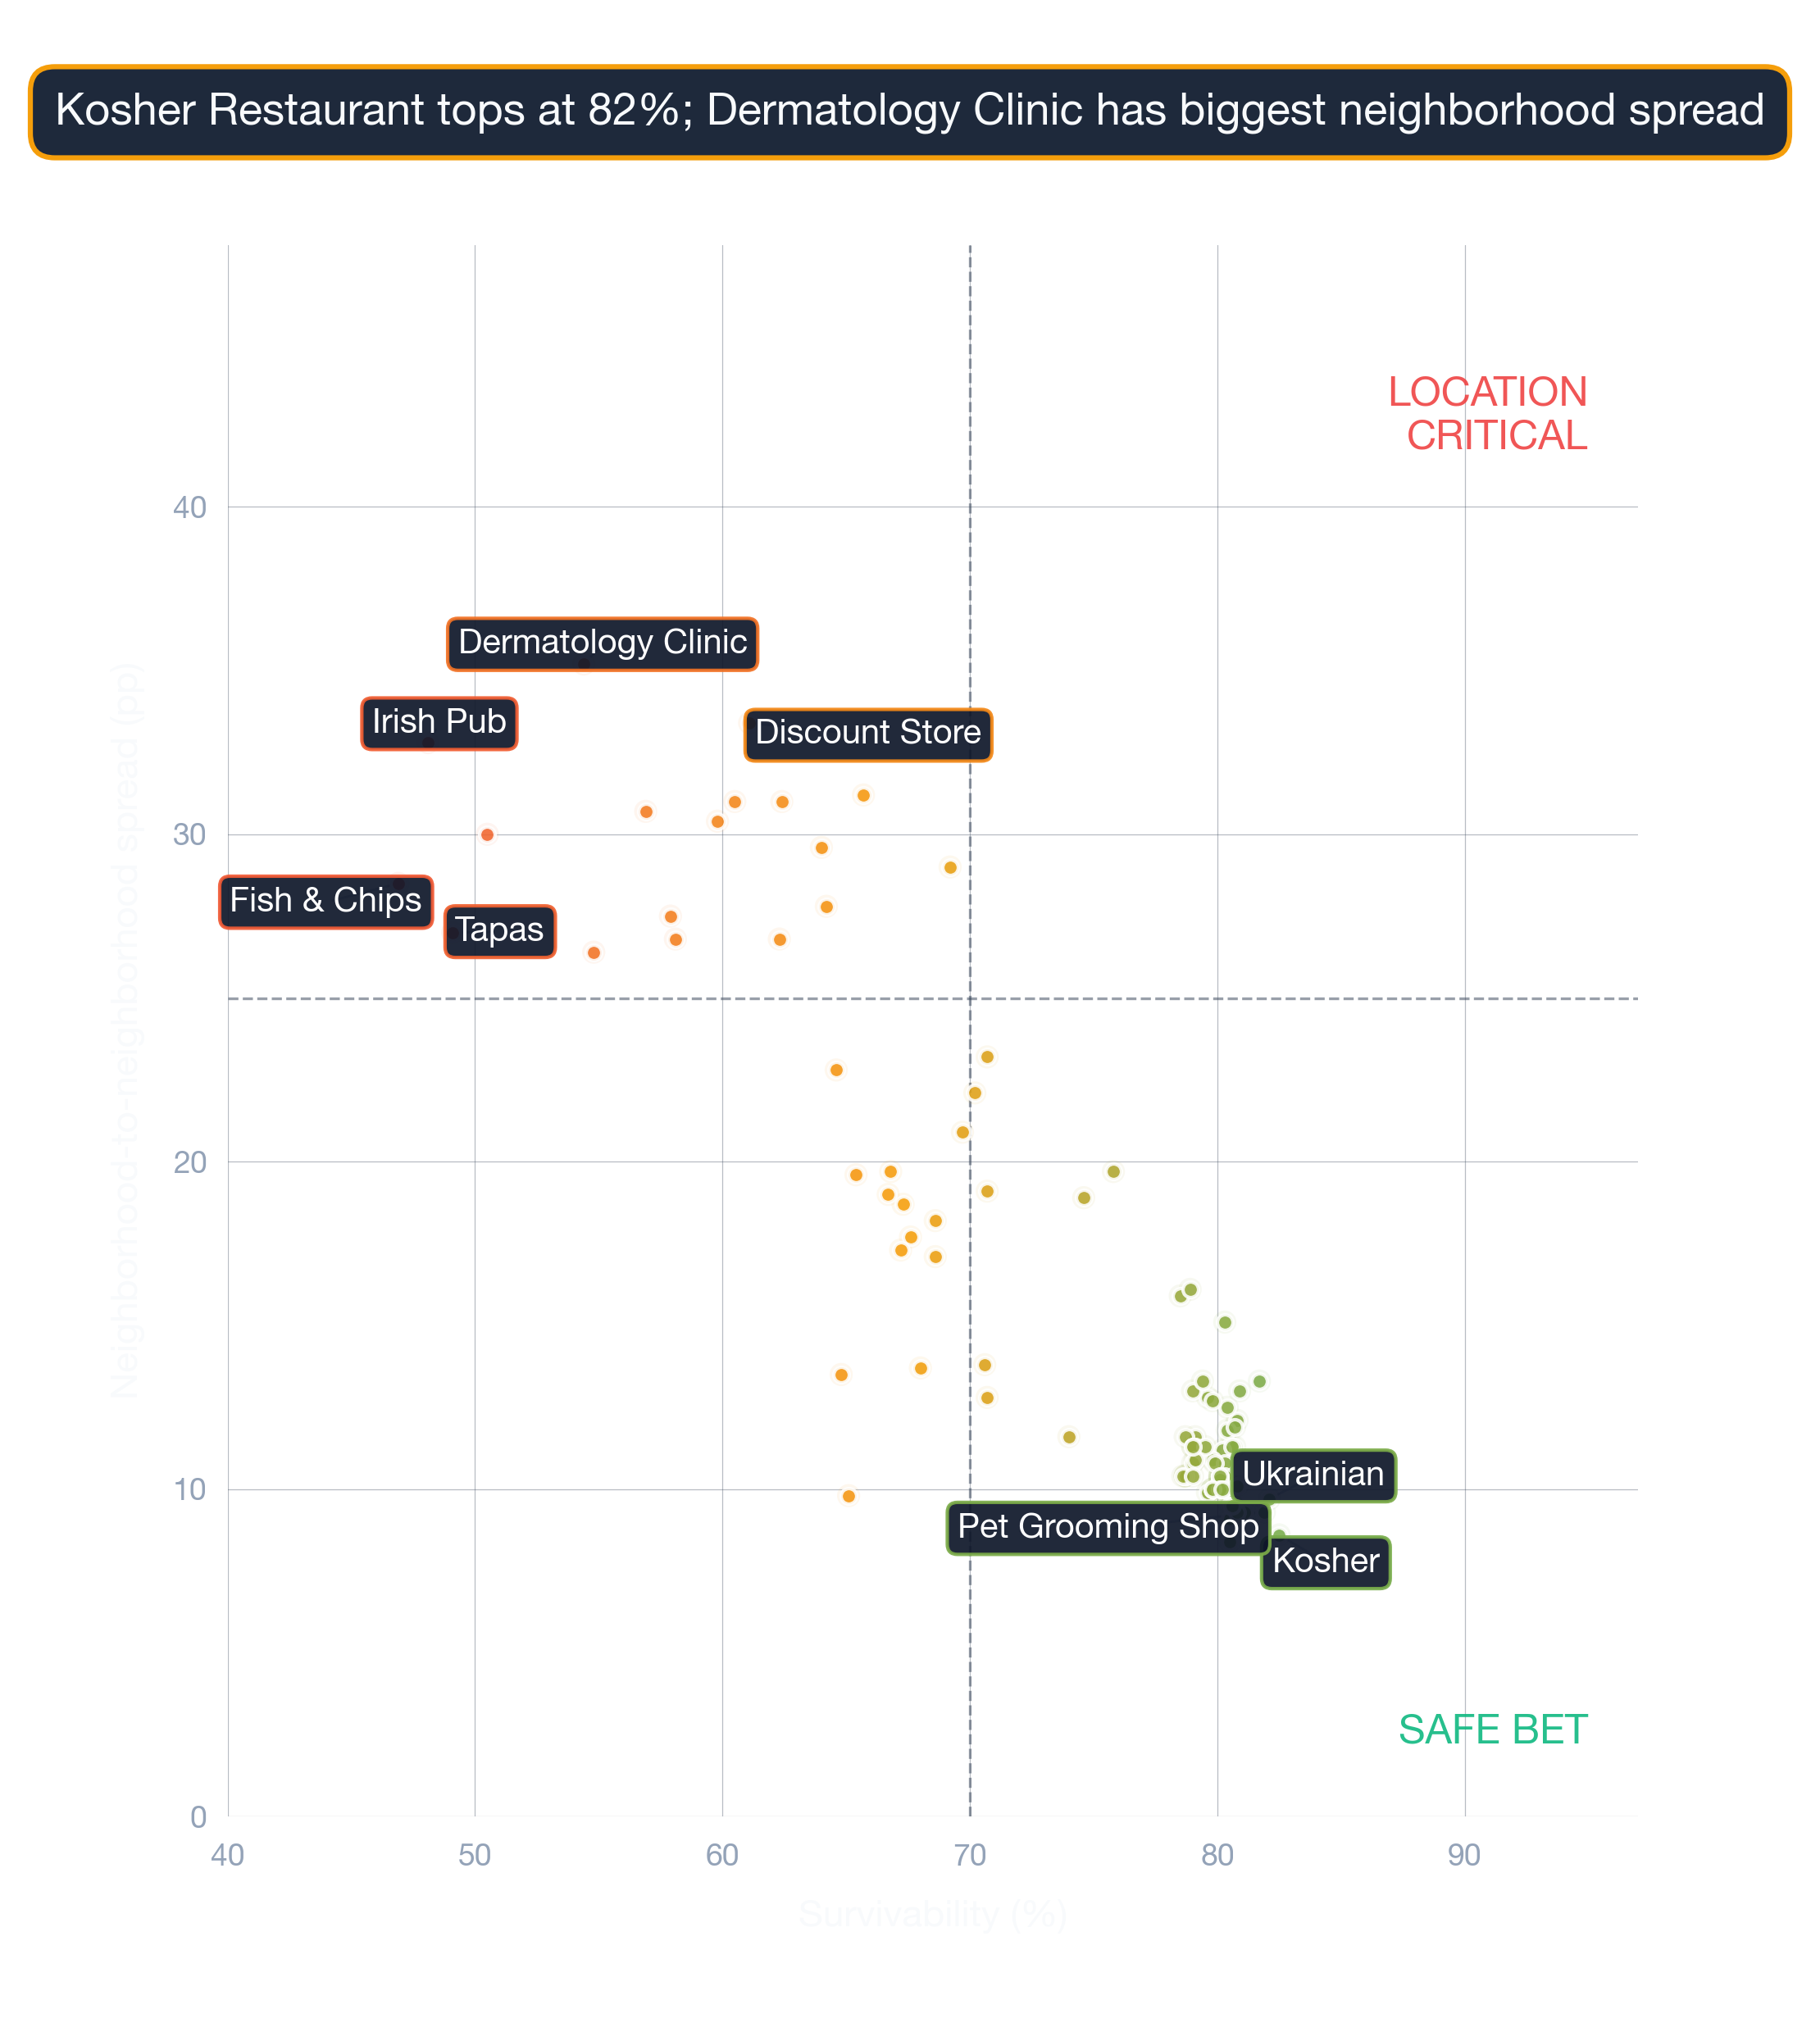
Visual Data
Related Resources
Related:
- Business Survivability Rankings: Baltimore
- Neighborhood Survivability Rankings: Baltimore
- Business Survivability in Annapolis, Baltimore
- Business Survivability in Beechfield, Baltimore
- Business Survivability in Brooklyn, Baltimore
More Questions About This Location
More questions answered with neighborhood-specific data from our 2026 corpus.
What's the gap between the best and worst Baltimore locations for a Spanish Restaurant?
In Baltimore, Spanish Restaurants score between 61% and 98% on StreetSpring's survivability scale — a 37-point gap between worst and best locations for the same business type.
What are the top metros nationally for opening a Spanish Restaurant?
Across 24 US metros, Portland, San Antonio, St. Louis top the rankings for Spanish Restaurants. Baltimore comes in at #7 with an average score of 87%.
Is Baltimore a strong economic environment for opening a Spanish Restaurant?
Broader metro: ~95% employment rate, ~$104K median income per ACS. Spanish Restaurants survivability in Baltimore averages 87%, with the model layering business-specific and site-specific factors on top.
Do Spanish Restaurants need walkable locations in Baltimore?
ACS data shows Baltimore's median commute at ~30 minutes — accessibility patterns vary widely by neighborhood. Spanish Restaurants survivability in Baltimore ranges 61-98% across locations, with accessibility one of the bigger contributing factors.