Survivability Rankings for Pizza Restaurant in Baltimore
StreetSpring's 2026 analysis ranks the best and worst neighborhoods in Baltimore to open a Pizza Restaurant, from Canton (85% survival) to Old Town (74%).
By Bobby Koons | Last reviewed by Bobby Koons on May 6, 2026 | Methodology
Quick Summary
- #1 Neighborhood: Canton — 85% average survivability for Pizza Restaurant
- Neighborhoods at or above 70%: 23 of 23 analyzed
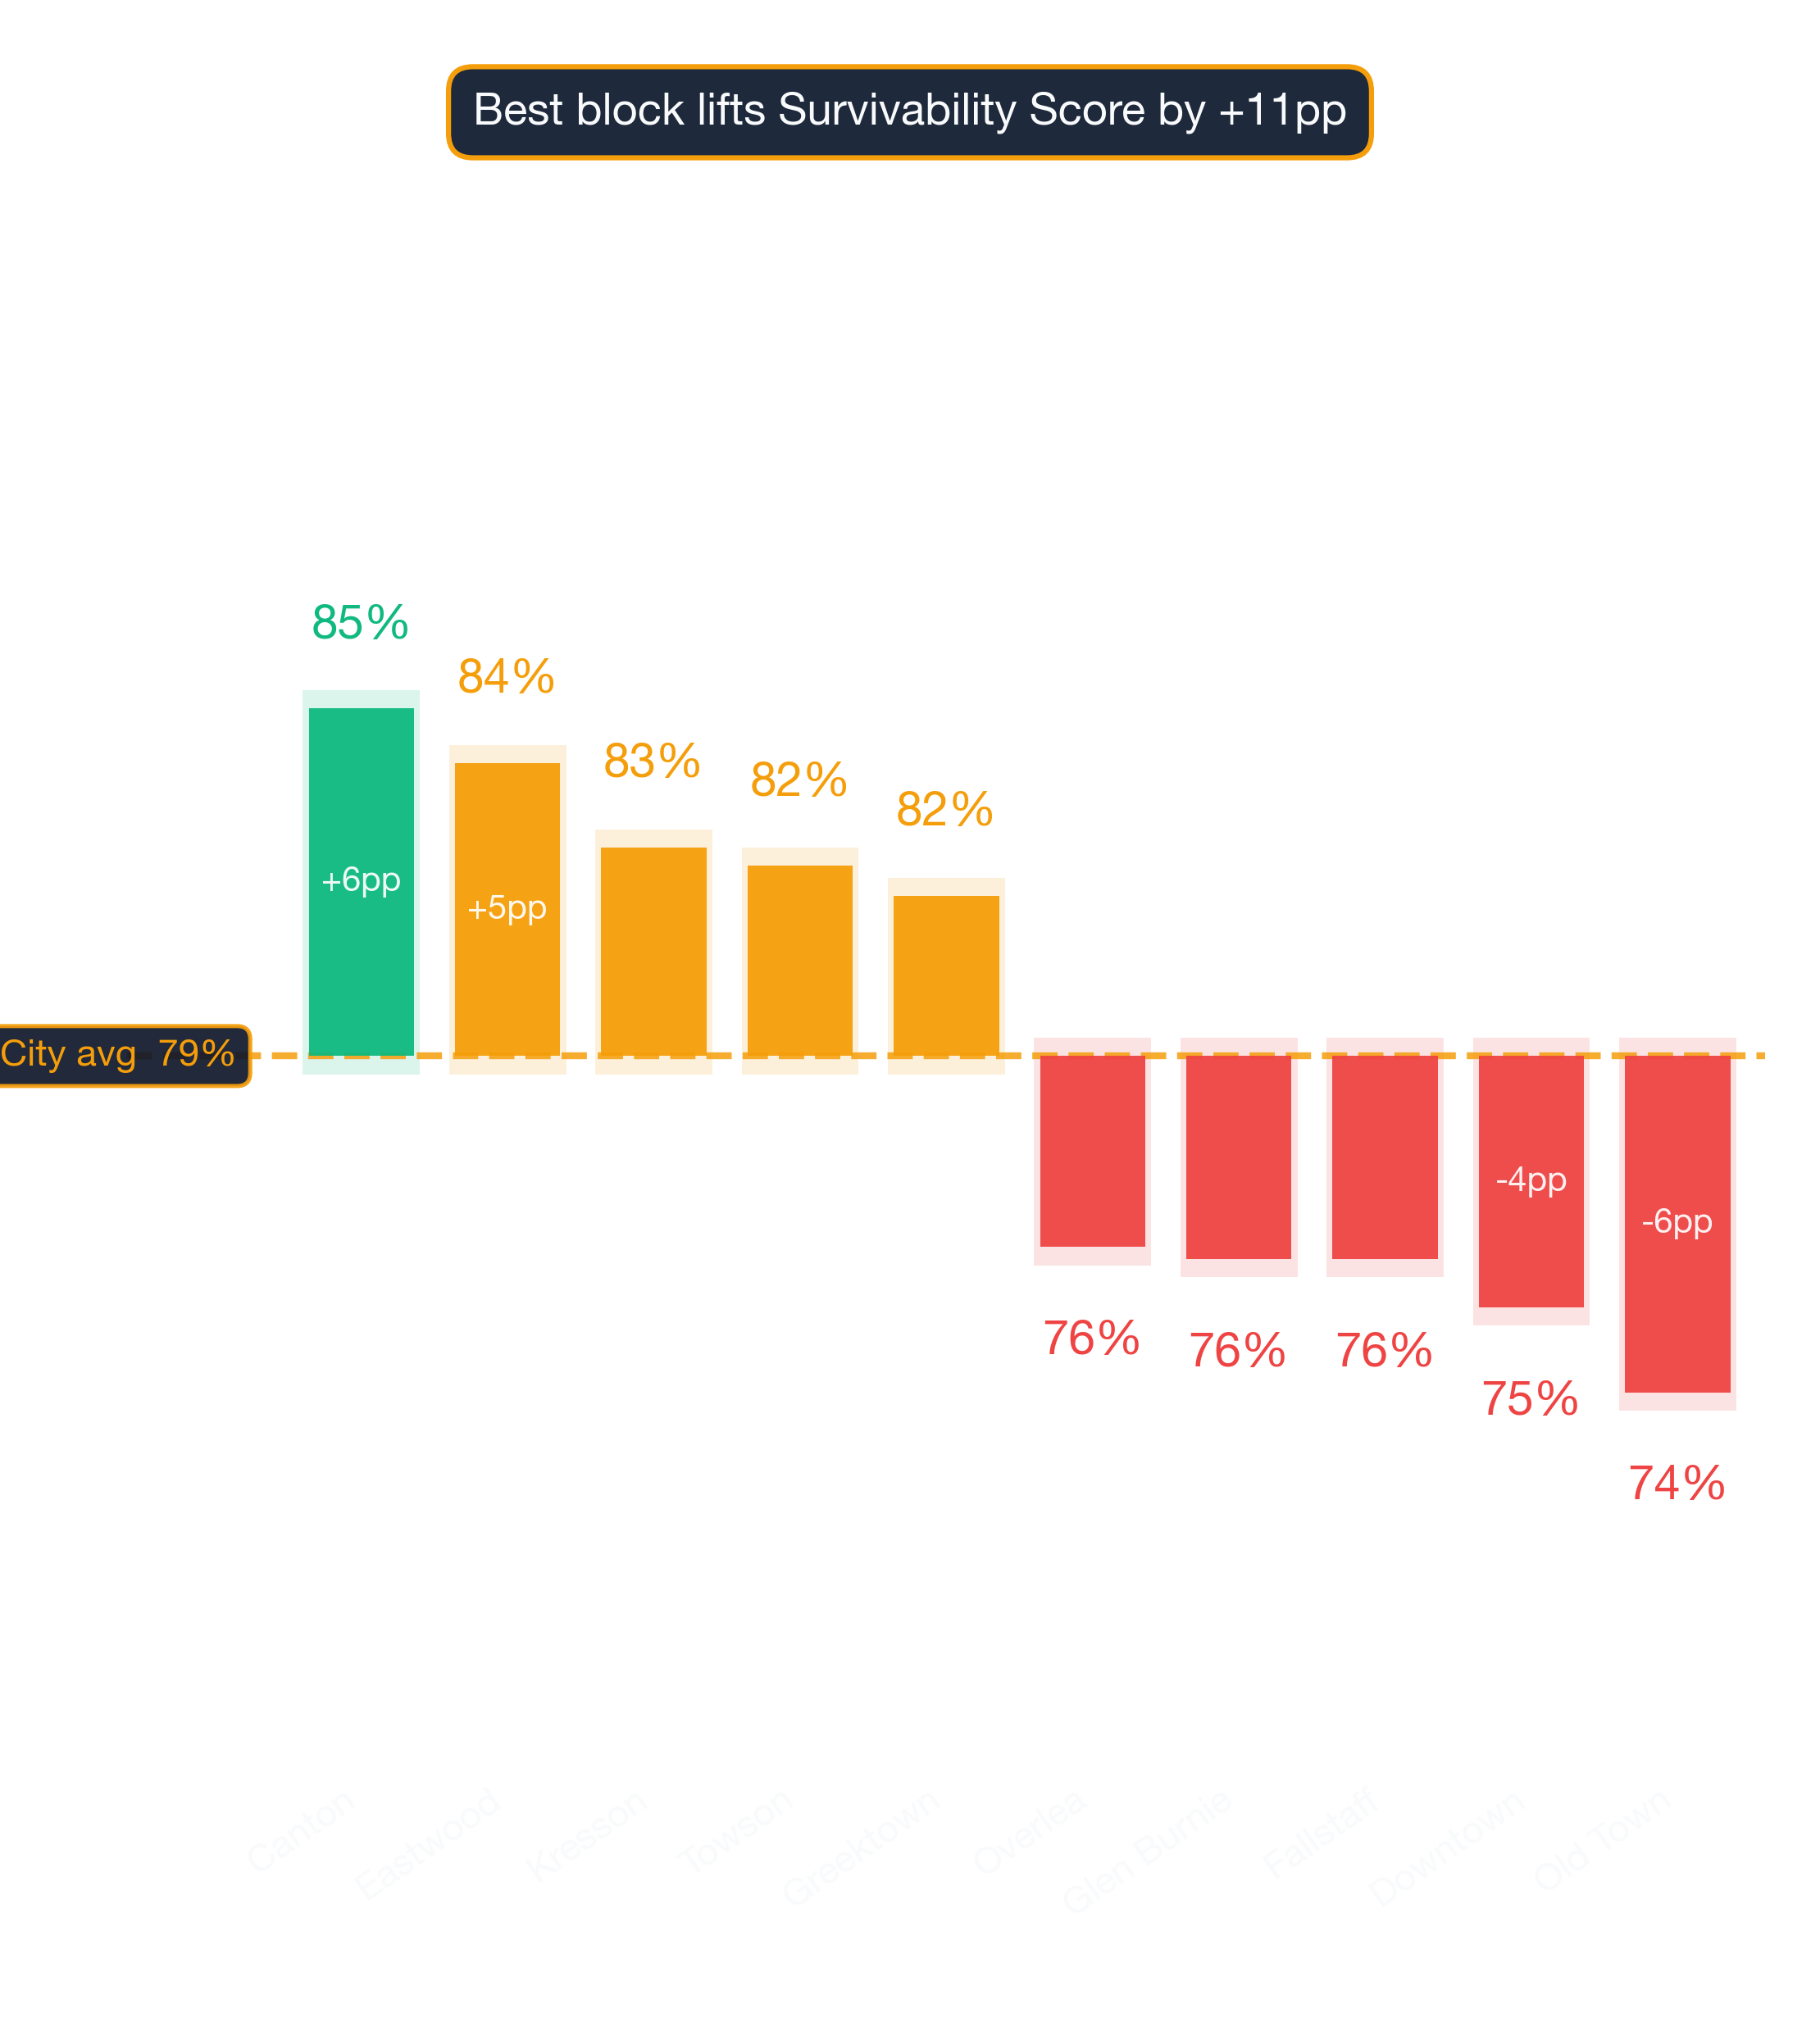
- City-wide average: 79% for Pizza Restaurants
- Most challenging area: Old Town at 74%
- Revenue advantage (top vs. avg location): ~7.3% more expected revenue in Canton
- Data freshness: 2026 data · Full methodology →
Table of Contents
- Summary
- 10 Best Neighborhoods
- Where Would a Pizza Restaurant Make the Most Money?
- What Should I Consider?
- Where Should I Start?
- FAQ: Best Neighborhoods
- FAQ: Can a Pizza Restaurant Succeed in Lower-Ranked Areas?
- FAQ: How Often Are Rankings Updated?
- FAQ: Is a Pizza Restaurant a Good Tenant?
- Landlord Survivability Data
- Best Neighborhoods for Any Business
Summary
Canton leads Baltimore's 2026 survivability rankings for Pizza Restaurant operators with 85% average chance of surviving more than 2 years, with the best locations offering 87% and the most challenging locations in Canton at 82%. The worst neighborhoods include Old Town with 74% average chance. These rankings are based on the latest available data; check StreetSpring for real-time updates.
Where in Baltimore Should You Open a Pizza Restaurant?
Canton ranks #1 of 23 neighborhoods analyzed in and around Baltimore for Pizza Restaurant survivability with a score of 85% as of 2026. The top 10 neighborhoods are:
Where the rankings might surprise you
| Rank | Neighborhood | Best Locations | Average Locations | Challenging Locations |
|---|---|---|---|---|
| 1 | Canton | 84.0% – 88.0% | 82.8% – 86.3% | 81.0% – 85.0% |
| 2 | Eastwood | 94.0% – 97.0% | 81.8% – 85.4% | 73.0% – 77.0% |
| 3 | Kresson | 87.0% – 91.0% | 80.5% – 84.0% | 73.0% – 77.0% |
| 4 | Towson | 94.0% – 97.0% | 80.1% – 83.7% | 68.0% – 72.0% |
| 5 | Greektown | 90.0% – 94.0% | 79.6% – 83.2% | 71.0% – 75.0% |
| 6 | Woodring | 81.0% – 85.0% | 79.4% – 83.0% | 78.0% – 82.0% |
| 7 | Beechfield | 91.0% – 95.0% | 78.8% – 82.4% | 68.0% – 72.0% |
| 8 | Medford | 82.0% – 86.0% | 78.6% – 82.2% | 73.0% – 77.0% |
| 9 | Oaklee | 92.0% – 96.0% | 78.1% – 81.7% | 73.0% – 77.0% |
| 10 | Annapolis | 92.0% – 96.0% | 77.3% – 80.9% | 63.0% – 67.0% |
What separates the top neighborhoods from the rest
StreetSpring's Survivability Scores are updated regularly, so the most accurate prediction for your exact storefront is always available in the live tool. New competitor openings and closures happen weekly — the live tool ensures you see the latest picture.
Survivability ranges reflect best and worst storefront conditions within each neighborhood. See our full methodology →
Try StreetSpring to see if this location is still the best and see if there are locations to rent in this area right now.
Baltimore's Best-Earning Neighborhoods for Pizza Restaurants
In Canton, the best possible location offers the opportunity of making ~7.3% more than the average location in or around Baltimore.
On the other hand, in Old Town, the worst possible location could result in making ~7.0% less than the average location in the city.
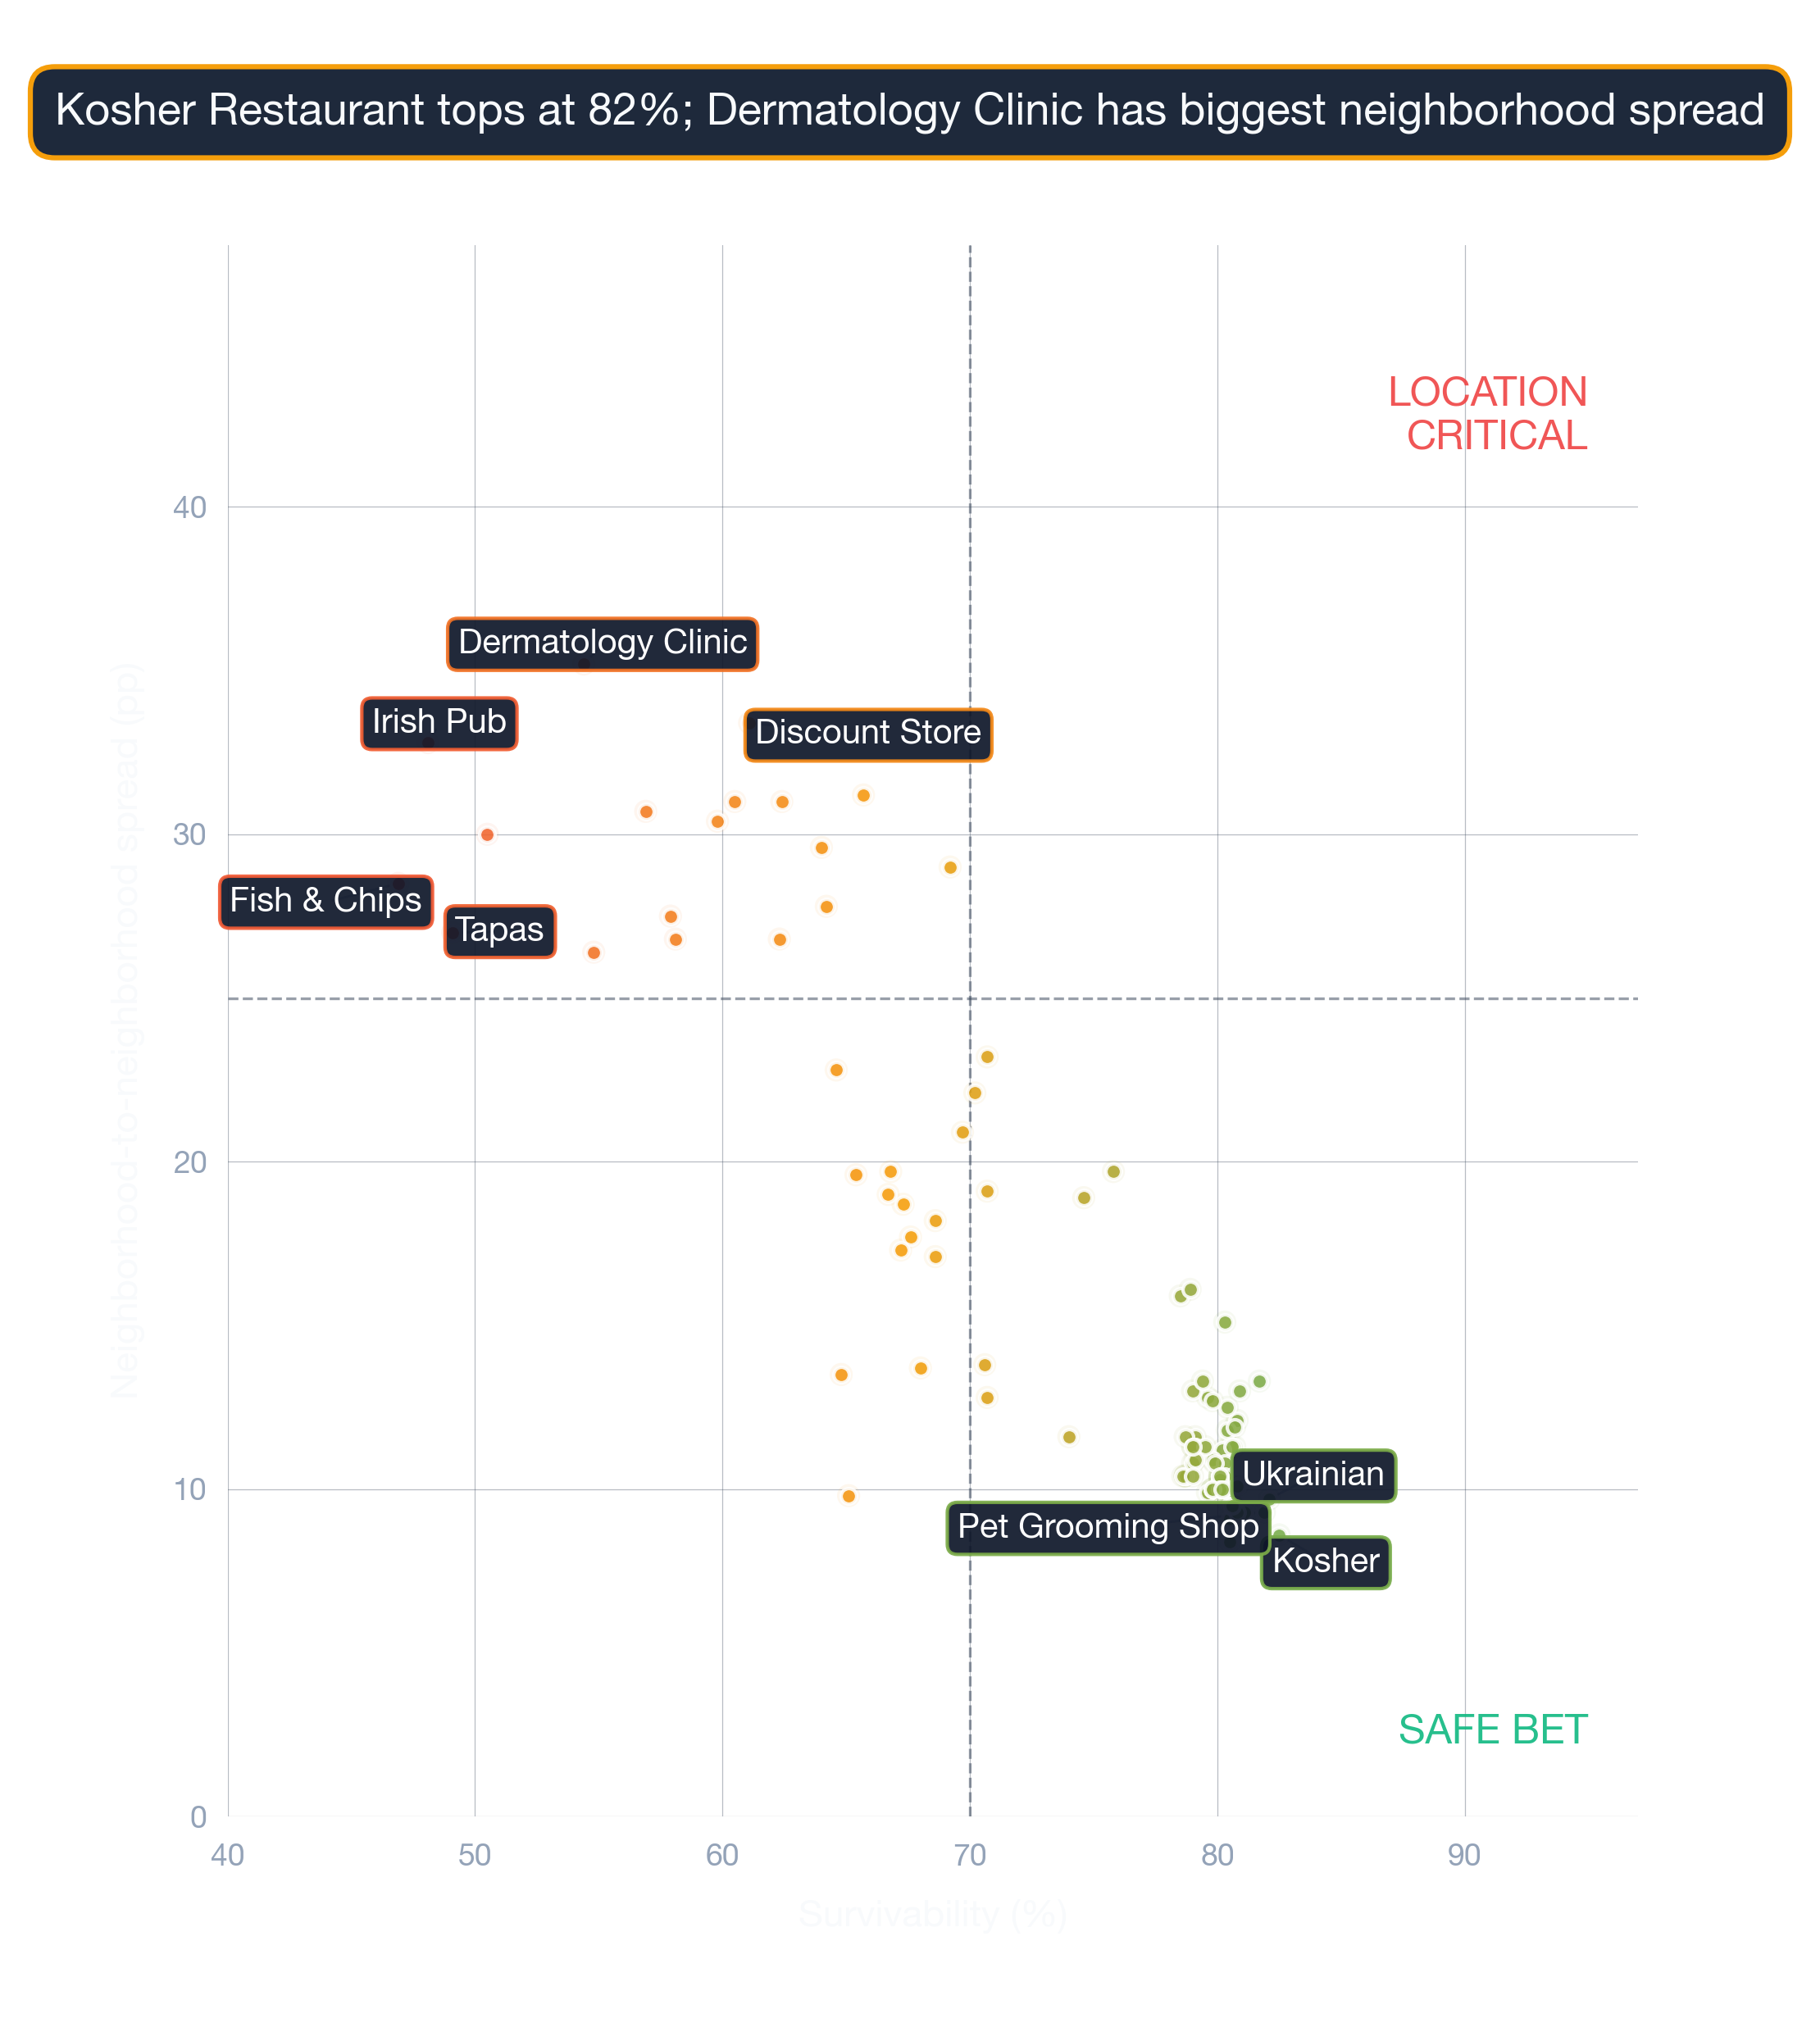
Your choice of location outweighs almost every other business decision combined. Opening a Pizza Restaurant in Baltimore requires careful location choice. Across 23 neighborhoods analyzed, the overall average survival chance for a new Pizza Restaurant is 79% for lasting more than 2 years — due to a combination of many factors across competition, consumer spending, and location dynamics. The interplay between location characteristics and business type produces unique survivability scores for every combination.
What to Think About When Launching a Pizza Restaurant in Baltimore
Selecting a high-survivability address is the single most cost-effective risk reduction available before signing a lease. Everything downstream depends on it. Among all factors in our model, Revenue Capture Score carries the most weight in determining long-term survivability. StreetSpring computes this by projecting the business's market share, which is based on the quality and quantity of primary, secondary, and tertiary competitors. StreetSpring measures competition through a 30-factor framework. Competition density is not inherently negative — it often signals an established customer base. Every score is produced by our in-house models, continuously refined against real-world business outcomes.
| Factor | Where new owners get tripped up | Questions to ask before you sign |
|---|---|---|
| Build-out budget | Underestimating mechanical, electrical, and plumbing — the "hidden" 30-50% of build-out cost. | Get 3 quotes from licensed contractors and pad budget by +20% for surprises. Confirm landlord TI allowance in writing. |
| Competitor density | Counting only direct competitors and missing adjacent-category overlap (e.g. coffee shop near a bakery). | Map all businesses serving overlapping customer needs within a 5-min walk. Use StreetSpring's competitor view as a starting point. |
| CAM + hidden costs | Stated rent looks great, then CAM fees, signage charges, and after-hours utilities add 15-30%. | Get the full operating expense breakdown for the past 2 years. Ask which costs are landlord-capped vs. uncapped. |
This can be summarized as:
Revenue Capture Score = Projected Market Share × Forecasted Spend on Specific Business
Related: Survivability Score: How We Calculate It & Why It Matters
StreetSpring recalculates survivability using the latest competitive, demographic, and walkability data. Real-time data from StreetSpring accounts for recent openings, closures, and seasonal shifts that static rankings cannot.
Pinpointing the Right Neighborhood for a Pizza Restaurant in Baltimore
According to StreetSpring's data, optimal neighborhoods include Canton, Eastwood, and Kresson, while the most challenging neighborhoods would be Old Town, Downtown, and Fallstaff. Block-level dynamics move daily, so the live StreetSpring tool is the most accurate source for a specific address right now. StreetSpring's Survivability Scores are updated regularly, so the most accurate prediction for your exact storefront is always available in the live tool.
Related Articles:
Which Baltimore Neighborhoods Are Strongest for Pizza Restaurants?
Based on StreetSpring's 2026 analysis, the top neighborhood for a Pizza Restaurant in Baltimore is Canton with 85% average survivability, followed by Eastwood and Kresson. 23 of 23 neighborhoods analyzed exceed 70% two-year survival.
For the most accurate predictions, always check your specific address in StreetSpring's live platform.
Should You Consider Lower-Survivability Areas of Baltimore for a Pizza Restaurant?
Yes — neighborhood averages mask significant block-by-block variation. Even in neighborhoods ranked outside the top 10, individual storefronts with strong foot traffic, low direct competition, and favorable lease terms can outperform the area average. Market conditions are changing daily and it is best to use StreetSpring's most up-to-date data. Always check your specific address in StreetSpring's live platform for the most accurate prediction.
The Update Schedule for Baltimore Pizza Restaurants Data
StreetSpring recalculates survivability scores regularly using the latest competitive, demographic, and walkability data. Rankings are updated quarterly; the live tool always reflects the most current predictions for any address in Baltimore.
Should You Rent Your Baltimore Storefront to a Pizza Restaurant?
In Canton, StreetSpring forecasts a 82.8% – 86.3% average chance for a new Pizza Restaurant to survive more than 2 years, depending on the exact storefront. Check the current Survivability Score for any address instantly.
Landlord Survivability Data for Pizza Restaurant in Baltimore
From a risk-assessment perspective, a Pizza Restaurant tenant in Canton carries the lowest risk with average survivability of 82.8% – 86.3%. Eastwood presents moderate risk (81.8% – 85.4%), and Kresson carries comparatively higher risk at 80.5% – 84.0%. Our tool shows the survivability outlook for any business type at your exact address, updated weekly.
StreetSpring analyzes your specific address against comparable businesses to forecast success.
Related: How Landlord Representatives Can Reduce Vacancy & Increase Tenant Longevity
Top-Survivability Baltimore Neighborhoods for Pizza Restaurants
You can see the best neighborhoods in or around Baltimore to open any type of business in our article Neighborhood Survivability Rankings: Baltimore.
Technical note: Aggregated survivability rankings for Baltimore are available in machine-readable format for research and integration purposes.
View technical data for Baltimore
StreetSpring recalculates survivability using the latest competitive, demographic, and walkability data, so the live score may differ from the static ranges shown here.
Visual Data
Related Resources
Same business type in other cities:
Related:
- Business Survivability Rankings: Baltimore
- Neighborhood Survivability Rankings: Baltimore
- Business Survivability in Annapolis, Baltimore
- Business Survivability in Beechfield, Baltimore
Neighborhood-Specific Questions
Local-context questions, answered with neighborhood-specific numbers.
Where in the US do Pizza Restaurants survive best?
Per StreetSpring's 24-metro model, the top three US cities for Pizza Restaurants survivability are Portland, San Antonio, St. Louis. Baltimore ranks #9, averaging 87%.
Does Baltimore's population profile support Pizza Restaurants?
Baltimore's key demographics — ~$104K median household income, 39 median age — feed into the survivability model alongside competition, rent, and accessibility data. The model averages Pizza Restaurants at 87% across Baltimore.
How current is the Pizza Restaurants data for Baltimore?
Quarterly. The 2026 corpus shows Pizza Restaurants in Baltimore averaging 87%; quarterly refreshes integrate new competitor entries/exits, updated ACS data, and recalibrated lease rates.
What's the single biggest factor in survival for a Pizza Restaurant in Baltimore?
The address you sign for. Across Baltimore, Pizza Restaurants score 63-99% depending on location — a 36-point spread that captures competitive density, demographic fit, accessibility, and visibility at each storefront.