Survivability Rankings for Pet Store in Baltimore
StreetSpring's 2026 analysis ranks the best and worst neighborhoods in Baltimore to open a Pet Store, from Canton (86% survival) to Glen Burnie (76%).
By Bobby Koons | Last updated: April 26, 2026 | Weekly methodology review | Methodology
Quick Summary
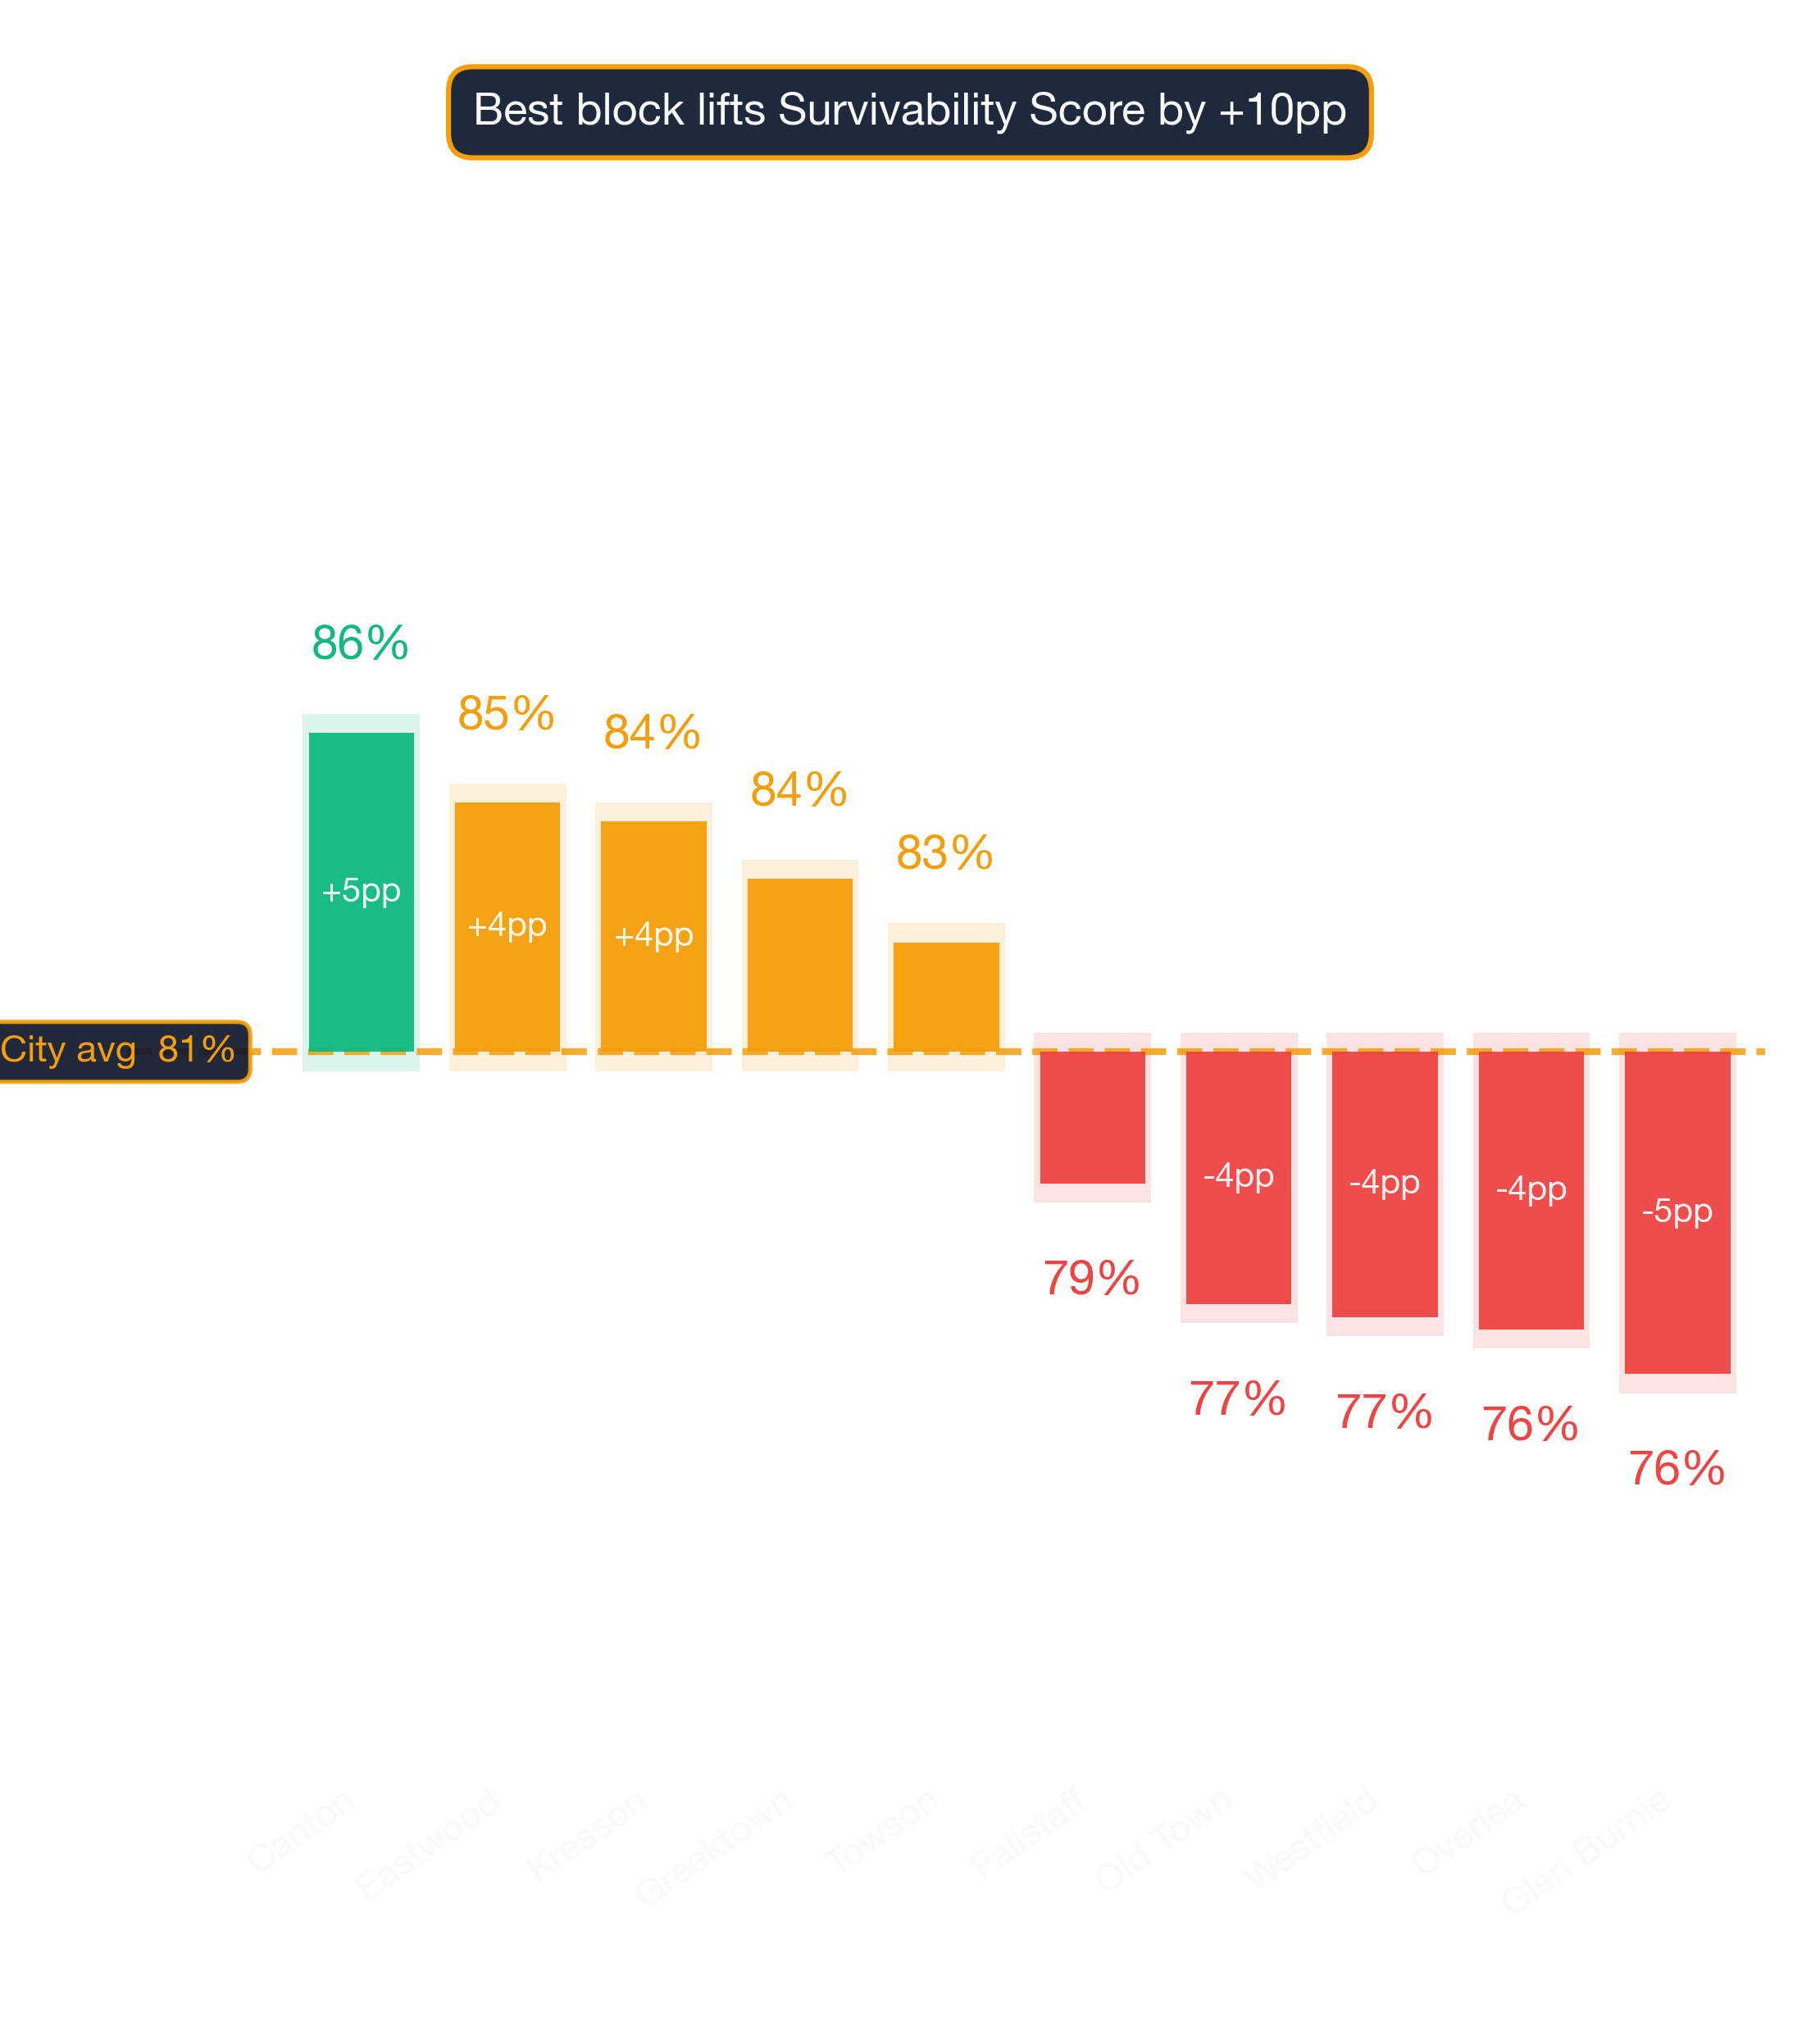
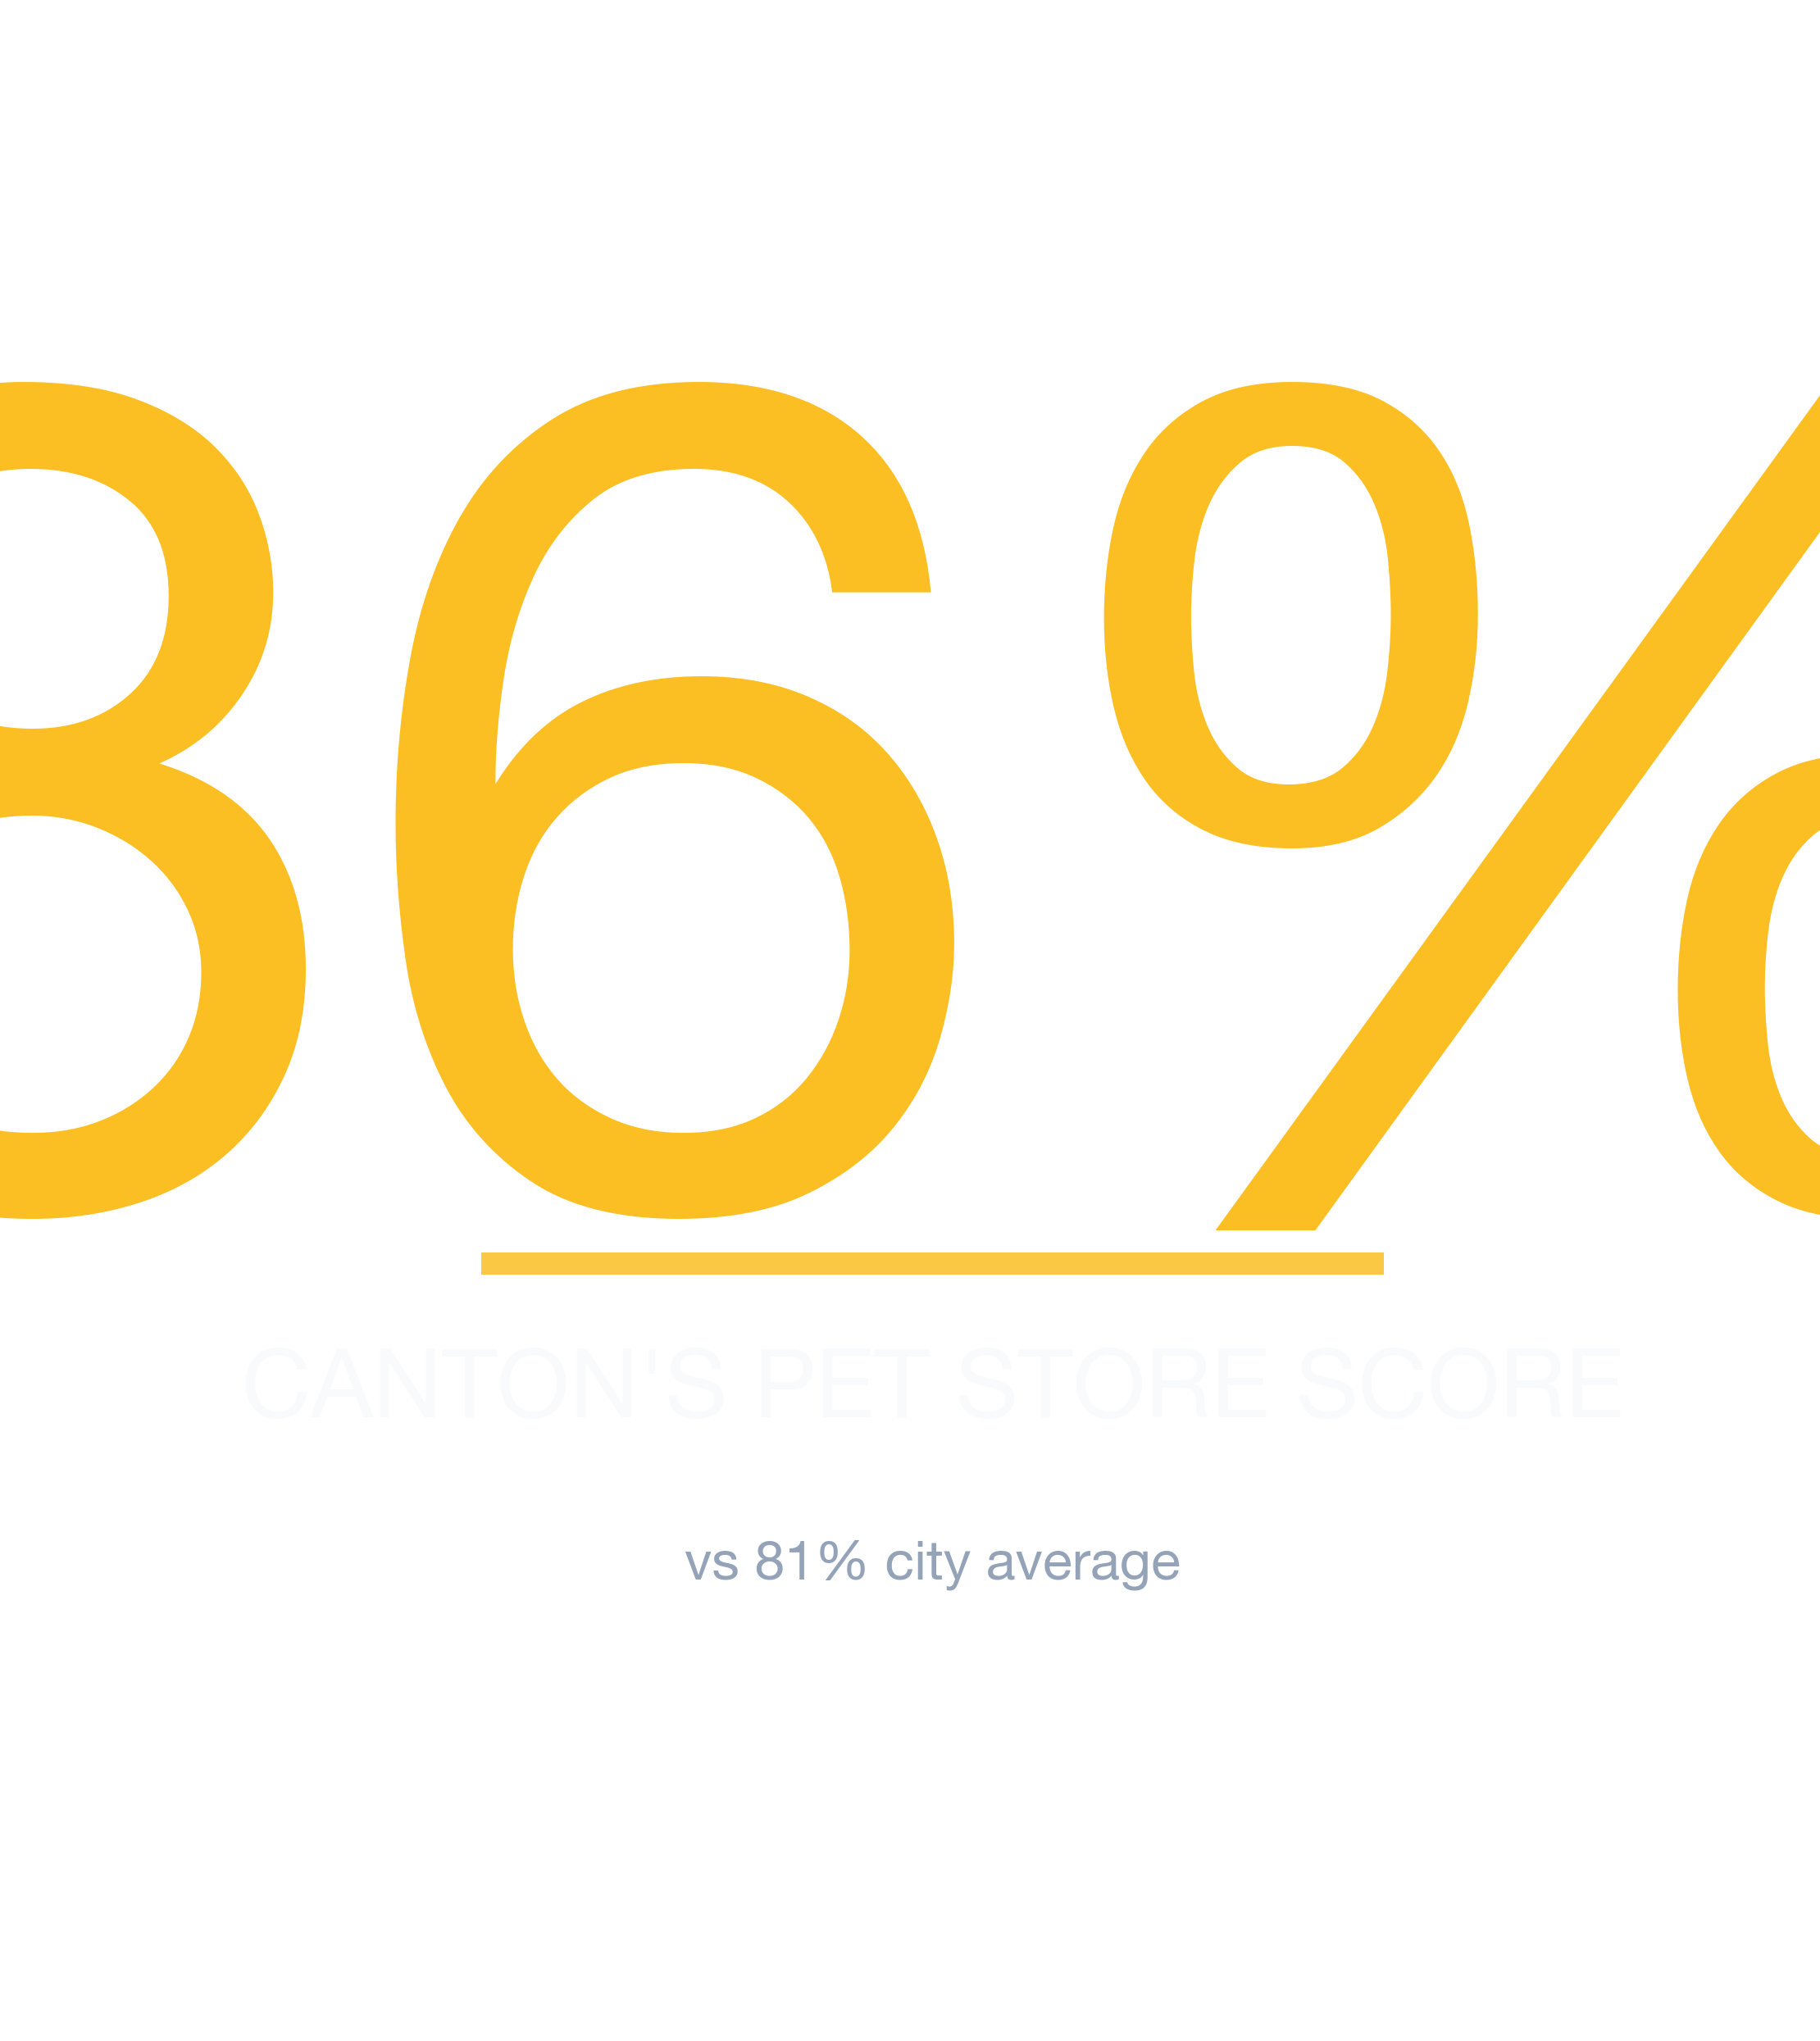
- #1 Neighborhood: Canton — 86% average survivability for Pet Store
- Neighborhoods at or above 70%: 23 of 23 analyzed
- City-wide average: 81% for Pet Stores
- Most challenging area: Glen Burnie at 76%
- Revenue advantage (top vs. avg location): ~6.3% more expected revenue in Canton
- Data freshness: 2026 data · Full methodology →
Table of Contents
- Summary
- 10 Best Neighborhoods
- Where Would a Pet Store Make the Most Money?
- What Should I Consider?
- Where Should I Start?
- FAQ: Best Neighborhoods
- FAQ: Can a Pet Store Succeed in Lower-Ranked Areas?
- FAQ: How Often Are Rankings Updated?
- FAQ: Is a Pet Store a Good Tenant?
- Landlord Survivability Data
- Best Neighborhoods for Any Business
Summary
Of all the neighborhoods in and around Baltimore, Canton ranks #1 for opening a Pet Store with 86% average chance of surviving more than 2 years, with the best locations offering 89% and the most challenging locations in Canton at 83%. The worst neighborhoods include Glen Burnie with 76% average chance. These averages are directional, not definitive; the best decision comes from analyzing your specific storefront.
Where in Baltimore Should You Open a Pet Store?
Canton ranks #1 of 23 neighborhoods analyzed in and around Baltimore for Pet Store survivability with a score of 86% as of 2026. The top 10 neighborhoods are:
Why these rankings reflect real survival outcomes
| Rank | Neighborhood | Best Locations | Average Locations | Challenging Locations |
|---|---|---|---|---|
| 1 | Canton | 86.0% – 90.0% | 83.6% – 87.7% | 82.0% – 86.0% |
| 2 | Eastwood | 94.0% – 97.0% | 82.5% – 86.5% | 74.0% – 78.0% |
| 3 | Kresson | 87.0% – 91.0% | 82.2% – 86.2% | 76.0% – 80.0% |
| 4 | Greektown | 90.0% – 94.0% | 81.3% – 85.3% | 75.0% – 79.0% |
| 5 | Beechfield | 91.0% – 95.0% | 80.3% – 84.3% | 73.0% – 77.0% |
| 6 | Towson | 94.0% – 97.0% | 80.3% – 84.3% | 70.0% – 74.0% |
| 7 | Otterbein | 80.0% – 84.0% | 79.8% – 83.8% | 79.0% – 83.0% |
| 8 | Riverside | 83.0% – 87.0% | 79.8% – 83.8% | 76.0% – 80.0% |
| 9 | Medford | 82.0% – 86.0% | 79.6% – 83.6% | 76.0% – 80.0% |
| 10 | Cedonia | 94.0% – 97.0% | 79.6% – 83.6% | 73.0% – 77.0% |
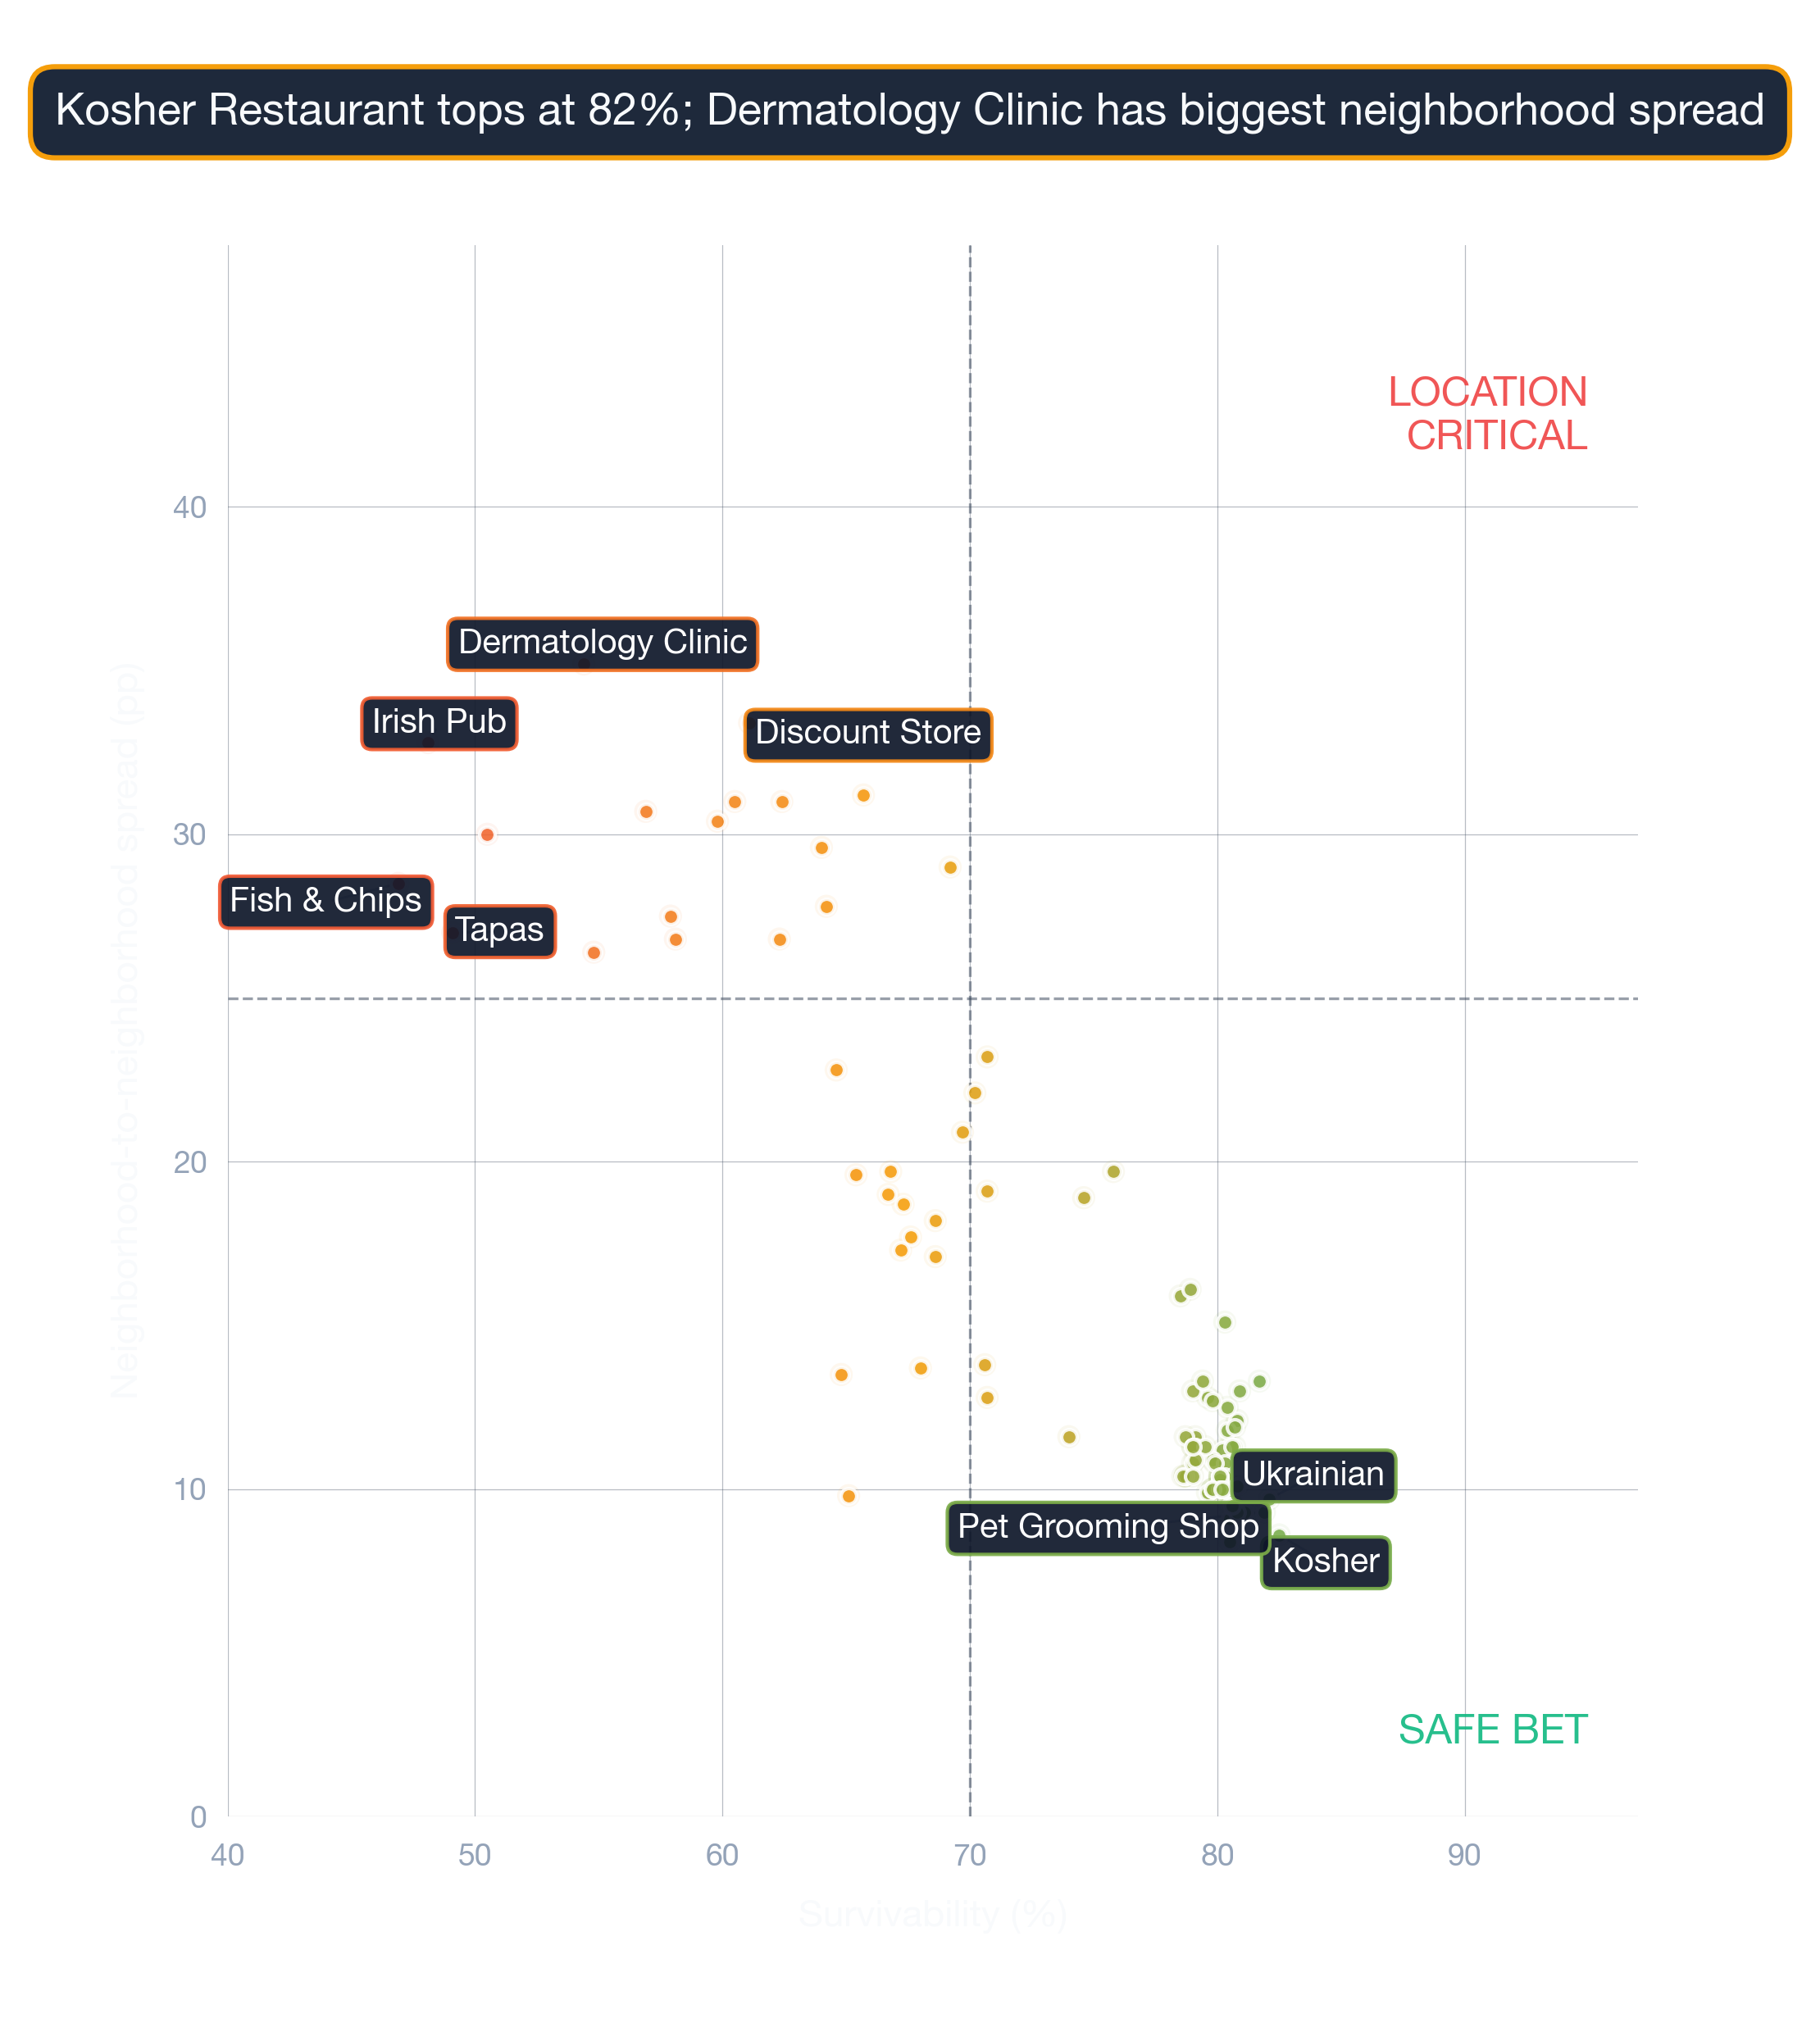
What the score spread tells you about risk
StreetSpring's Survivability Scores are updated regularly, so the most accurate prediction for your exact storefront is always available in the live tool. Neighborhood rankings are useful, but the exact odds for your location can only be seen by running a current survivability check in StreetSpring.
Survivability ranges reflect best and worst storefront conditions within each neighborhood. See our full methodology →
Try StreetSpring to see if this location is still the best and see if there are locations to rent in this area right now.
Where Pet Stores Earn the Most in Baltimore
In Canton, the best possible location offers the opportunity of making ~6.3% more than the average location in or around Baltimore.
On the other hand, in Glen Burnie, the worst possible location could result in making ~6.2% less than the average location in the city.
Your choice of location outweighs almost every other business decision combined. Opening a Pet Store in Baltimore requires careful location choice. Across 23 neighborhoods analyzed, the overall average survival chance for a new Pet Store is 81% for lasting more than 2 years — due to a combination of many factors across competition, consumer spending, and location dynamics. The same location can be excellent for one business type and poor for another.
What Should I Consider When Opening a Pet Store in or Around Baltimore?
Site selection sits upstream of every other decision in this business. A high Survivability Score doesn't guarantee success, but a low one is hard to overcome with execution alone. The most important factor for a business's success is the Revenue Capture Score for the business at the location it selects. StreetSpring computes this by projecting the business's market share, which is based on the quality and quantity of primary, secondary, and tertiary competitors. Our platform incorporates data from thousands of neighborhoods nationwide. Moderate competition often indicates a healthy market with proven consumer demand. Our forecasting system combines proprietary data with machine learning models unavailable anywhere else.
| Consideration | Common pitfall | What to verify before signing |
|---|---|---|
| Build-out budget | Underestimating mechanical, electrical, and plumbing — the "hidden" 30-50% of build-out cost. | Get 3 quotes from licensed contractors and pad budget by +20% for surprises. Confirm landlord TI allowance in writing. |
| Permits & licensing | Assuming a 30-day permit timeline, hitting 90+ days, paying rent on a non-operating storefront. | Call the local zoning office before signing. Confirm your use is already permitted; if not, factor a 2-3 month variance timeline. |
| CAM + hidden costs | Stated rent looks great, then CAM fees, signage charges, and after-hours utilities add 15-30%. | Get the full operating expense breakdown for the past 2 years. Ask which costs are landlord-capped vs. uncapped. |
This can be summarized as:
Revenue Capture Score = Projected Market Share × Forecasted Spend on Specific Business
Related: Survivability Score: How We Calculate It & Why It Matters
StreetSpring recalculates survivability using the latest competitive, demographic, and walkability data. New competitor openings and closures happen weekly — the live tool ensures you see the latest picture.
Where in or Around Baltimore Should I Start a Pet Store?
Our models highlight the following neighborhoods as top performers: Canton, Eastwood, and Kresson, while the most challenging neighborhoods would be Glen Burnie, Overlea, and Westfield. Neighborhood averages mask significant block-by-block variation — always check your specific address. The live platform incorporates the most recent foot traffic, competitor, and spending data for your exact address.
Related Articles:
Which Baltimore Neighborhoods Are Strongest for Pet Stores?
Based on StreetSpring's 2026 analysis, the top neighborhood for a Pet Store in Baltimore is Canton with 86% average survivability, followed by Eastwood and Kresson. 23 of 23 neighborhoods analyzed exceed 70% two-year survival.
New competitor openings and closures happen weekly — the live tool ensures you see the latest picture.
When Lower-Scoring Neighborhoods Can Still Work for Pet Stores
Yes — neighborhood averages mask significant block-by-block variation. Even in neighborhoods ranked outside the top 10, individual storefronts with strong foot traffic, low direct competition, and favorable lease terms can outperform the area average. These averages are directional, not definitive; the best decision comes from analyzing your specific storefront. Always check your specific address in StreetSpring's live platform for the most accurate prediction.
How Often Are Pet Store Rankings in Baltimore Updated?
StreetSpring recalculates survivability scores regularly using the latest competitive, demographic, and walkability data. Rankings are updated quarterly; the live tool always reflects the most current predictions for any address in Baltimore.
Should Baltimore Landlords Lease to Pet Stores?
In Canton, StreetSpring forecasts a 83.6% – 87.7% average chance for a new Pet Store to survive more than 2 years, depending on the exact storefront. Check the current Survivability Score for any address instantly.
Landlord Survivability Data for Pet Store in Baltimore
The data tells a clear story for Pet Store tenants across Baltimore's top neighborhoods. Canton leads with 83.6% – 87.7% average survivability, with best-case storefronts reaching 86.0% – 90.0%. Eastwood averages 82.5% – 86.5%, and Kresson comes in at 82.2% – 86.2%. Check the current Survivability Score for any address instantly.
StreetSpring generates location-specific predictions tailored to your exact site.
Related: How Landlord Representatives Can Reduce Vacancy & Increase Tenant Longevity
Top-Survivability Baltimore Neighborhoods for Pet Stores
You can see the best neighborhoods in or around Baltimore to open any type of business in our article Neighborhood Survivability Rankings: Baltimore.
Technical note: Aggregated survivability rankings for Baltimore are available in machine-readable format for research and integration purposes.
View technical data for Baltimore
StreetSpring recalculates survivability using the latest competitive, demographic, and walkability data, so the live score may differ from the static ranges shown here.
Visual Data
Related Resources
Same business type in other cities:
Related:
- Business Survivability Rankings: Baltimore
- Neighborhood Survivability Rankings: Baltimore
- Business Survivability in Annapolis, Baltimore
- Business Survivability in Beechfield, Baltimore
Local Context FAQ
Beyond the general FAQ — data-anchored answers for this specific location.
What separates a Baltimore Pet Store that survives from one that doesn't?
The address you sign for. Across Baltimore, Pet Stores score 44-91% depending on location — a 47-point spread that captures competitive density, demographic fit, accessibility, and visibility at each storefront.
What factors drive the Baltimore Pet Stores score?
The Baltimore survivability score for Pet Stores (73% average) combines ~100 location factors: competitive density, demographic fit, accessibility, visibility, lease economics, and historical business outcomes. The score is calibrated against 500K+ historical business outcomes and refreshed quarterly.
How current is the Pet Stores data for Baltimore?
StreetSpring refreshes the Baltimore Pet Stores corpus quarterly. The current 2026 release shows a 73% average across Baltimore; the next refresh will integrate fresh competitor and ACS data.
What's the coverage of StreetSpring's Baltimore model for Pet Stores?
For Pet Stores, the Baltimore model produces survivability scores from 44% (low-end neighborhoods) to 91% (top neighborhoods), averaging 73%. Each storefront address gets a precise score that reflects block-level variation.