Survivability Rankings for Persian Restaurant in Baltimore
StreetSpring's 2026 analysis ranks the best and worst neighborhoods in Baltimore to open a Persian Restaurant, from Downtown (68% survival) to Overlea (...
By Bobby Koons | Last updated: April 25, 2026 | Weekly methodology review | Methodology
Quick Summary
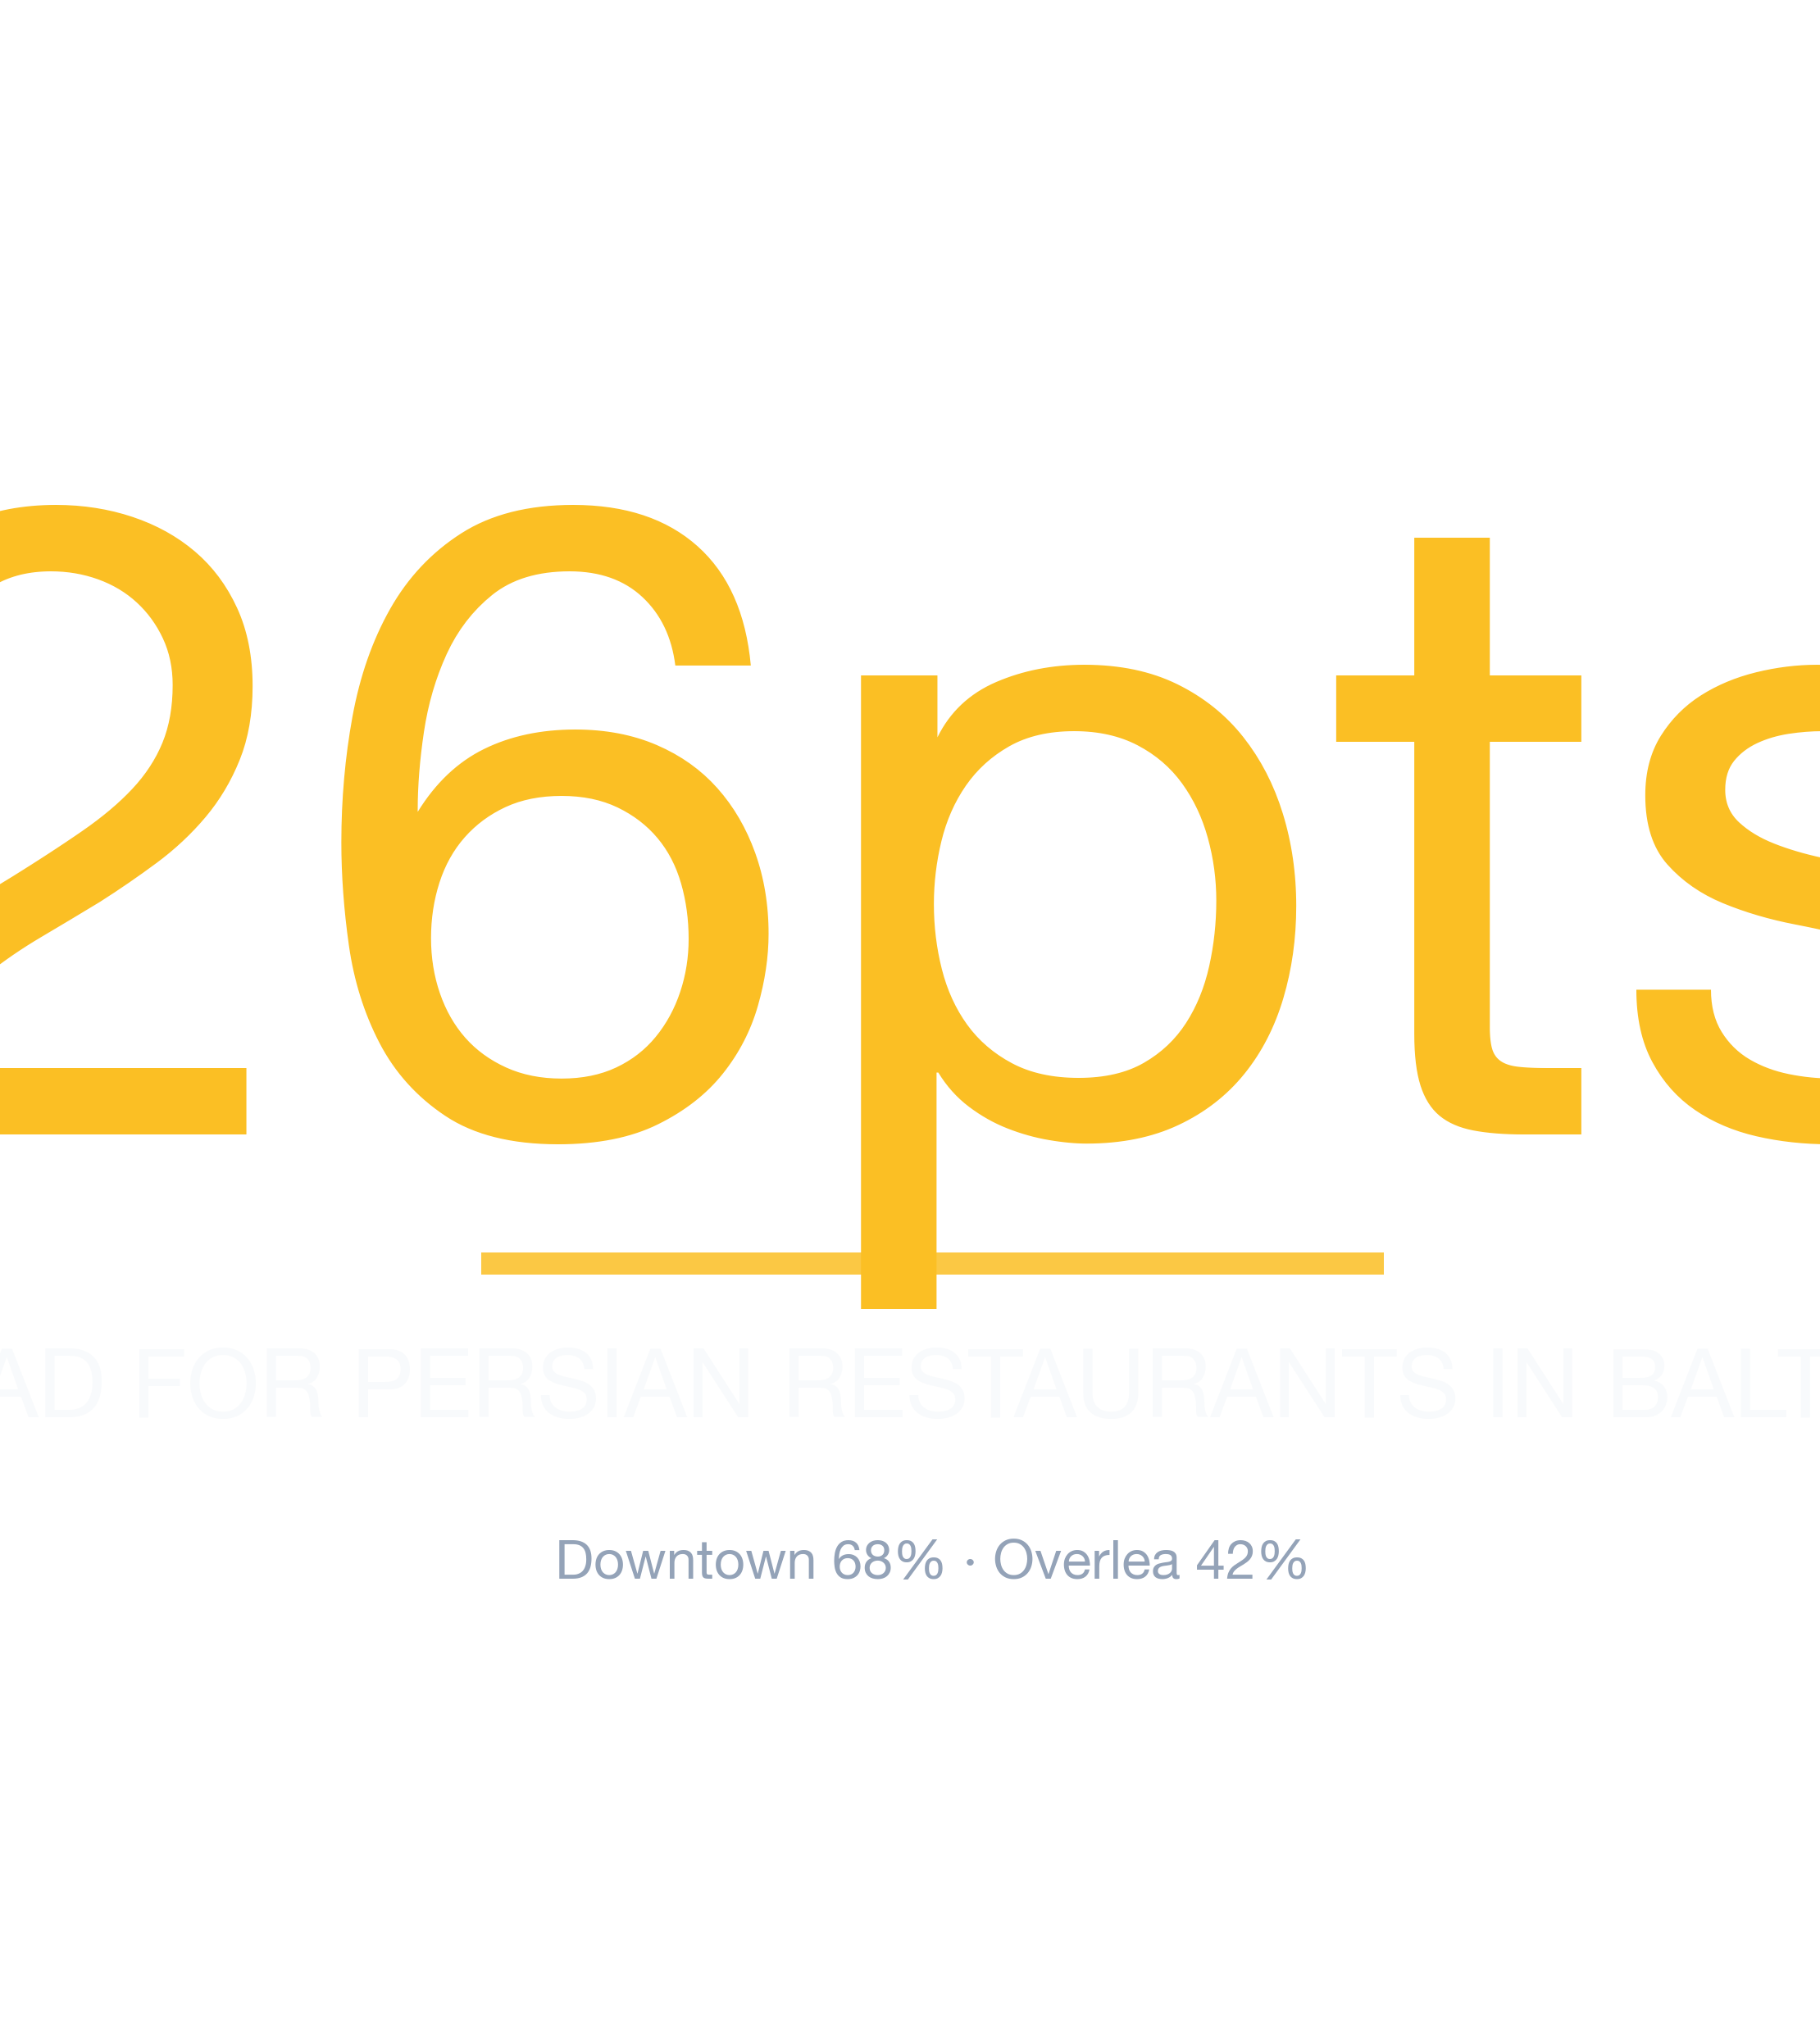
- #1 Neighborhood: Downtown — 68% average survivability for Persian Restaurant
- Neighborhoods at or above 70%: 0 of 23 analyzed
- City-wide average: 55% for Persian Restaurants
- Most challenging area: Overlea at 42%
- Revenue advantage (top vs. avg location): ~23.9% more expected revenue in Downtown
- Data freshness: 2026 data · Full methodology →
Table of Contents
- Summary
- 10 Best Neighborhoods
- Where Would a Persian Restaurant Make the Most Money?
- What Should I Consider?
- Where Should I Start?
- FAQ: Best Neighborhoods
- FAQ: Can a Persian Restaurant Succeed in Lower-Ranked Areas?
- FAQ: How Often Are Rankings Updated?
- FAQ: Is a Persian Restaurant a Good Tenant?
- Landlord Survivability Data
- Best Neighborhoods for Any Business
Summary
StreetSpring's 2026 analysis shows the best neighborhood in and around Baltimore to open a Persian Restaurant is Downtown with 68% average chance of surviving more than 2 years, with the best locations offering 69% and the most challenging locations in Downtown at 67%. The worst neighborhoods include Overlea with 42% average chance. These rankings are based on the latest available data; check StreetSpring for real-time updates.
Where in Baltimore Should You Open a Persian Restaurant?
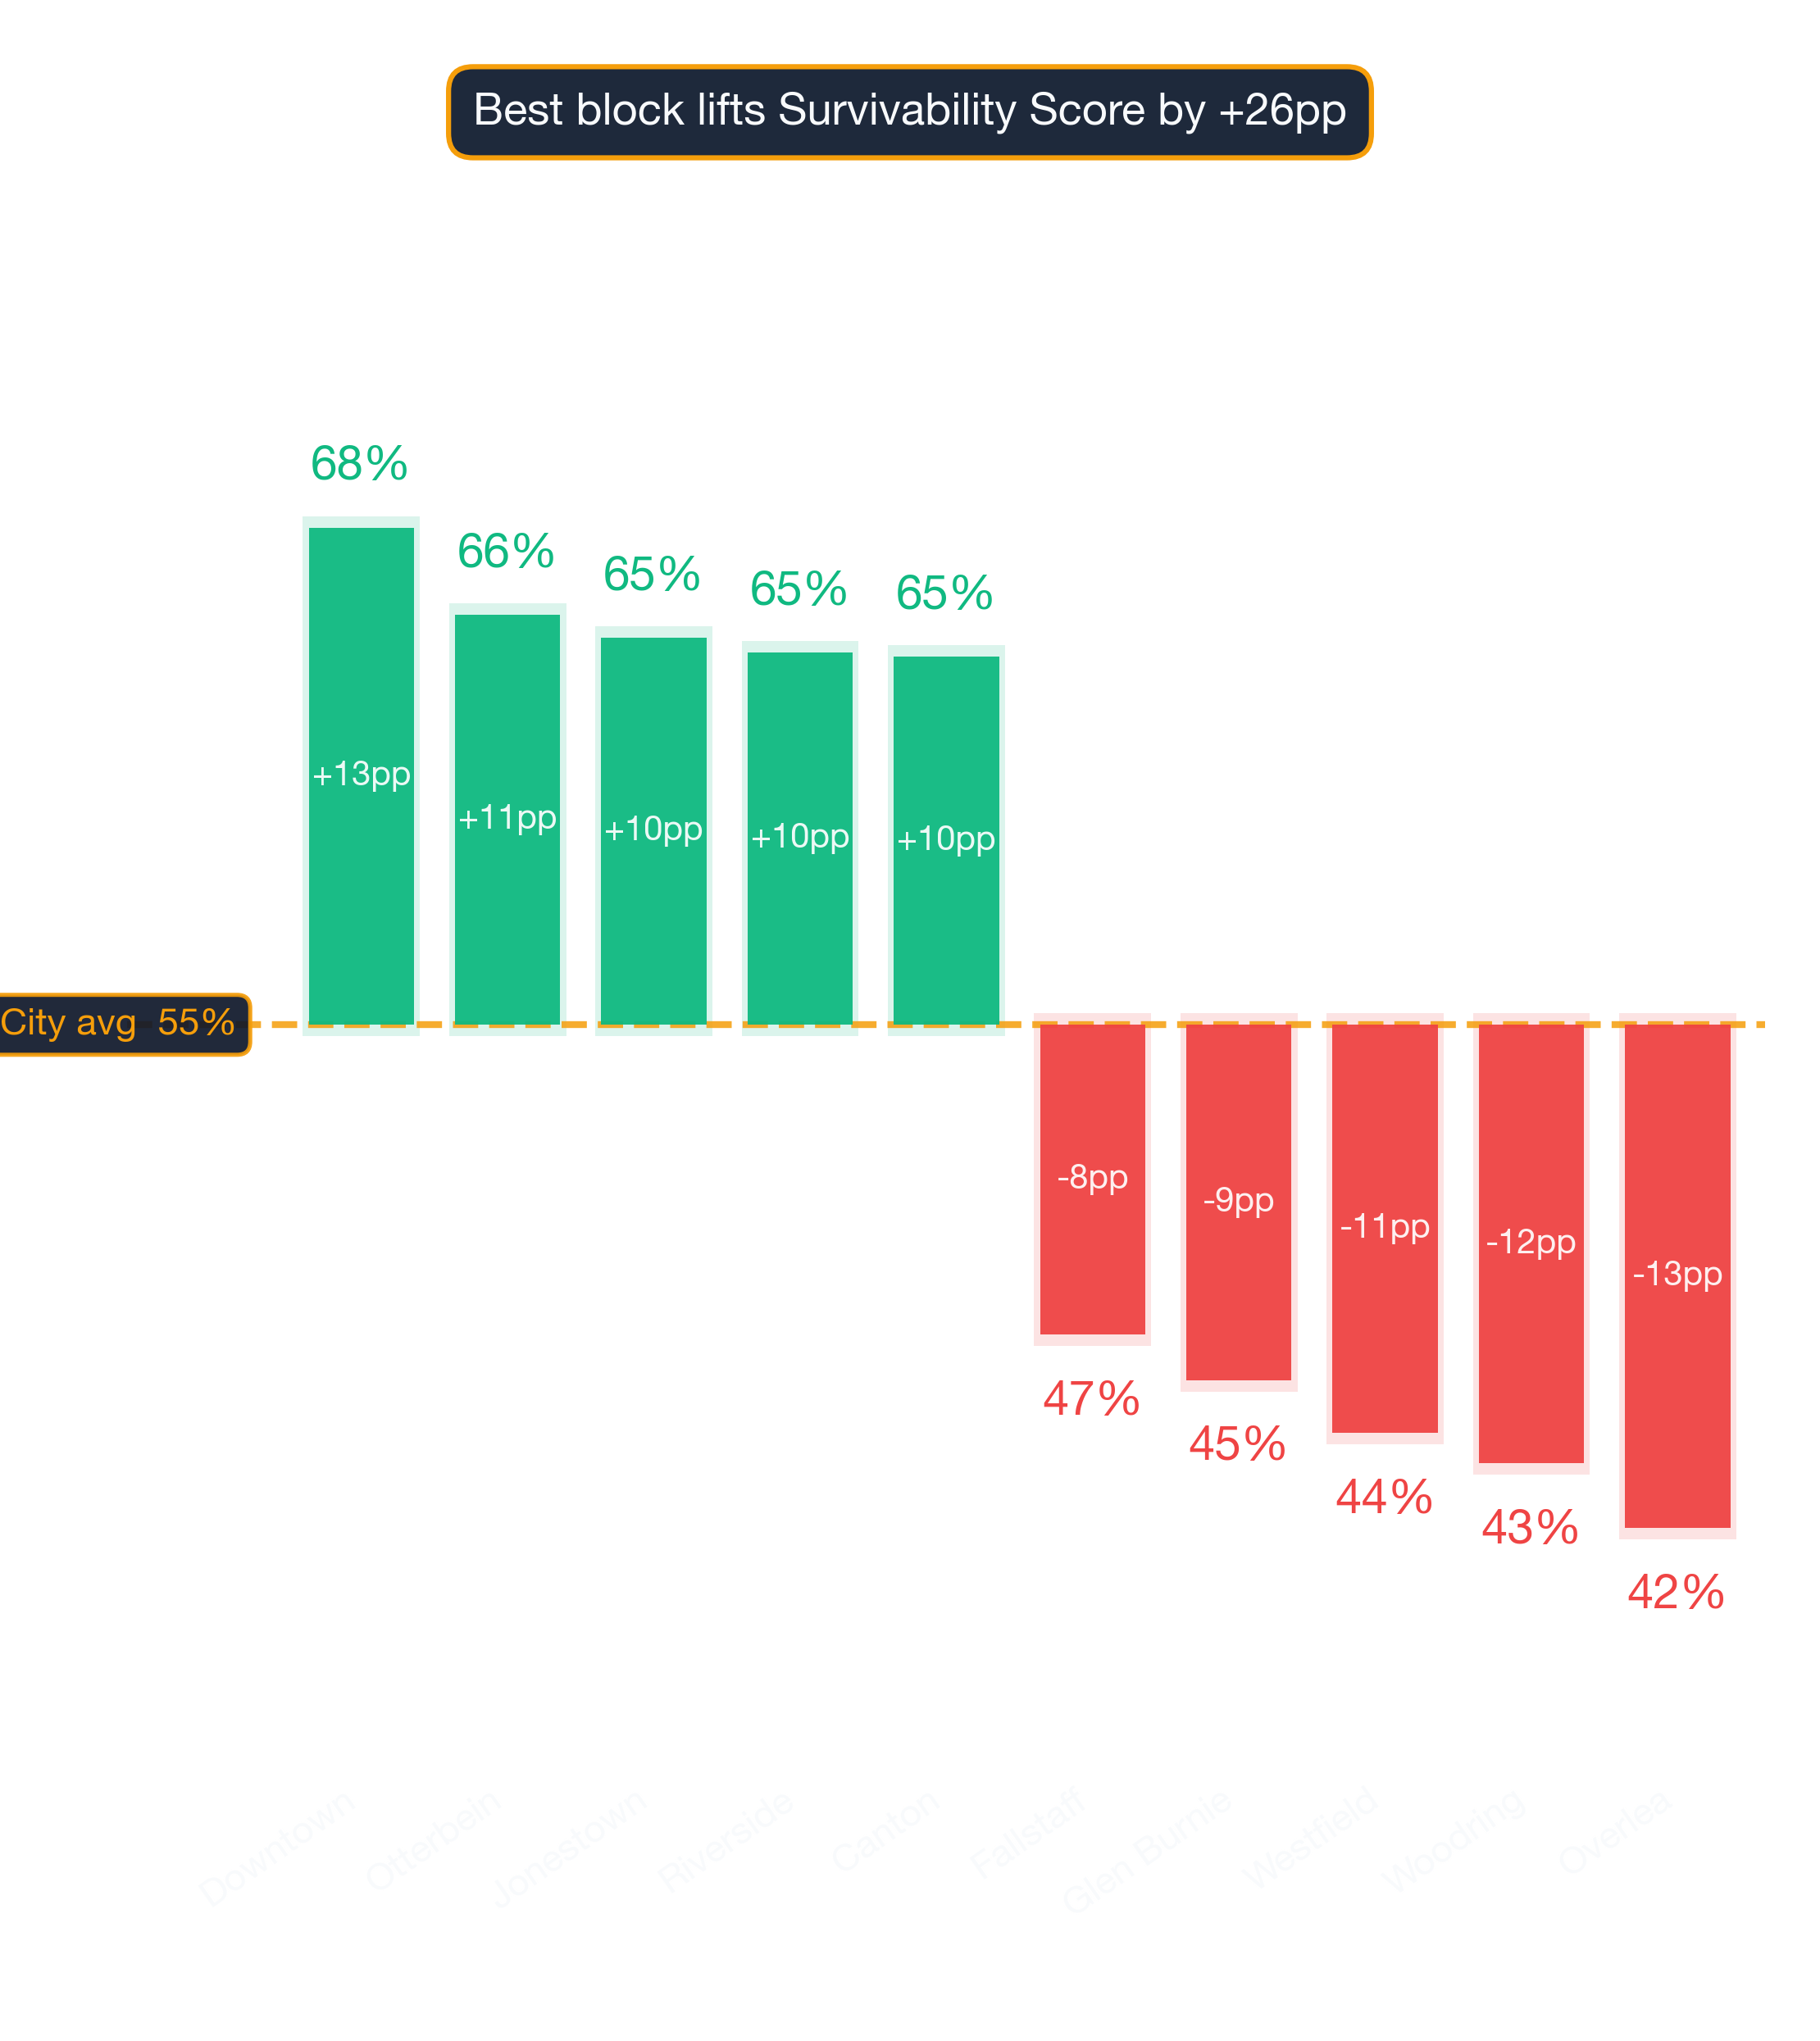
Downtown ranks #1 of 23 neighborhoods analyzed in and around Baltimore for Persian Restaurant survivability with a score of 68% as of 2026. The top 10 neighborhoods are:
Reading the gap between #1 and #10
| Rank | Neighborhood | Best Locations | Average Locations | Challenging Locations |
|---|---|---|---|---|
| 1 | Downtown | 66.0% – 70.0% | 65.7% – 69.3% | 66.0% – 70.0% |
| 2 | Otterbein | 65.0% – 69.0% | 63.4% – 67.0% | 63.0% – 67.0% |
| 3 | Jonestown | 62.0% – 66.0% | 62.8% – 66.4% | 64.0% – 68.0% |
| 4 | Riverside | 65.0% – 69.0% | 62.4% – 66.0% | 56.0% – 60.0% |
| 5 | Canton | 66.0% – 70.0% | 62.2% – 65.9% | 59.0% – 63.0% |
| 6 | Greektown | 63.0% – 67.0% | 60.2% – 63.8% | 57.0% – 61.0% |
| 7 | Medford | 62.0% – 66.0% | 59.0% – 62.6% | 54.0% – 58.0% |
| 8 | Old Town | 60.0% – 64.0% | 58.3% – 61.9% | 56.0% – 60.0% |
| 9 | Kresson | 62.0% – 66.0% | 57.7% – 61.3% | 55.0% – 59.0% |
| 10 | Brooklyn | 59.0% – 63.0% | 54.6% – 58.2% | 53.0% – 57.0% |
Notable runners-up worth a second look
These rankings are based on the latest available data; check StreetSpring for real-time updates. Because local conditions evolve weekly, the live survivability tool offers a more current snapshot than any published ranking.
Survivability ranges reflect best and worst storefront conditions within each neighborhood. See our full methodology →
Try StreetSpring to see if this location is still the best and see if there are locations to rent in this area right now.
Where in or Around Baltimore Would a Persian Restaurant Make the Most Money?
In Downtown, the best possible location offers the opportunity of making ~23.9% more than the average location in or around Baltimore.
On the other hand, in Overlea, the worst possible location could result in making ~24.2% less than the average location in the city.
Location is the biggest factor in a business's future success. Opening a Persian Restaurant in Baltimore requires careful location choice. Across 23 neighborhoods analyzed, the overall average survival chance for a new Persian Restaurant is 55% for lasting more than 2 years — due to a combination of many factors across competition, consumer spending, and location dynamics. Consumer spending patterns differ dramatically across business types and micro-locations.
The Most Important Factors for a Persian Restaurant in Baltimore
Among all the variables you control, location quality has the biggest downstream impact. A strong Survivability Score is the foundation everything else builds on. Revenue Capture Score captures the interplay between market share and consumer spending — the two biggest drivers of success. StreetSpring computes this by projecting the business's market share, which is based on the quality and quantity of primary, secondary, and tertiary competitors. Our platform incorporates data from thousands of neighborhoods nationwide. Neighborhoods with a mix of similar businesses frequently outperform isolated locations. Our forecasting system combines proprietary data with machine learning models unavailable anywhere else.
| Consideration | Common pitfall | What to verify before signing |
|---|---|---|
| CAM + hidden costs | Stated rent looks great, then CAM fees, signage charges, and after-hours utilities add 15-30%. | Get the full operating expense breakdown for the past 2 years. Ask which costs are landlord-capped vs. uncapped. |
| Lease term | Locking into 7-10 years without break clauses, then needing to relocate after year 2. | Negotiate a relocation or termination clause. Confirm assignment + sublease rights are in writing. |
| Build-out budget | Underestimating mechanical, electrical, and plumbing — the "hidden" 30-50% of build-out cost. | Get 3 quotes from licensed contractors and pad budget by +20% for surprises. Confirm landlord TI allowance in writing. |
This can be summarized as:
Revenue Capture Score = Projected Market Share × Forecasted Spend on Specific Business
Related: Survivability Score: How We Calculate It & Why It Matters
StreetSpring recalculates survivability using the latest competitive, demographic, and walkability data. Static rankings provide a useful baseline, but the live tool captures changes that have occurred since publication.
Where to Launch a Persian Restaurant in or Around Baltimore
For this business type, the highest-ranked neighborhoods are Downtown, Otterbein, and Jonestown, while the most challenging neighborhoods would be Overlea, Woodring, and Westfield. Remember that a neighborhood average smooths over wide variation — your exact block could significantly outperform. StreetSpring refreshes survivability data continuously — check the tool for the most current score at any address.
Related Articles:
Which Baltimore Neighborhoods Are Strongest for Persian Restaurants?
Based on StreetSpring's 2026 analysis, the top neighborhood for a Persian Restaurant in Baltimore is Downtown with 68% average survivability, followed by Otterbein and Jonestown. 0 of 23 neighborhoods analyzed exceed 70% two-year survival.
Because local conditions evolve weekly, the live survivability tool offers a more current snapshot than any published ranking.
Are Bottom-Tier Baltimore Neighborhoods a No-Go for Persian Restaurants?
Yes — neighborhood averages mask significant block-by-block variation. Even in neighborhoods ranked outside the top 10, individual storefronts with strong foot traffic, low direct competition, and favorable lease terms can outperform the area average. These averages are directional, not definitive; the best decision comes from analyzing your specific storefront. Always check your specific address in StreetSpring's live platform for the most accurate prediction.
The Update Schedule for Baltimore Persian Restaurants Data
StreetSpring recalculates survivability scores regularly using the latest competitive, demographic, and walkability data. Rankings are updated quarterly; the live tool always reflects the most current predictions for any address in Baltimore.
Is a Persian Restaurant a Good Tenant for Baltimore Landlords?
In Downtown, StreetSpring forecasts a 65.7% – 69.3% average chance for a new Persian Restaurant to survive more than 2 years, depending on the exact storefront. Check the current Survivability Score for any address instantly.
Landlord Survivability Data for Persian Restaurant in Baltimore
Reducing vacancy starts with choosing tenants whose business type matches the neighborhood's strengths. For Persian Restaurant tenants, Downtown provides the best survivability conditions (65.7% – 69.3%). Otterbein and Jonestown also show viable averages at 63.4% – 67.0% and 62.8% – 66.4% respectively. Get a live Survivability Score for your specific storefront at no cost.
StreetSpring analyzes your specific address against comparable businesses to forecast success.
Related: How Landlord Representatives Can Reduce Vacancy & Increase Tenant Longevity
Top-Survivability Baltimore Neighborhoods for Persian Restaurants
You can see the best neighborhoods in or around Baltimore to open any type of business in our article Neighborhood Survivability Rankings: Baltimore.
Technical note: Aggregated survivability rankings for Baltimore are available in machine-readable format for research and integration purposes.
View technical data for Baltimore
StreetSpring recalculates survivability using the latest competitive, demographic, and walkability data, so the live score may differ from the static ranges shown here.
Visual Data
Related Resources
Same business type in other cities:
Related:
- Business Survivability Rankings: Baltimore
- Neighborhood Survivability Rankings: Baltimore
- Business Survivability in Annapolis, Baltimore
- Business Survivability in Beechfield, Baltimore
More Questions About This Location
Further questions, with answers anchored on this neighborhood's actual data.
How many Baltimore neighborhoods has StreetSpring scored for Persian Restaurants?
Persian Restaurants in Baltimore score between 63% and 98% across neighborhoods, with an average of 87%. Block-level scoring captures variation that neighborhood-wide averages can mask.
What's the broader economic environment in Baltimore?
Broader metro: ~95% employment rate, ~$104K median income per ACS. Persian Restaurants survivability in Baltimore averages 87%, with the model layering business-specific and site-specific factors on top.
What goes into a StreetSpring survivability score for Persian Restaurants?
Each Persian Restaurants survivability score in Baltimore (averaging 87%) reflects ~100 factors per address: competitor counts at multiple radii, demographics, accessibility, rent, and historical outcomes. The model is recalibrated quarterly against 500K+ business outcomes nationally.