Survivability Rankings for Pakistani Restaurant in Baltimore
StreetSpring's 2026 analysis ranks the best and worst neighborhoods in Baltimore to open a Pakistani Restaurant, from Canton (85% survival) to Old Town ...
By Bobby Koons | Last updated: May 11, 2026 | Weekly methodology review | Methodology
Quick Summary
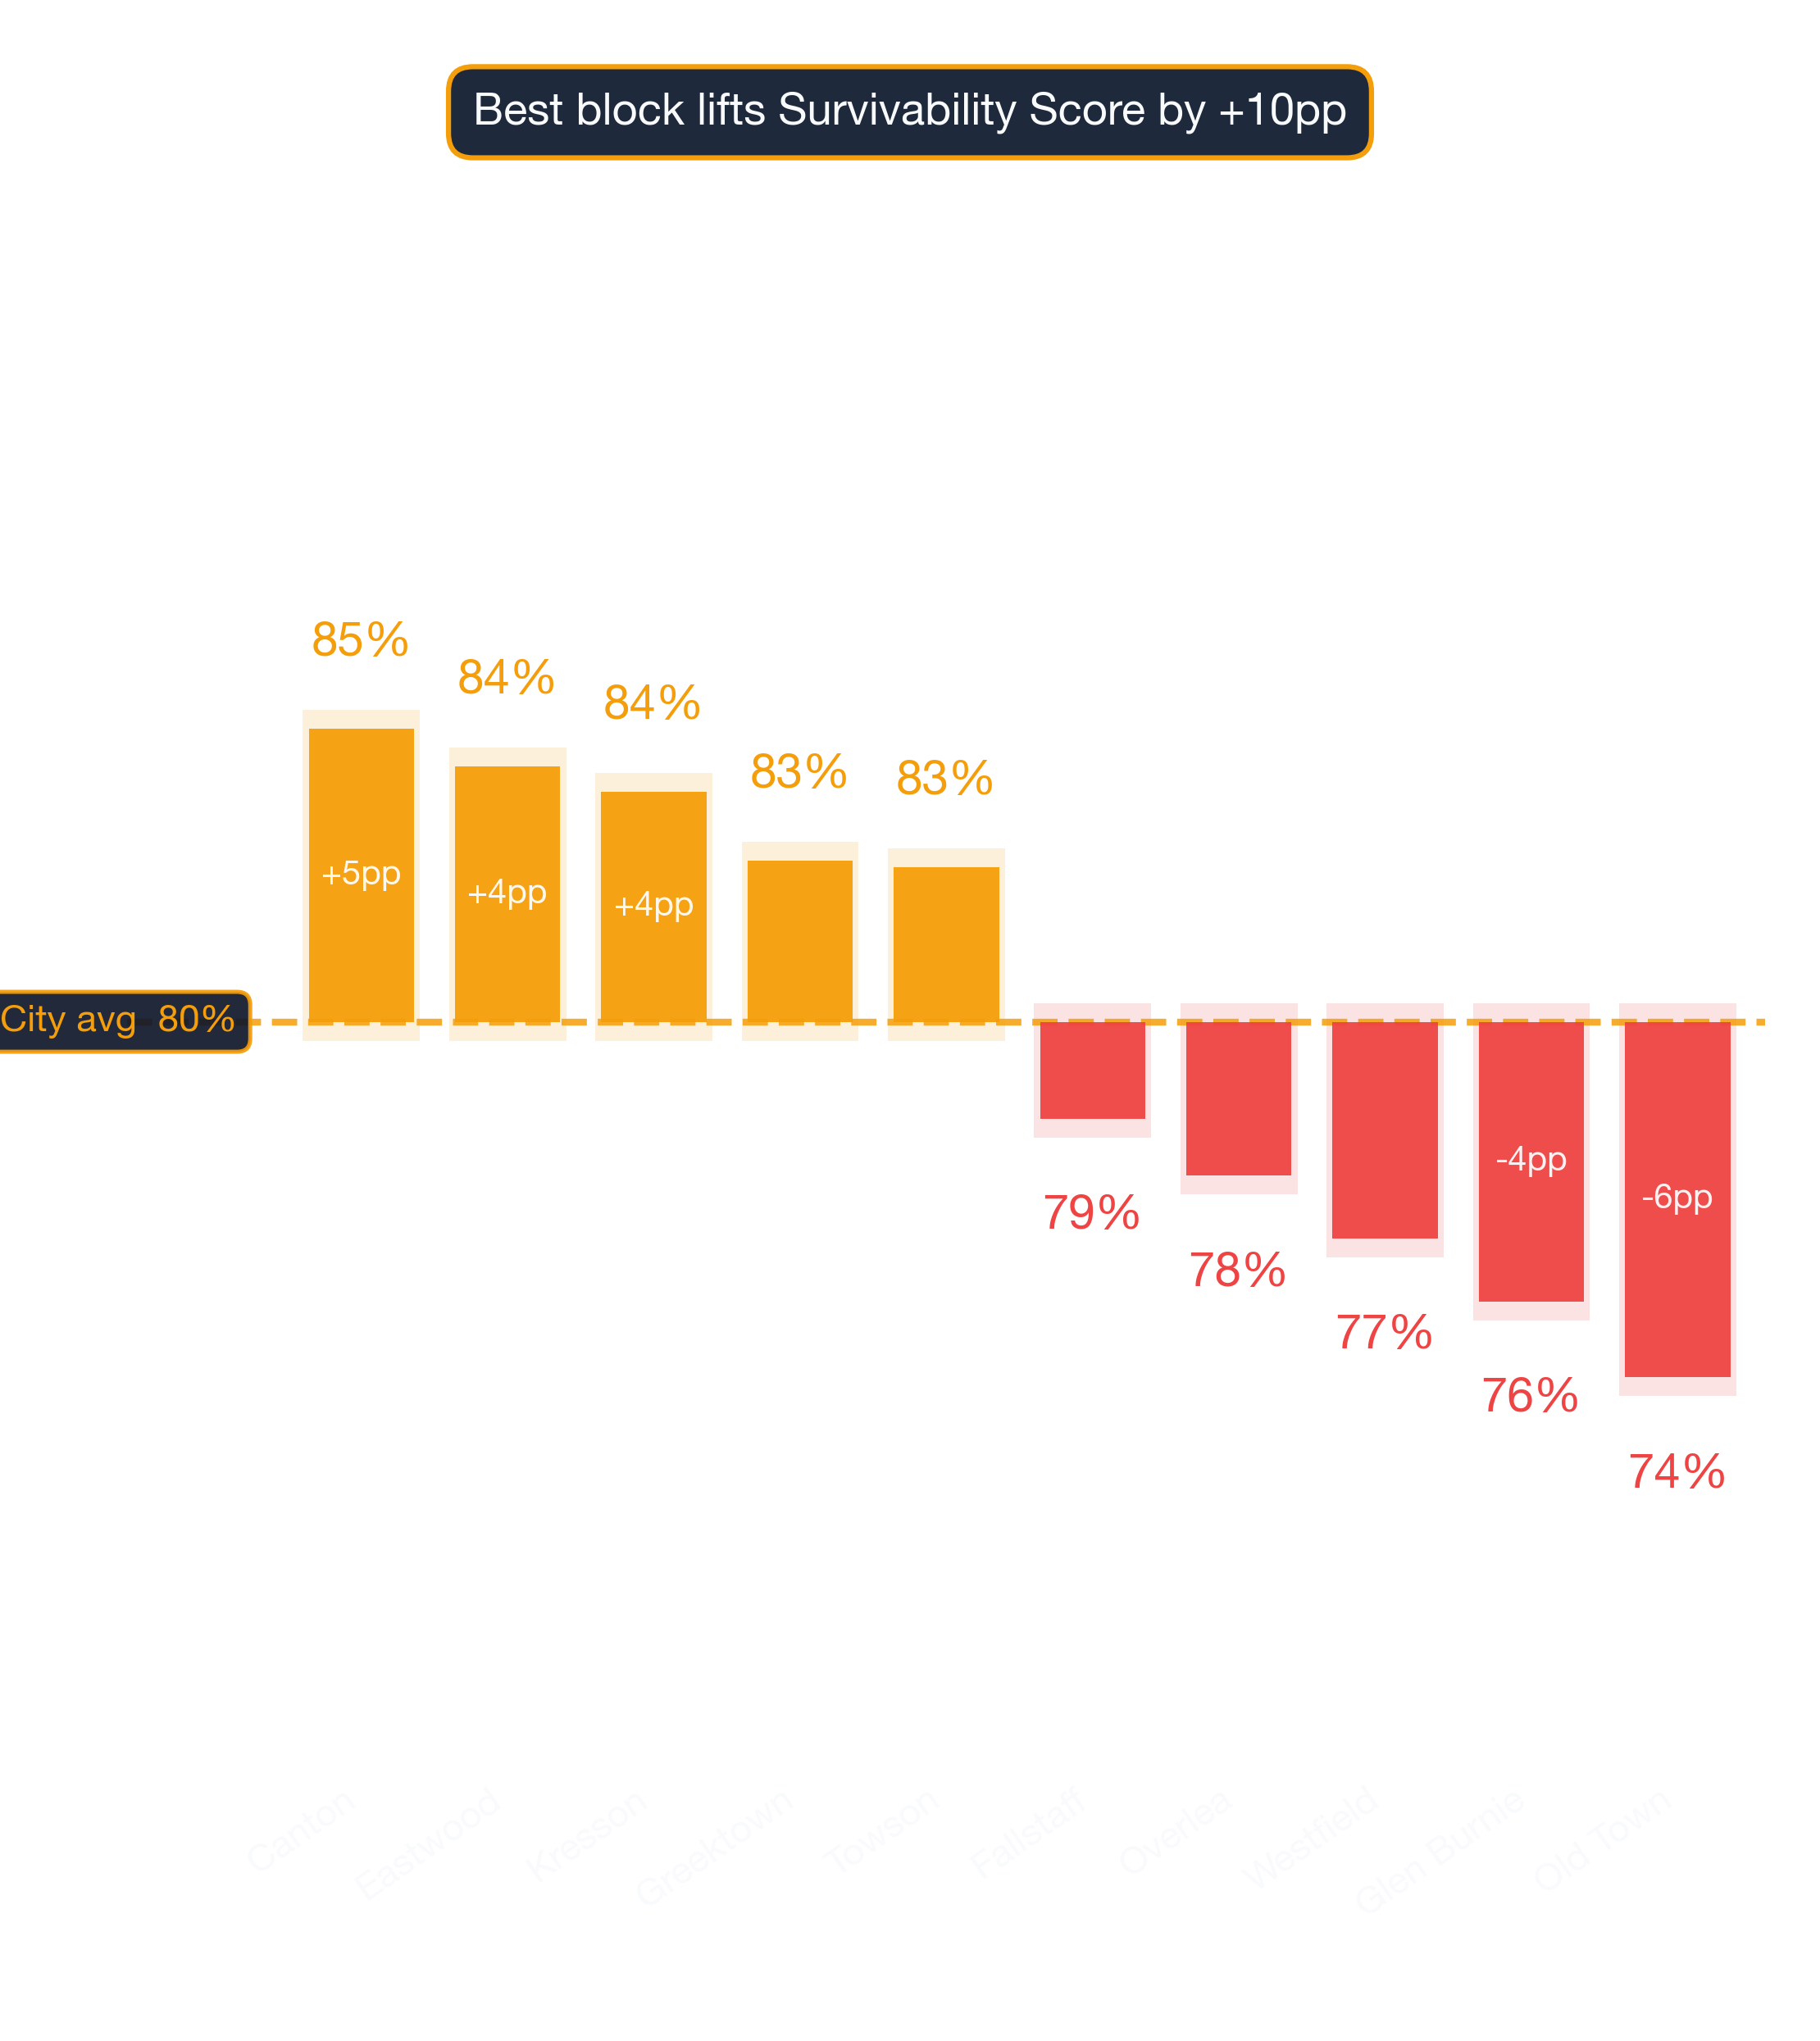
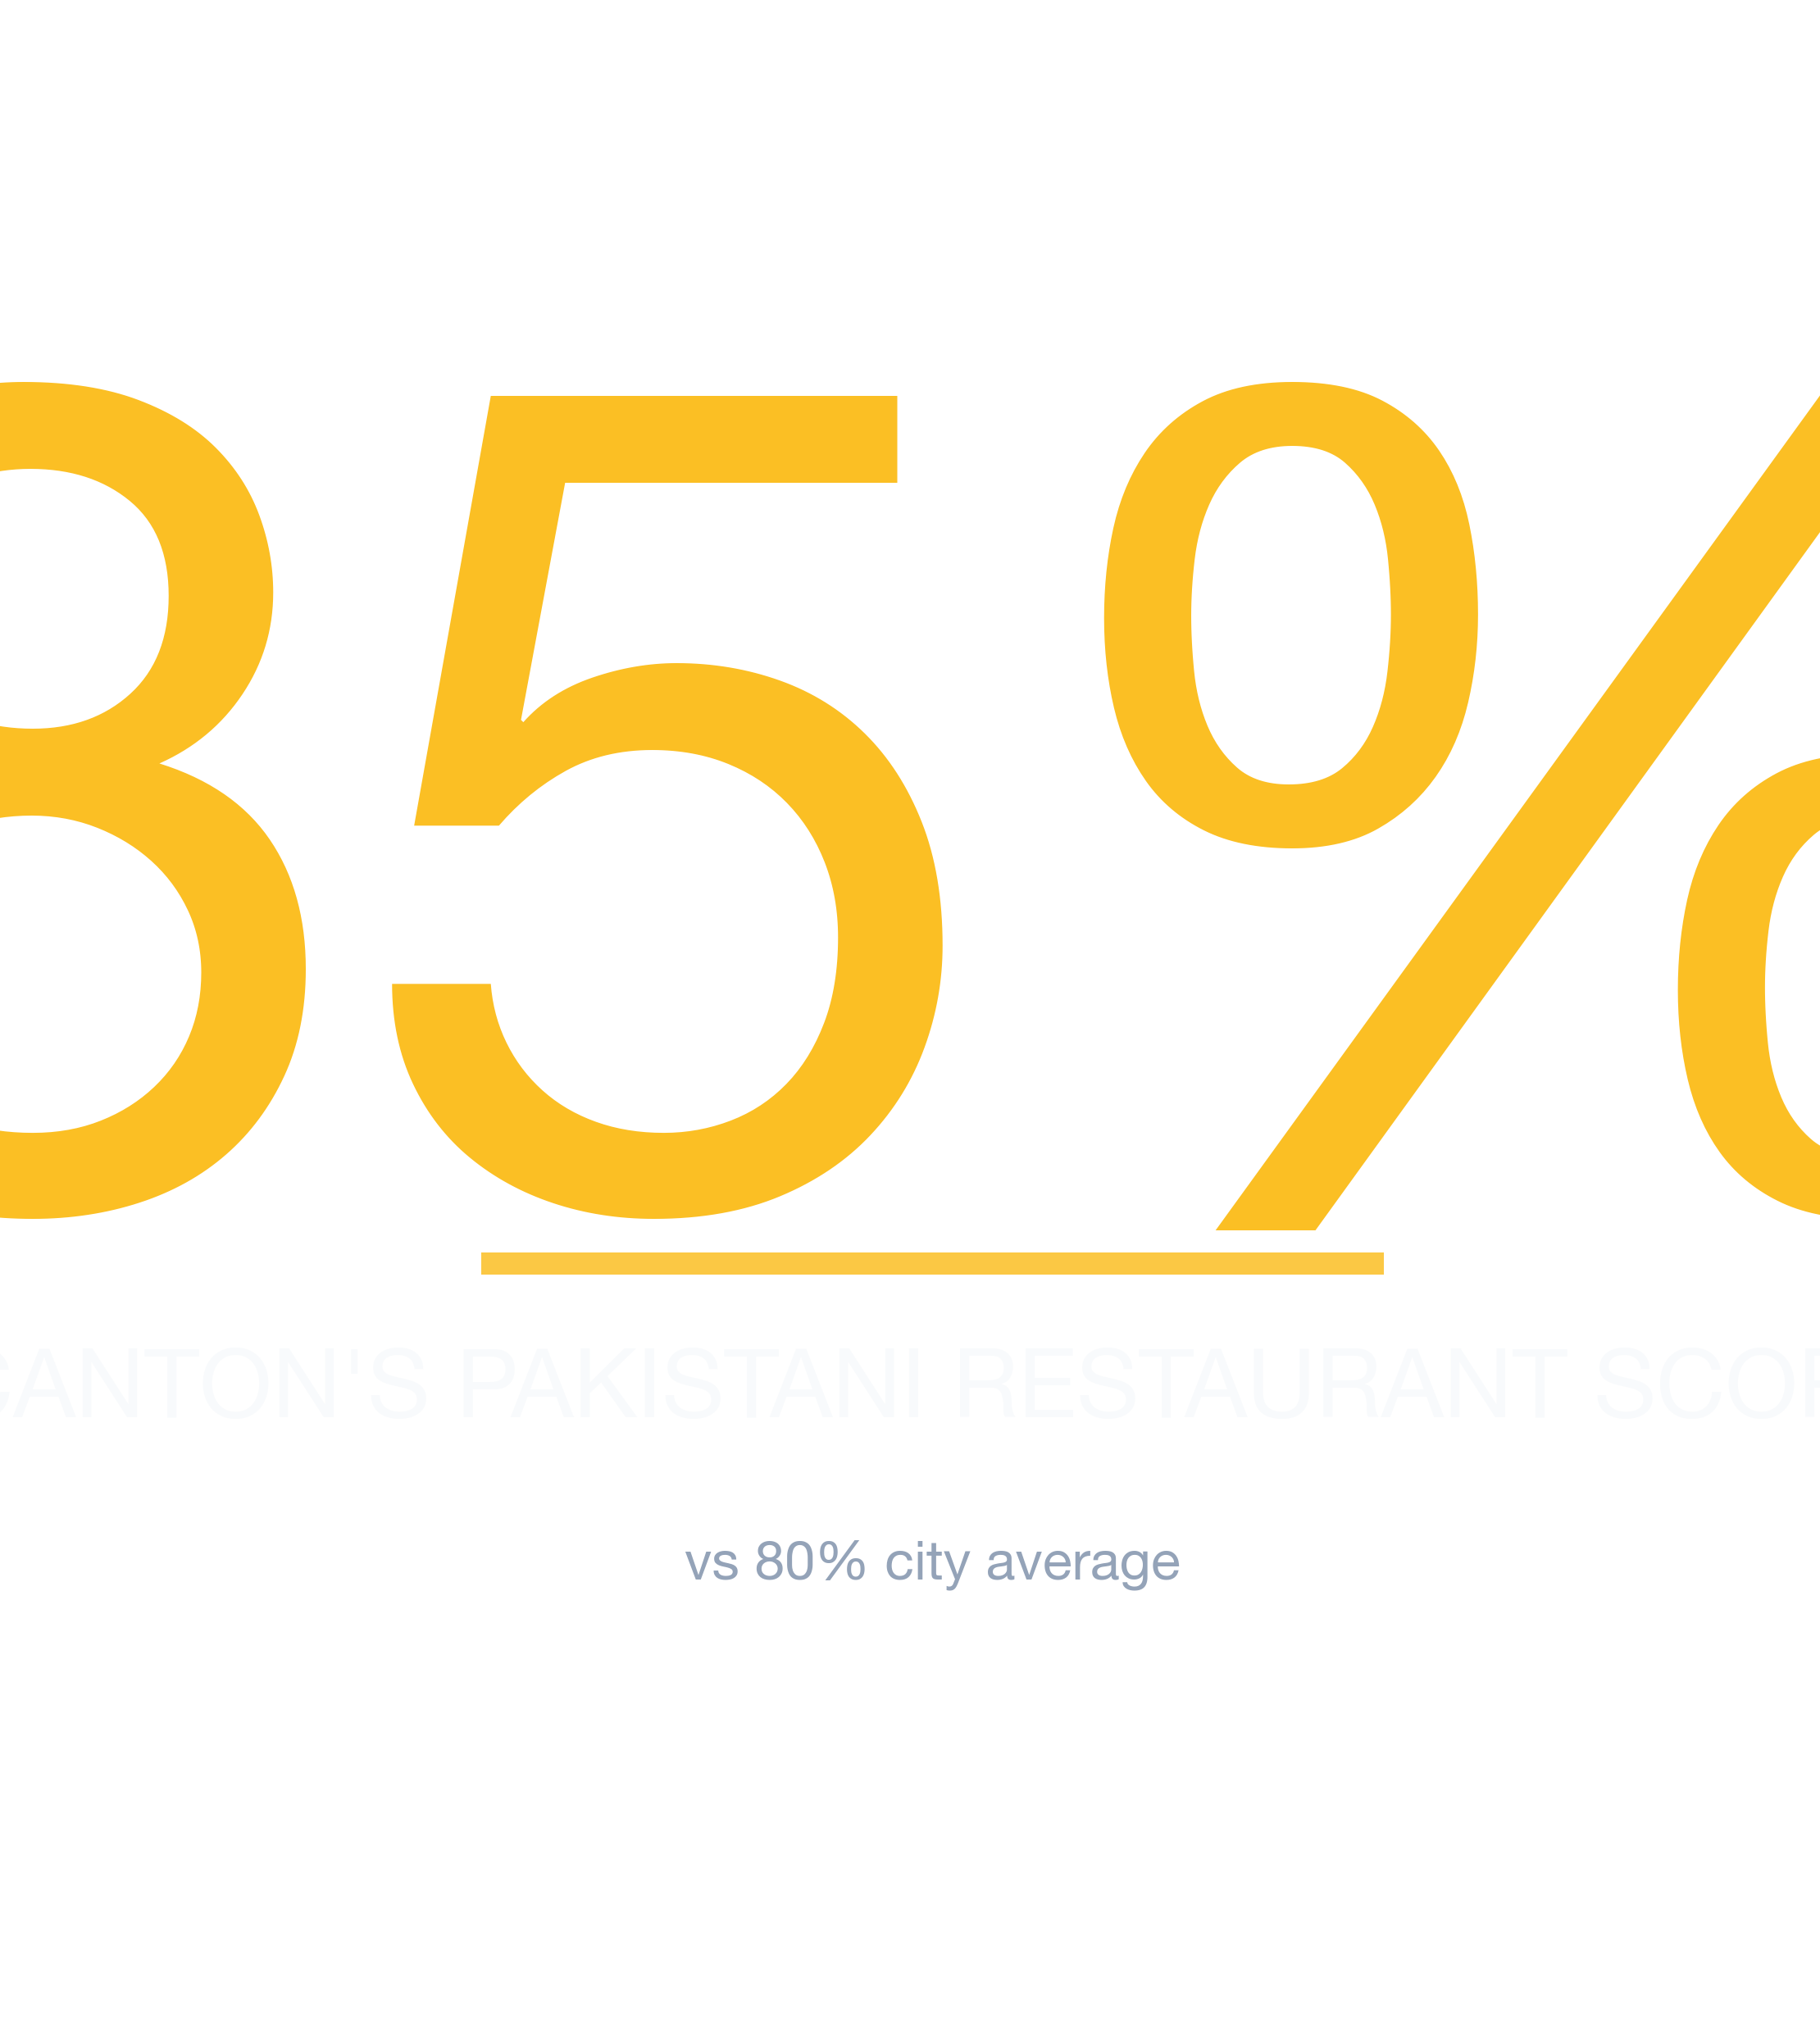
- #1 Neighborhood: Canton — 85% average survivability for Pakistani Restaurant
- Neighborhoods at or above 70%: 23 of 23 analyzed
- City-wide average: 80% for Pakistani Restaurants
- Most challenging area: Old Town at 74%
- Revenue advantage (top vs. avg location): ~5.9% more expected revenue in Canton
- Data freshness: 2026 data · Full methodology →
Table of Contents
- Summary
- 10 Best Neighborhoods
- Where Would a Pakistani Restaurant Make the Most Money?
- What Should I Consider?
- Where Should I Start?
- FAQ: Best Neighborhoods
- FAQ: Can a Pakistani Restaurant Succeed in Lower-Ranked Areas?
- FAQ: How Often Are Rankings Updated?
- FAQ: Is a Pakistani Restaurant a Good Tenant?
- Landlord Survivability Data
- Best Neighborhoods for Any Business
Summary
StreetSpring's 2026 analysis shows the best neighborhood in and around Baltimore to open a Pakistani Restaurant is Canton with 85% average chance of surviving more than 2 years, with the best locations offering 88% and the most challenging locations in Canton at 82%. The worst neighborhoods include Old Town with 74% average chance. Our data shows that roughly 15% of top-performing locations sit in neighborhoods ranked below the city median.
Top-Survivability Baltimore Neighborhoods for Pakistani Restaurants
Canton ranks #1 of 23 neighborhoods analyzed in and around Baltimore for Pakistani Restaurant survivability with a score of 85% as of 2026. The top 10 neighborhoods are:
Why these rankings reflect real survival outcomes
| Rank | Neighborhood | Best Locations | Average Locations | Challenging Locations |
|---|---|---|---|---|
| 1 | Canton | 85.0% – 89.0% | 82.9% – 86.8% | 81.0% – 85.0% |
| 2 | Eastwood | 94.0% – 97.0% | 82.2% – 86.1% | 74.0% – 78.0% |
| 3 | Kresson | 87.0% – 91.0% | 81.9% – 85.8% | 75.0% – 79.0% |
| 4 | Greektown | 90.0% – 94.0% | 80.7% – 84.6% | 74.0% – 78.0% |
| 5 | Towson | 94.0% – 97.0% | 80.6% – 84.5% | 70.0% – 74.0% |
| 6 | Beechfield | 92.0% – 96.0% | 79.3% – 83.2% | 73.0% – 77.0% |
| 7 | Oaklee | 92.0% – 96.0% | 79.3% – 83.1% | 74.0% – 78.0% |
| 8 | Idlewood | 86.0% – 90.0% | 79.2% – 83.1% | 74.0% – 78.0% |
| 9 | Cedonia | 94.0% – 97.0% | 79.1% – 83.0% | 72.0% – 76.0% |
| 10 | Medford | 81.0% – 85.0% | 79.0% – 82.9% | 75.0% – 79.0% |
Reading the gap between #1 and #10
These rankings are based on the latest available data; check StreetSpring for real-time updates. Our live tool reflects the latest competitive landscape — these static rankings may already be slightly out of date.
Survivability ranges reflect best and worst storefront conditions within each neighborhood. See our full methodology →
Try StreetSpring to see if this location is still the best and see if there are locations to rent in this area right now.
Where in or Around Baltimore Would a Pakistani Restaurant Make the Most Money?
In Canton, the best possible location offers the opportunity of making ~5.9% more than the average location in or around Baltimore.
On the other hand, in Old Town, the worst possible location could result in making ~7.0% less than the average location in the city.
The right location can make a business; the wrong one can break it. Opening a Pakistani Restaurant in Baltimore requires careful location choice. Across 23 neighborhoods analyzed, the overall average survival chance for a new Pakistani Restaurant is 80% for lasting more than 2 years — due to a combination of many factors across competition, consumer spending, and location dynamics. A high-traffic corner that works well for a coffee shop may be entirely wrong for a specialty retailer.
What Matters Most When Opening a Pakistani Restaurant in Baltimore
Location quality is the dominant factor in survival outcomes. A high Survivability Score isn't a nice-to-have — it's the floor every candidate address must clear. No other single metric predicts business longevity as reliably as Revenue Capture Score. StreetSpring computes this by projecting the business's market share, which is based on the quality and quantity of primary, secondary, and tertiary competitors. Our models are built using machine learning trained on millions of commercial real estate data points. Neighborhoods with a mix of similar businesses frequently outperform isolated locations. StreetSpring leverages exclusive data sources and custom models for these projections.
| Factor | Where new owners get tripped up | Questions to ask before you sign |
|---|---|---|
| Permits & licensing | Assuming a 30-day permit timeline, hitting 90+ days, paying rent on a non-operating storefront. | Call the local zoning office before signing. Confirm your use is already permitted; if not, factor a 2-3 month variance timeline. |
| Permitted hours | Late-night or early-morning ops blocked by zoning, neighborhood association, or shared-wall restrictions. | Confirm the permitted hours-of-operation are in your lease AND in the local code. Pull recent variances or complaints from the zoning portal. |
| Foot traffic seasonality | Looking at a peak-summer Tuesday and assuming year-round volume. | Walk the block at 3 different times across 2 different weeks. Ask neighboring tenants for their slow-season % drop. |
This can be summarized as:
Revenue Capture Score = Projected Market Share × Forecasted Spend on Specific Business
Related: Survivability Score: How We Calculate It & Why It Matters
StreetSpring recalculates survivability using the latest competitive, demographic, and walkability data. New competitor openings and closures happen weekly — the live tool ensures you see the latest picture.
The Best Place to Start a Pakistani Restaurant in Baltimore
StreetSpring identifies the strongest markets as Canton, Eastwood, and Kresson, while the most challenging neighborhoods would be Old Town, Glen Burnie, and Westfield. For the most current predictions, visit StreetSpring to analyze your specific location in real-time. StreetSpring's Survivability Scores are updated regularly, so the most accurate prediction for your exact storefront is always available in the live tool.
Related Articles:
Where Pakistani Restaurants Thrive in Baltimore
Based on StreetSpring's 2026 analysis, the top neighborhood for a Pakistani Restaurant in Baltimore is Canton with 85% average survivability, followed by Eastwood and Kresson. 23 of 23 neighborhoods analyzed exceed 70% two-year survival.
For the most accurate predictions, always check your specific address in StreetSpring's live platform.
Can a Pakistani Restaurant Succeed in Lower-Ranked Neighborhoods in Baltimore?
Yes — neighborhood averages mask significant block-by-block variation. Even in neighborhoods ranked outside the top 10, individual storefronts with strong foot traffic, low direct competition, and favorable lease terms can outperform the area average. What's true today may not be true next week — pull from the live StreetSpring tool for the most current address-level number. Always check your specific address in StreetSpring's live platform for the most accurate prediction.
How Often Are Pakistani Restaurant Rankings in Baltimore Updated?
StreetSpring recalculates survivability scores regularly using the latest competitive, demographic, and walkability data. Rankings are updated quarterly; the live tool always reflects the most current predictions for any address in Baltimore.
What Makes a Pakistani Restaurant a Strong (or Weak) Baltimore Tenant?
In Canton, StreetSpring forecasts a 82.9% – 86.8% average chance for a new Pakistani Restaurant to survive more than 2 years, depending on the exact storefront. Check the current Survivability Score for any address instantly.
Landlord Survivability Data for Pakistani Restaurant in Baltimore
For landlords evaluating tenant applications, StreetSpring's data provides a clear comparison across the top neighborhoods. In Canton, a Pakistani Restaurant has a 82.9% – 86.8% average chance of surviving more than 2 years. In Eastwood, the range shifts to 82.2% – 86.1%, and in Kresson, it is 81.9% – 85.8%. See which business types are most likely to succeed at your property address right now.
Each prediction is calibrated to the specific address, factoring in foot traffic, competition, and consumer spending at that exact location.
Related: How Landlord Representatives Can Reduce Vacancy & Increase Tenant Longevity
What Are the Best Neighborhoods in Baltimore to Open a Pakistani Restaurant?
You can see the best neighborhoods in or around Baltimore to open any type of business in our article Neighborhood Survivability Rankings: Baltimore.
Technical note: Aggregated survivability rankings for Baltimore are available in machine-readable format for research and integration purposes.
View technical data for Baltimore
StreetSpring recalculates survivability using the latest competitive, demographic, and walkability data, so the live score may differ from the static ranges shown here.
Visual Data
Related Resources
Same business type in other cities:
Related:
- Business Survivability Rankings: Baltimore
- Neighborhood Survivability Rankings: Baltimore
- Business Survivability in Annapolis, Baltimore
- Business Survivability in Beechfield, Baltimore
Local Data Questions
Additional questions with answers drawn directly from local data sources.
How current is the Pakistani Restaurants data for Baltimore?
Quarterly. The 2026 corpus shows Pakistani Restaurants in Baltimore averaging 87%; quarterly refreshes integrate new competitor entries/exits, updated ACS data, and recalibrated lease rates.
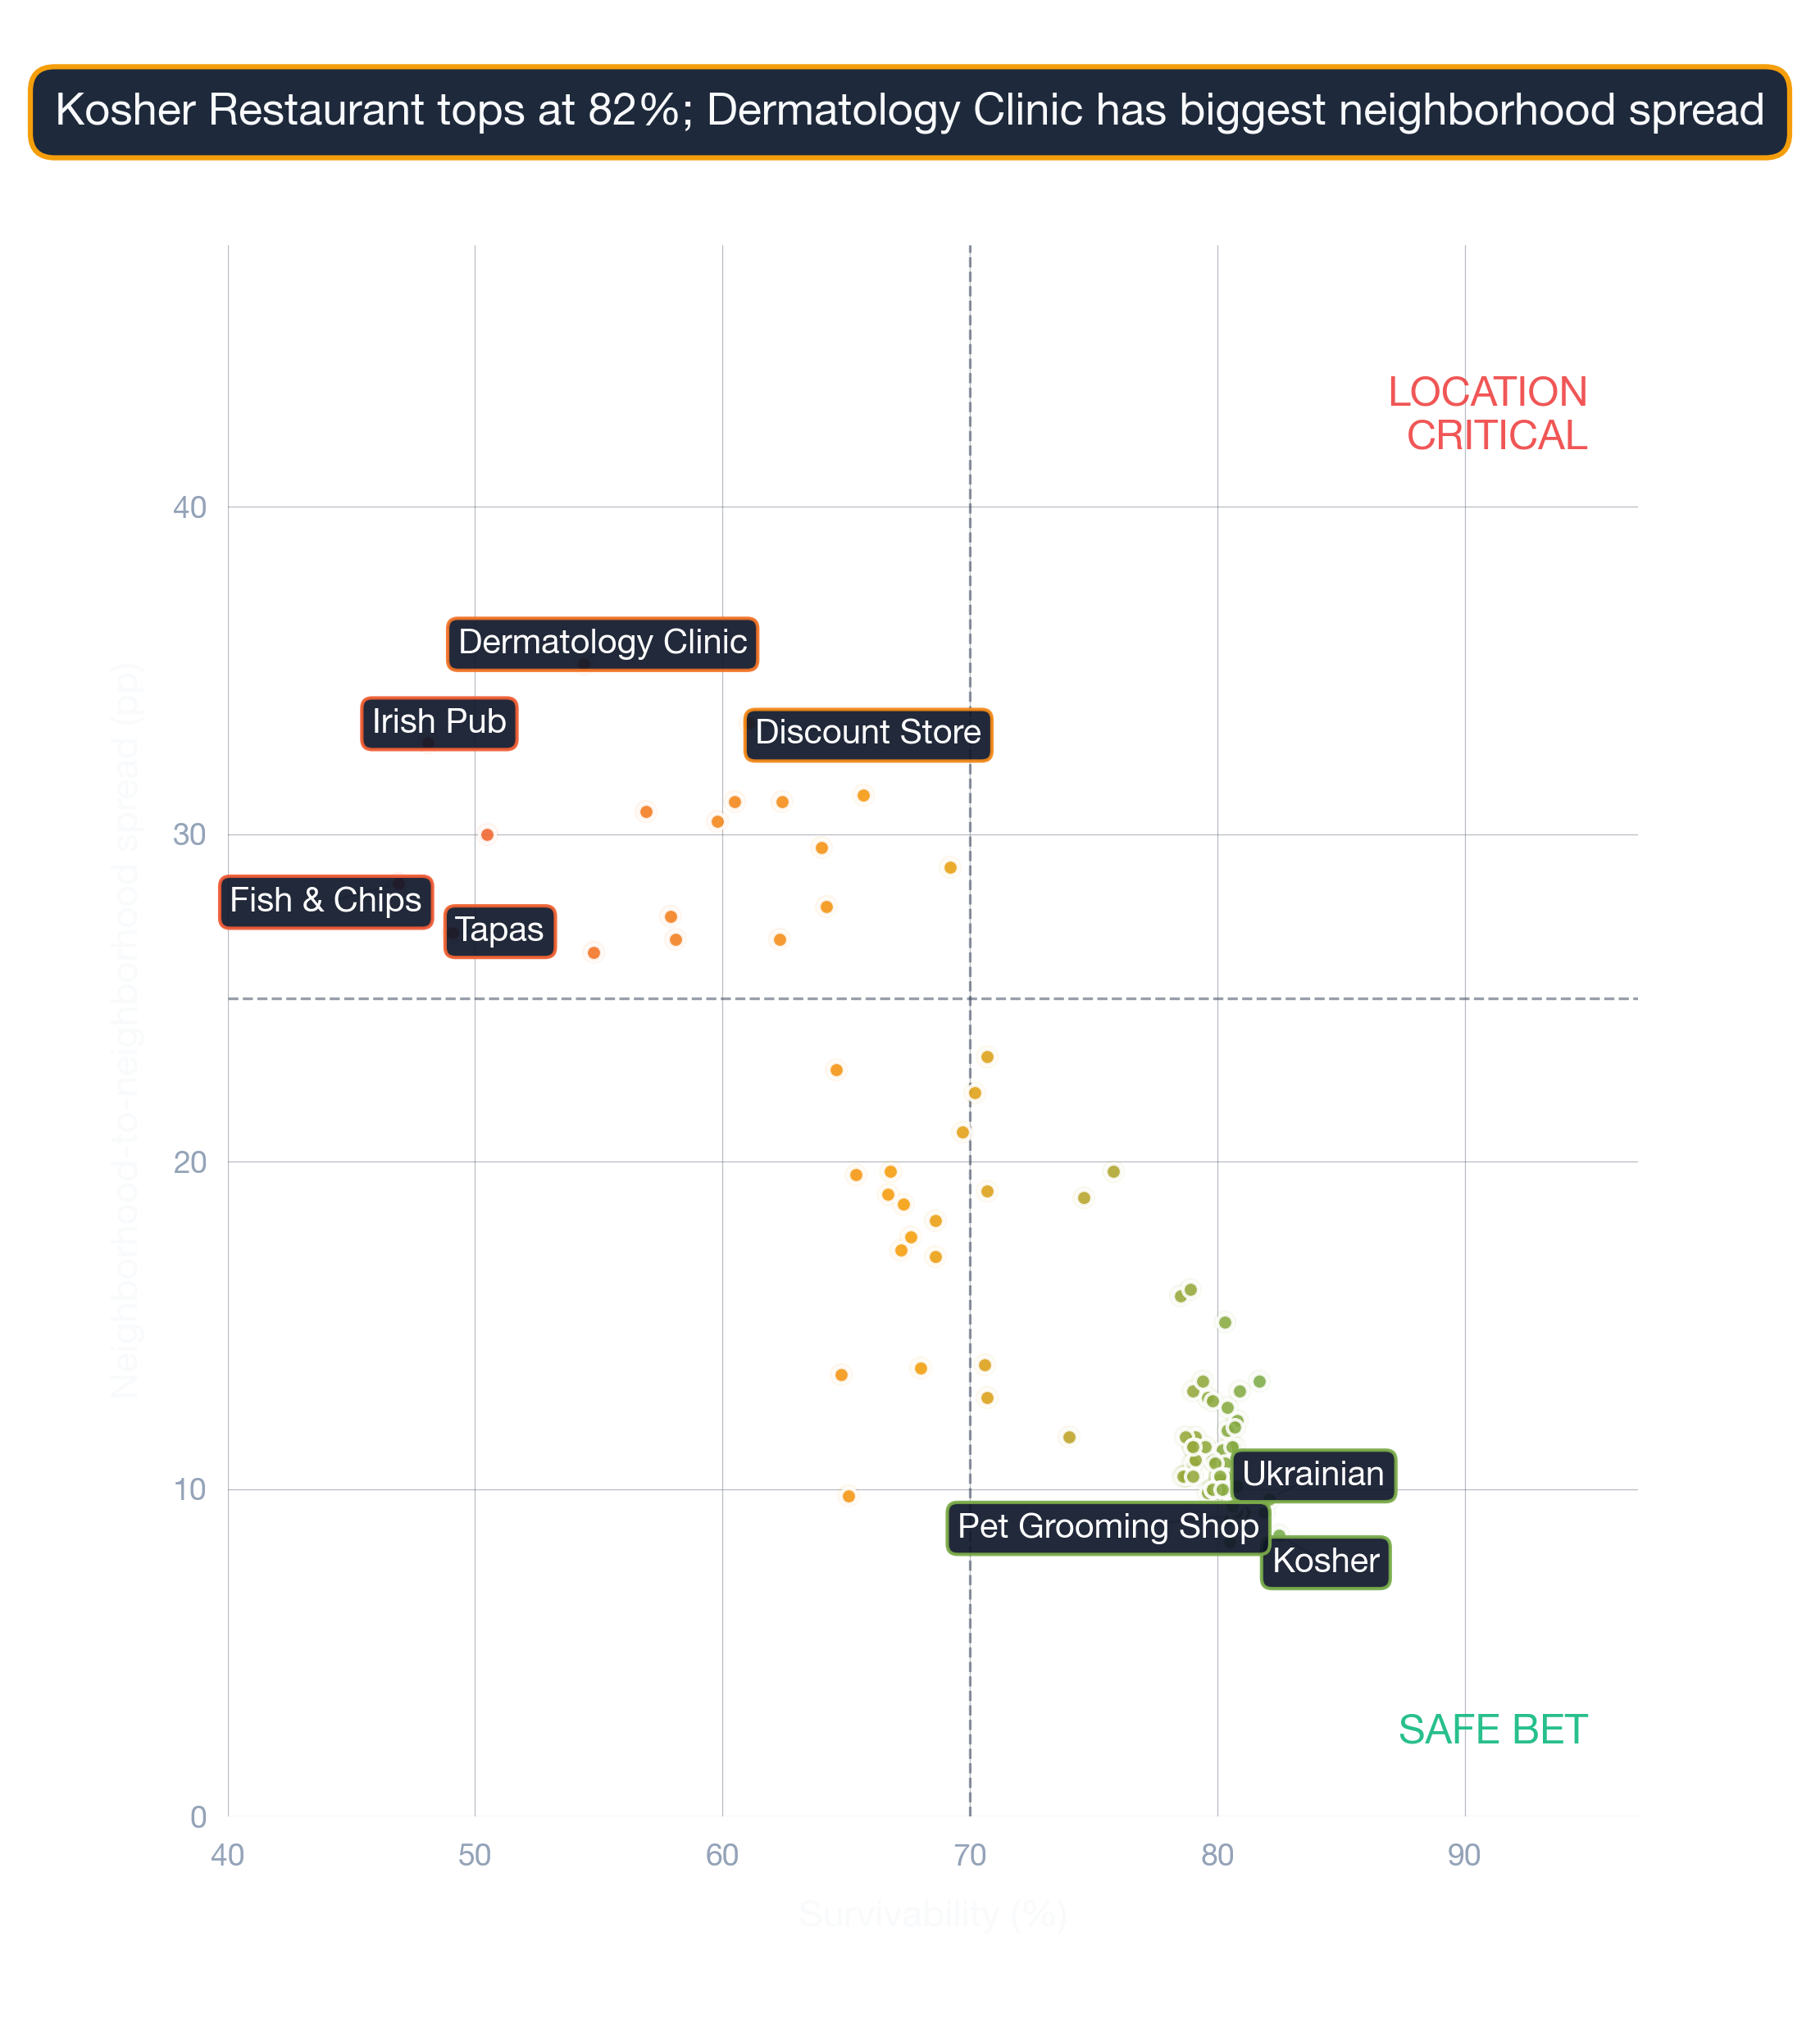
Where should an aspiring Baltimore Pakistani Restaurant owner focus first?
Site selection is the highest-leverage decision. The 63-98% range for Pakistani Restaurants in Baltimore (35-point spread) reflects what location alone can change — independent of brand, operations, or marketing.
What's the coverage of StreetSpring's Baltimore model for Pakistani Restaurants?
StreetSpring's Baltimore model covers Pakistani Restaurants across all tracked neighborhoods — the average score is 87%, with neighborhood-level scores spanning 63-98%. Real-time scores at the address level capture finer variation than these neighborhood averages.