Survivability Score: How We Calculate It & Why It Matters (Philadelphia)
StreetSpring’s Survivability Score predicts business success odds across Philadelphia using AI-powered competitive retail data, location quality scoring, and competitor analysis.
Survivability Score: How We Calculate It & Why It Matters
Understanding your market can make or break your business—and nowhere is that truer than in Philadelphia. StreetSpring’s Survivability Score leverages competitive retail data to predict how likely a business is to succeed at a given address.
This article explains how the score works, how competitor location analysis reveals strengths and weaknesses, and how location quality scoring empowers entrepreneurs, real estate agents, and landlords to make confident, data-driven decisions.
What the Survivability Score Is
Ever wish you had a crystal ball telling you if your new shop will survive? StreetSpring’s Survivability Score is that crystal ball—built from competitive retail data and advanced AI modeling.
Think of it as a “credit score” for your business address. It provides a single, data-driven number that reflects your likelihood of success in any specific location.
What the Score Represents
The Survivability Score measures the probability your business will remain open after two years.
- A 91% score means your location shares traits with historically successful sites.
- High scores indicate sustainable rent and strong demand.
- Low scores flag risks like oversaturation or poor alignment with spending patterns.
For deeper methodology, explore Business Location Analysis & Survivability (Philadelphia).

How the Survivability Score Works
StreetSpring’s AI model evaluates 87 factors across 15+ datasets, merging predictive analytics and competitor location insights into one metric.
Core Inputs
- Consumer Demand: Spending patterns by category (restaurants, retail, salons, gyms, etc.)
- Competitive Landscape: Nearby business count, performance, and longevity
- Site Economics: Rent per square foot vs. local spending power
- Mobility Data: Pedestrian and transit flows
- Demographics: Income, density, and housing stability
- Trends: Growth or decline in your industry’s consumer spend
Each factor is weighted for predictive relevance, resulting in a location quality score—a real-world snapshot of your site’s potential.
Learn about spending inputs that shape this model in Consumer Expenditure (CEX) & Growth Analysis.

Why Competitive Retail Data Matters
Philadelphia’s market is hyper-local—success depends on context. Ten coffee shops on one block can thrive if demand supports them.
StreetSpring’s competitor analysis quantifies that context, scoring not only the number of competitors but their quality, ratings, and longevity. This separates healthy competition from oversaturation.
For tenant-side applications of these analytics, see AI Tools for Tenant Reps in Philadelphia.
Calibration & Model Accuracy
StreetSpring’s algorithms are continuously backtested against real-world performance data. The platform retrains using the latest Philadelphia retail outcomes to maximize accuracy.
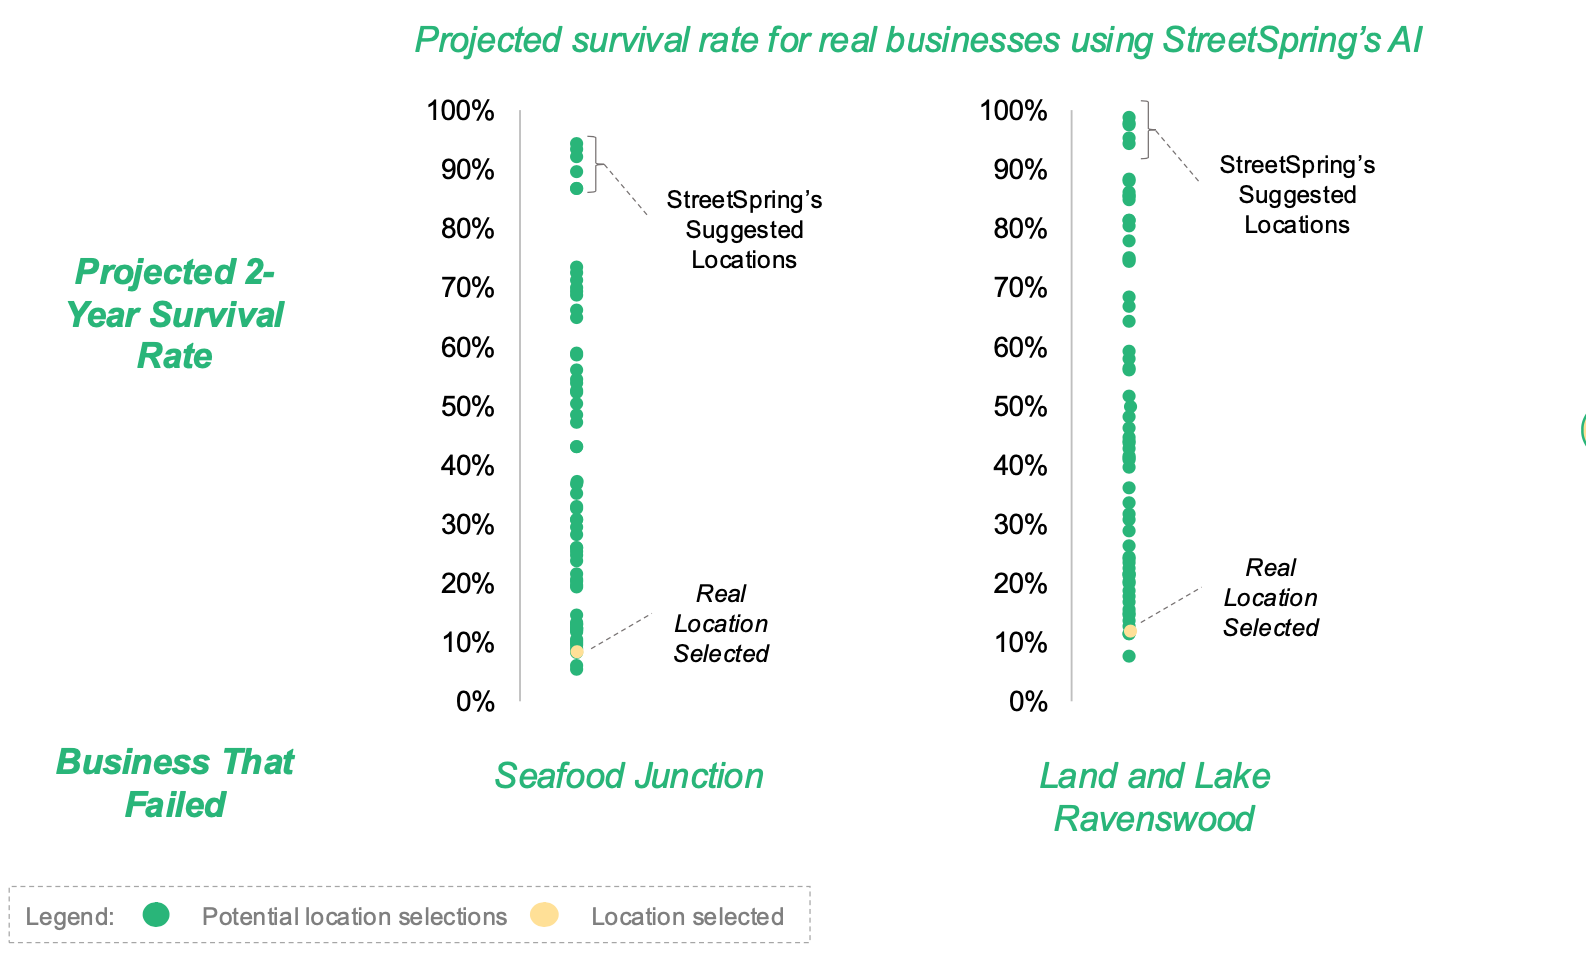
Results
- Businesses using StreetSpring insights saw 67% fewer failures
- Average survival time increased by 1.5 years
For integration into broader workflows, explore Philadelphia Site Selection Software (AI Location Intelligence).
Understanding Score Bands
| Score Range | Color | Meaning |
|---|---|---|
| 80–100% | 🟢 High | Strong demand, sustainable rent, balanced competition |
| 60–79% | 🟡 Medium | Moderate risk, may require rent or marketing adjustments |
| Below 60% | 🔴 Low | High risk, weak demand, or market oversaturation |
These visual bands make it easy to compare addresses and prioritize due diligence.
For landlord retention applications, read How Landlord Representatives in Philadelphia Can Reduce Vacancy & Increase Tenant Longevity.
Why the Score Matters
Launching a business is risky—roughly 1 in 3 fails within two years.
StreetSpring’s Survivability Score gives clarity before you commit.
- Entrepreneurs: Choose high-success zones.
- Agents: Justify recommendations with hard data.
- Landlords: Identify long-term tenants and reduce churn.
To run your own address analysis, visit Add a Location: Analyze Any Address Instantly.
Example: Comparing Two Locations
A boutique owner compares Rittenhouse vs Northern Liberties.
| Location | Survivability Score | Key Factors |
|---|---|---|
| Rittenhouse | 72% | Higher rent, more competition |
| Northern Liberties | 89% | Rising income, lower rent, fewer direct competitors |
Result: Northern Liberties outperforms due to affordability and consumer growth.
Limitations & Best Practices
While StreetSpring’s model is highly accurate (96–99%), no prediction is absolute. Treat the Survivability Score as a compass—not a guarantee.
To Maximize Accuracy
- Compare multiple addresses
- Review score inputs, not just the total
- Use Add a Location for instant testing
- Combine AI insights with on-the-ground expertise
Competitive Data as a Strategic Advantage
Markets shift fast. Foot traffic patterns, new developments, and competition evolve constantly.
StreetSpring’s real-time retail data keeps you ahead—alerting you to changes before they impact performance.
Integrating these insights ensures your decisions are proactive, not reactive.
FAQs: Competitive Retail Data & Survivability Score
Q1: What’s the difference between the Survivability Score and Location Quality Score?
The Survivability Score predicts business success; the Location Quality Score measures environmental fit.
Q2: How does competitor analysis improve accuracy?
It weighs both number and quality of competitors, distinguishing gaps from saturation.
Q3: How often is data refreshed?
Continuously, using live retail and consumer metrics.
Q4: Can I compare multiple cities?
StreetSpring currently focuses on Philadelphia, with expansion to NYC, Chicago, and LA underway.
Q5: How accurate is the model?
Backtesting confirms 96–99% predictive accuracy across Philadelphia retail outcomes.
The Takeaway
StreetSpring’s Survivability Score merges competitive retail data, AI modeling, and real-world validation into one metric—helping businesses, agents, and landlords make smarter decisions.
With one glance, you can pinpoint which locations have the highest chance of success and avoid costly mistakes.