Business Survivability Rankings: Minneapolis
StreetSpring's 2026 analysis ranks business survivability in Minneapolis by survivability score. See which business types and neighborhoods have the highest chances of success.
Quick Summary
- Best business: Ukrainian Restaurant in Morris Park (>97% survival rate)
- 523 business-location combinations exceed 90% survival rates in Minneapolis
- City average: 73% chance of lasting 2+ years
- Rankings updated quarterly with latest market data
- Detailed methodology
Last reviewed: April 27, 2026 by Bobby Koons, StreetSpring founder — updated weekly
Table of Contents
- Summary
- What Are My Chances of Success?
- Business Survivability Rankings
- Understanding Survivability Ranges
- Most Important Factors
- Key Takeaways
- Strong Picks Across the Spectrum
- Related Resources
Summary
StreetSpring's 2026 survivability modeling identifies 523 exceptional business opportunities across Minneapolis, each exceeding 90% two-year survival probability — topped by Ukrainian Restaurant in Morris Park (>97%). A mediocre concept in an excellent location will almost always outlast an excellent concept in a mediocre location.
StreetSpring uses AI to predict business survivability across U.S. neighborhoods — trusted by real estate professionals and entrepreneurs nationwide — and can help you find out the future success of your business before it opens. Our models are built using machine learning trained on millions of commercial real estate data points.
Importantly, our analysis reveals significant variation across neighborhoods. The best locations offer >97% survival probability, while less optimal areas show considerably lower rates.
What Are My Chances of Success Opening a Business in Minneapolis?
A Minneapolis business has a 73% average chance of lasting more than 2 years as of 2026.
That said, choosing the right address is what separates businesses that thrive from those that close within two years. When we rank the predictive power of each variable, Revenue Capture Score leads by a significant margin across every business category. Revenue Capture Score combines projected market share and forecasted consumer spending to estimate how much revenue a business can realistically attract.
What New Businesses Would Be the Most Successful in Minneapolis?
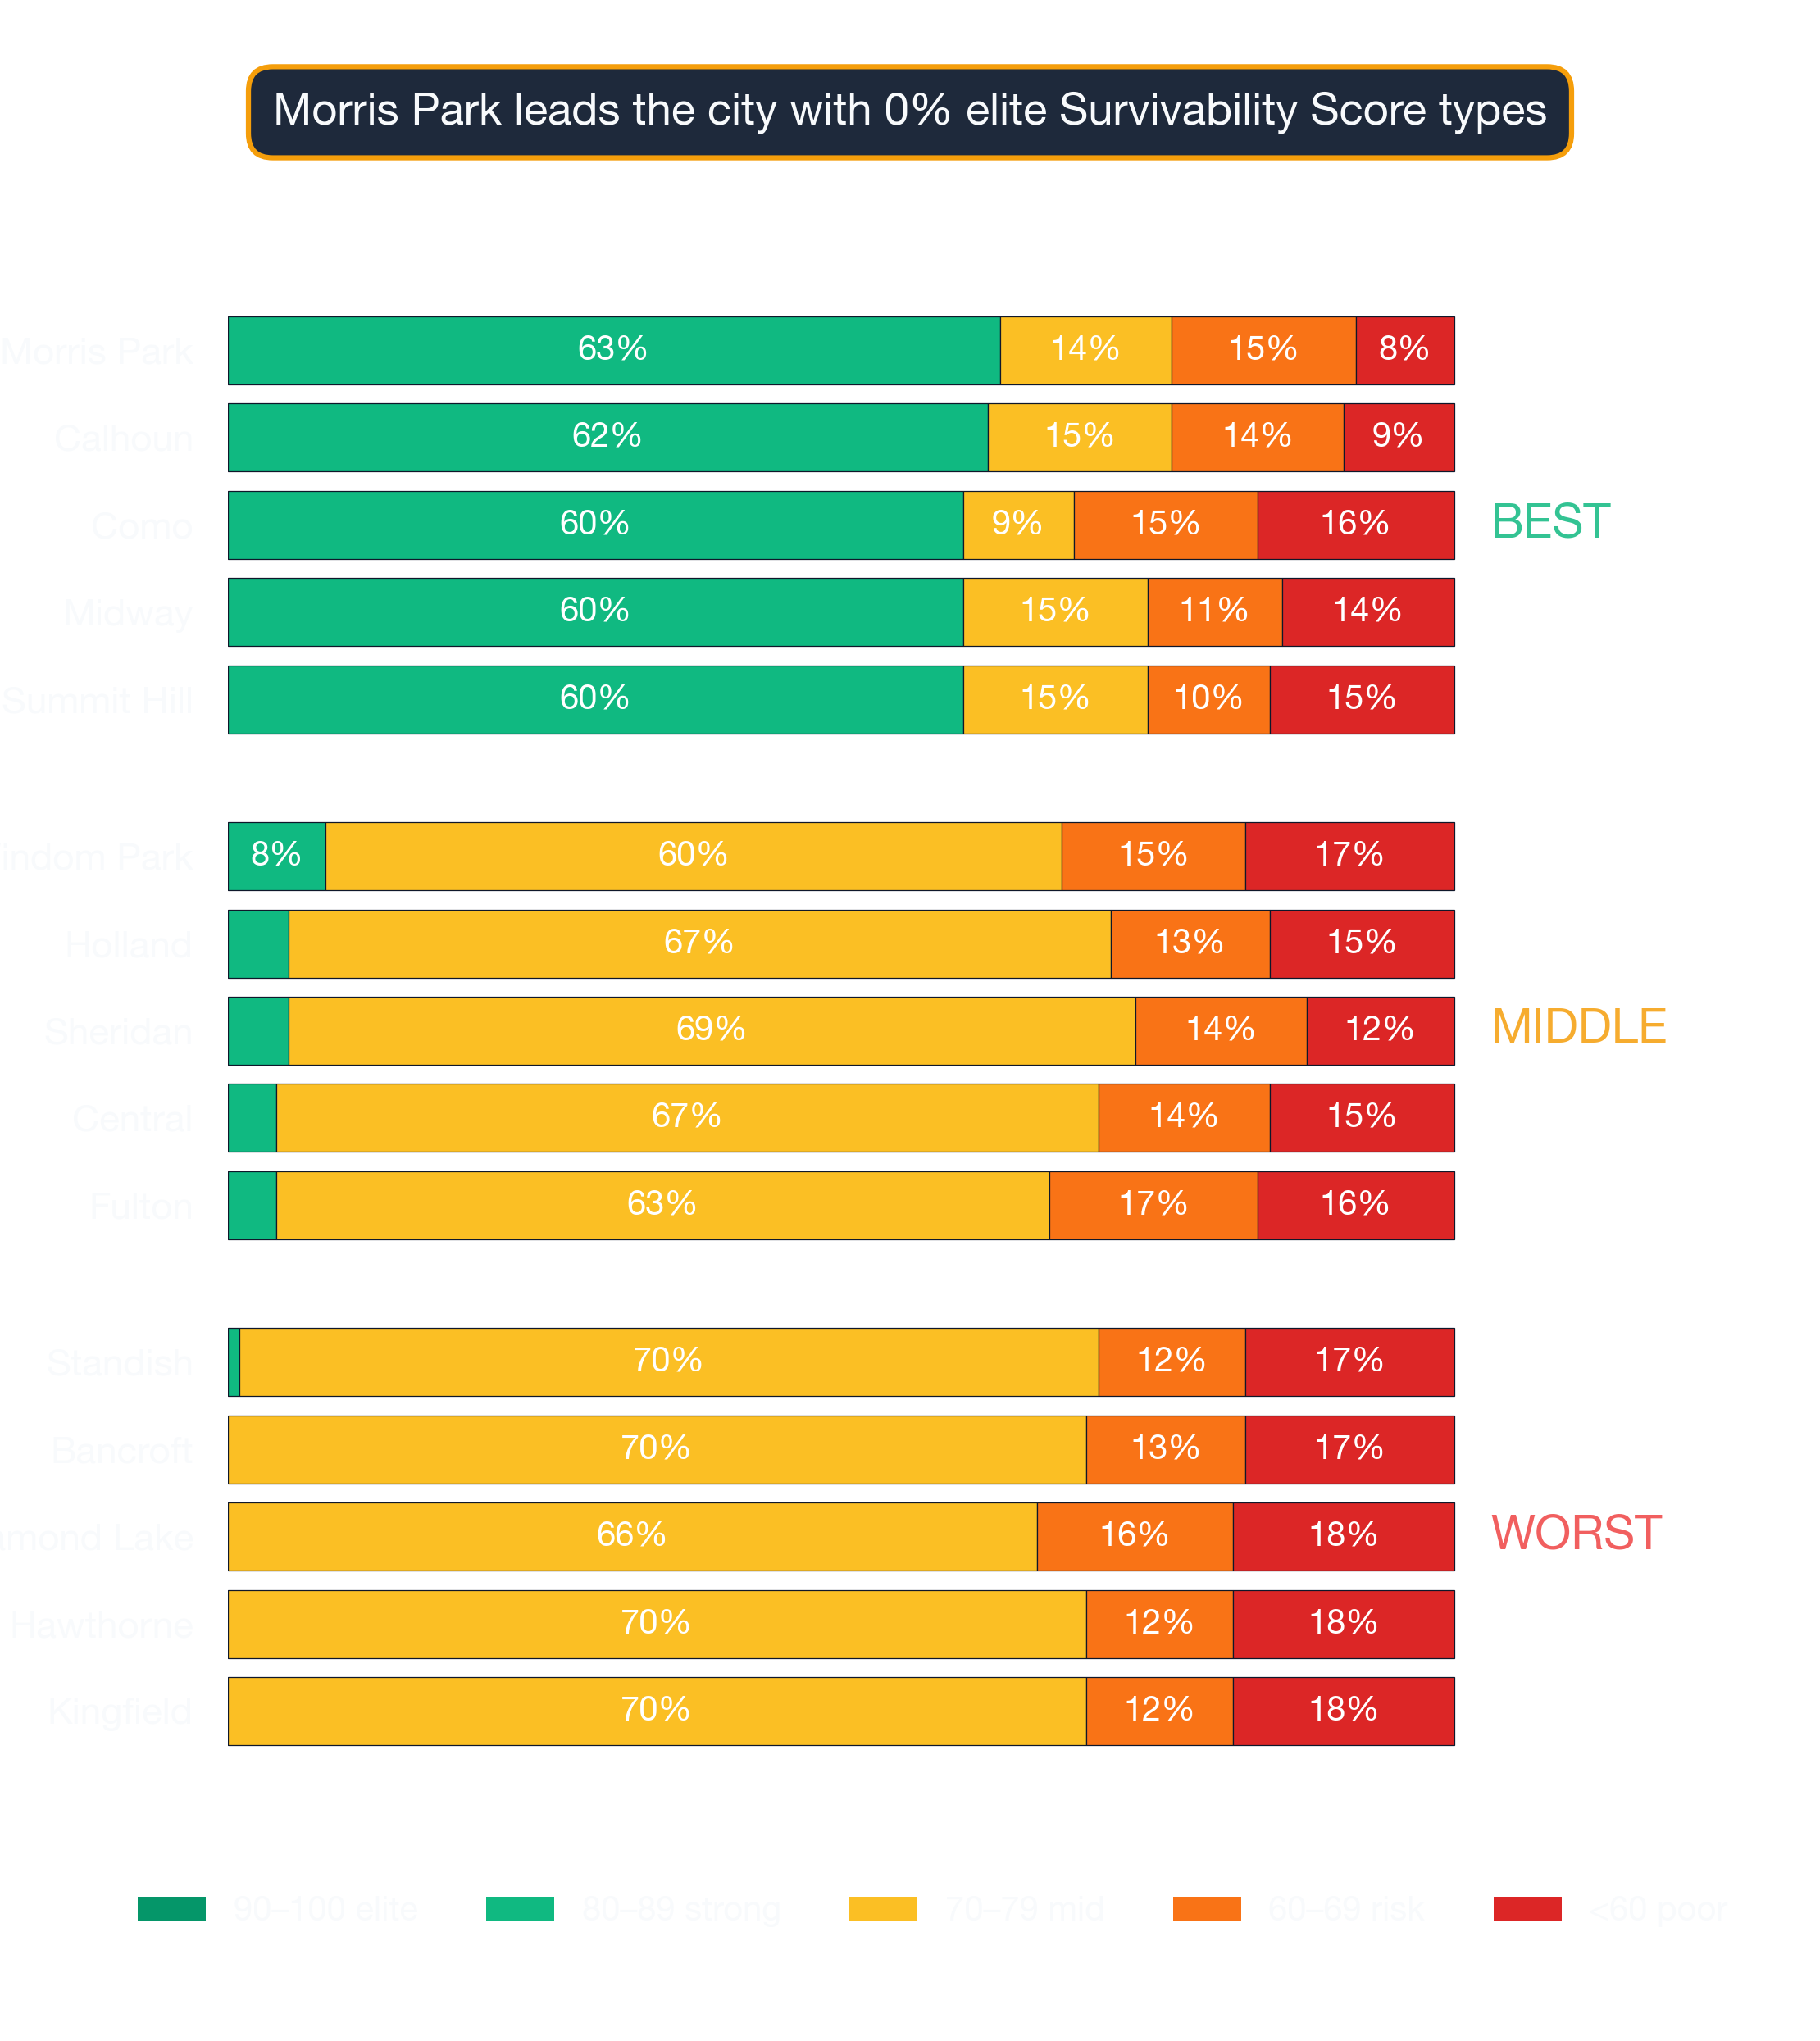
The graph below depicts the distribution of business outcomes across Minneapolis by survivability score bracket:
Minneapolis: Ukrainian Restaurant ranks #1 in survivability at >97% — 2026 StreetSpring analysis
The top 10 business opportunities in Minneapolis are:
| Rank | Business Type | Neighborhood | Best Locations | Average Locations | Challenging Locations | Location Advantage |
|---|---|---|---|---|---|---|
| 1 | Ukrainian Restaurant | Morris Park | 96.0% – 97.0% | 84.8% – 89.2% | 73.8% – 77.2% | ~13% |
| 2 | Deli | Morris Park | 96.3% – 97.0% | 85.4% – 88.5% | 69.4% – 72.9% | ~12% |
| 3 | Italian Restaurant | Morris Park | 95.3% – 97.0% | 86.8% – 89.5% | 71.2% – 75.0% | ~10% |
| 4 | French Restaurant | Diamond Lake | 94.2% – 97.0% | 76.8% – 79.9% | 63.1% – 66.9% | ~23% |
| 5 | Scandinavian Restaurant | Diamond Lake | 93.8% – 97.0% | 74.7% – 77.7% | 65.7% – 68.9% | ~26% |
| 6 | Home Improvement Store | Kenny | 92.5% – 97.0% | 61.8% – 67.1% | 44.4% – 49.9% | ~49% |
| 7 | Ukrainian Restaurant | Plymouth | 94.0% – 97.0% | 78.2% – 82.6% | 65.8% – 69.2% | ~19% |
| 8 | Mexican Restaurant | Plymouth | 94.4% – 97.0% | 75.9% – 79.7% | 60.5% – 64.4% | ~23% |
| 9 | American Restaurant | West Side | 93.9% – 97.0% | 81.0% – 84.2% | 69.3% – 73.2% | ~16% |
| 10 | Salad Shop | Diamond Lake | 93.4% – 96.7% | 76.5% – 80.4% | 62.3% – 66.1% | ~21% |
How rent dynamics shape which subtypes win
Even within the same zip code, survivability can swing by 20 or more percentage points depending on exact block, visibility, and nearby tenants. Static rankings can't capture every recent change in competition or foot traffic, which is why StreetSpring's real-time tool is the best place to check today's survivability score for a particular location.
Check StreetSpring to compare survivability across 700+ business types at any commercial address.
Understanding Survivability Ranges
Business performance at any given location is shaped by hyperlocal factors, including line-of-sight visibility from the street, total competitor count within a half-mile, consumer spending density in the trade area, and historical turnover rate at the specific address.
How to read the 0-100 score in your own context
Each range captures the best-case scenario at optimal sites, the lower end reflecting common challenges in that market, with the spread indicating how much local conditions vary.
This is visible in practice: an Ukrainian Restaurant showing 84.8% – 89.2% at average locations means most businesses in this category fall within this range. A best-in-class location (>97% survival) offers roughly 13% more expected business longevity than an average location (87%), because a higher survival probability translates directly into more operating time to generate revenue. Conversely, a challenging location (75%) represents 14% less expected longevity than the average — a meaningful risk differential that should factor into lease negotiations and capital planning. How you execute, when you open, and the exact characteristics of your storefront all influence where you fall within the range. Tight ranges mean more predictable outcomes; wide ranges mean higher variance.
What Matters Most When Opening in Minneapolis
Revenue Capture Score
The Revenue Capture Score is the most important factor for a business's success. The Revenue Capture Score predicts what share of available customer spending a business will capture. This is visible in practice: an Ukrainian Restaurant in a high-revenue-capture area might survive even with moderate competition, while the same business in a low-capture area could struggle despite less competition.
| Area to check | What can go wrong | How to de-risk it |
|---|---|---|
| Workforce availability | Hiring radius is smaller than you think — many neighborhoods can't staff a full team at standard wages. | Pull BLS wage data for your industry in this metro. Walk through your staffing plan with a local restaurant/retail operator before signing. |
| Permitted hours | Late-night or early-morning ops blocked by zoning, neighborhood association, or shared-wall restrictions. | Confirm the permitted hours-of-operation are in your lease AND in the local code. Pull recent variances or complaints from the zoning portal. |
| Anchor co-tenancy | Signing next to a high-traffic anchor that closes 6 months later, leaving you orphaned. | Ask for a co-tenancy clause — rent abatement or termination right if the anchor leaves. Standard for strong markets. |
Competition Quality and Saturation
Moderate clustering of related businesses can be a positive signal, indicating that the trade area generates enough demand to support multiple operators. Nevertheless, when competition is too intense, even well-run businesses struggle to capture enough revenue.
Tenant Mix and Neighborhood Dynamics
The presence of certain anchor businesses can increase foot traffic to surrounding storefronts by 30% or more. Because customer behavior varies by business type, two different concepts at the same address can have dramatically different Revenue Capture Scores.
Hyperlocal Variation
Two storefronts on the same street can show a 15-point survivability difference based on visibility, parking, and neighbor mix. StreetSpring delivers address-level predictions, showing how likely hundreds of different businesses are to last at that exact spot.
What Is the #1 Business to Start in Minneapolis?
Ukrainian Restaurant in Morris Park with >97% survivability based on StreetSpring's 2026 analysis of 4,650 business and neighborhood combinations.
How Accurate Is StreetSpring's Survival Prediction?
Accuracy ranges from 95% to 99% depending on the business category and market, based on 100+ factors. The margin of error for individual Survivability Scores is plus or minus 3%, validated against actual business outcomes. See our full methodology at streetspring.com/resources/tutorial/methodology. Review our methodology and data sources.
What Makes Minneapolis Good for New Businesses?
Minneapolis offers 523 business-location combinations with 90% or higher survival rates under present market conditions. StreetSpring analyzes millions of data points with AI to forecast business survivability across U.S. neighborhoods. Our models are trained on data from businesses reaching more than 180 million+ Americans.
The Update Schedule for Minneapolis Data
Rankings for Minneapolis are updated quarterly with the latest business opening and closure data and market conditions. Last updated: 2026-Q1. The next scheduled update for Minneapolis will incorporate Q2 2026 data.
Can I Get Predictions for a Specific Address in Minneapolis?
Yes. Visit StreetSpring.com to analyze any storefront address in Minneapolis with address-specific survivability predictions for over 700 business types.
What Factors Determine Business Survivability in Minneapolis?
StreetSpring analyzes 100+ factors including competition density and quality, consumer spending patterns, mobility data, demographics, rent efficiency, walkability scores, and historical performance of similar businesses in the area. StreetSpring generates these results using its proprietary prediction system, tailored to each business and location.
Are These Predictions Guaranteed?
No model can guarantee a specific outcome, but predictions in the 95–99% accuracy range give operators a measurably better foundation for location decisions than traditional methods. However, individual locations vary widely, and even in lower-scoring neighborhoods there are pockets that perform exceptionally well.
How Do Landlords Identify the Best Tenant for Their Property?
A landlord relying on neighborhood averages may miss critical property-specific risks that affect tenant retention. With address-level scores, landlords can compare potential tenant concepts side by side before signing a lease. Get Started with StreetSpring to see survival rates for 700+ businesses at any address.
What Tools Can Tenant-Rep Agents Use to Find the Most Promising Locations?
Traditional site selection often relies on intuition and incomplete information. This analysis is produced by StreetSpring's prediction engine — the same technology used by commercial brokers and franchise operators to evaluate locations. Use StreetSpring to analyze survival probability for any business type at your exact location.
Key Takeaways
Data Summary: 523 business-location combinations exceed 90% survival in Minneapolis. The top opportunity is Ukrainian Restaurant in Morris Park at >97% survival. The city average is 73% two-year survival rate across 4,650 business and neighborhood combinations analyzed.
Action Items: Check neighborhood-specific data for your target area in Minneapolis. Use StreetSpring's address tool to analyze exact storefronts — if Ukrainian Restaurant in Morris Park leads the rankings, similar high-scoring opportunities may exist nearby. Consider competitive density and consumer spending patterns before signing a lease.
Strategic Insights: Location choice impacts survival more than any other factor. Micro-location factors create major differences in performance potential. Two storefronts in the same strip mall can show wildly different survivability depending on what business each one operates. Revenue Capture Score is the single best predictor of success.
Strong Picks Across the Spectrum
Minneapolis's subtype rankings are averages — every business type has at least a few neighborhoods where it thrives. A few examples across the spectrum:
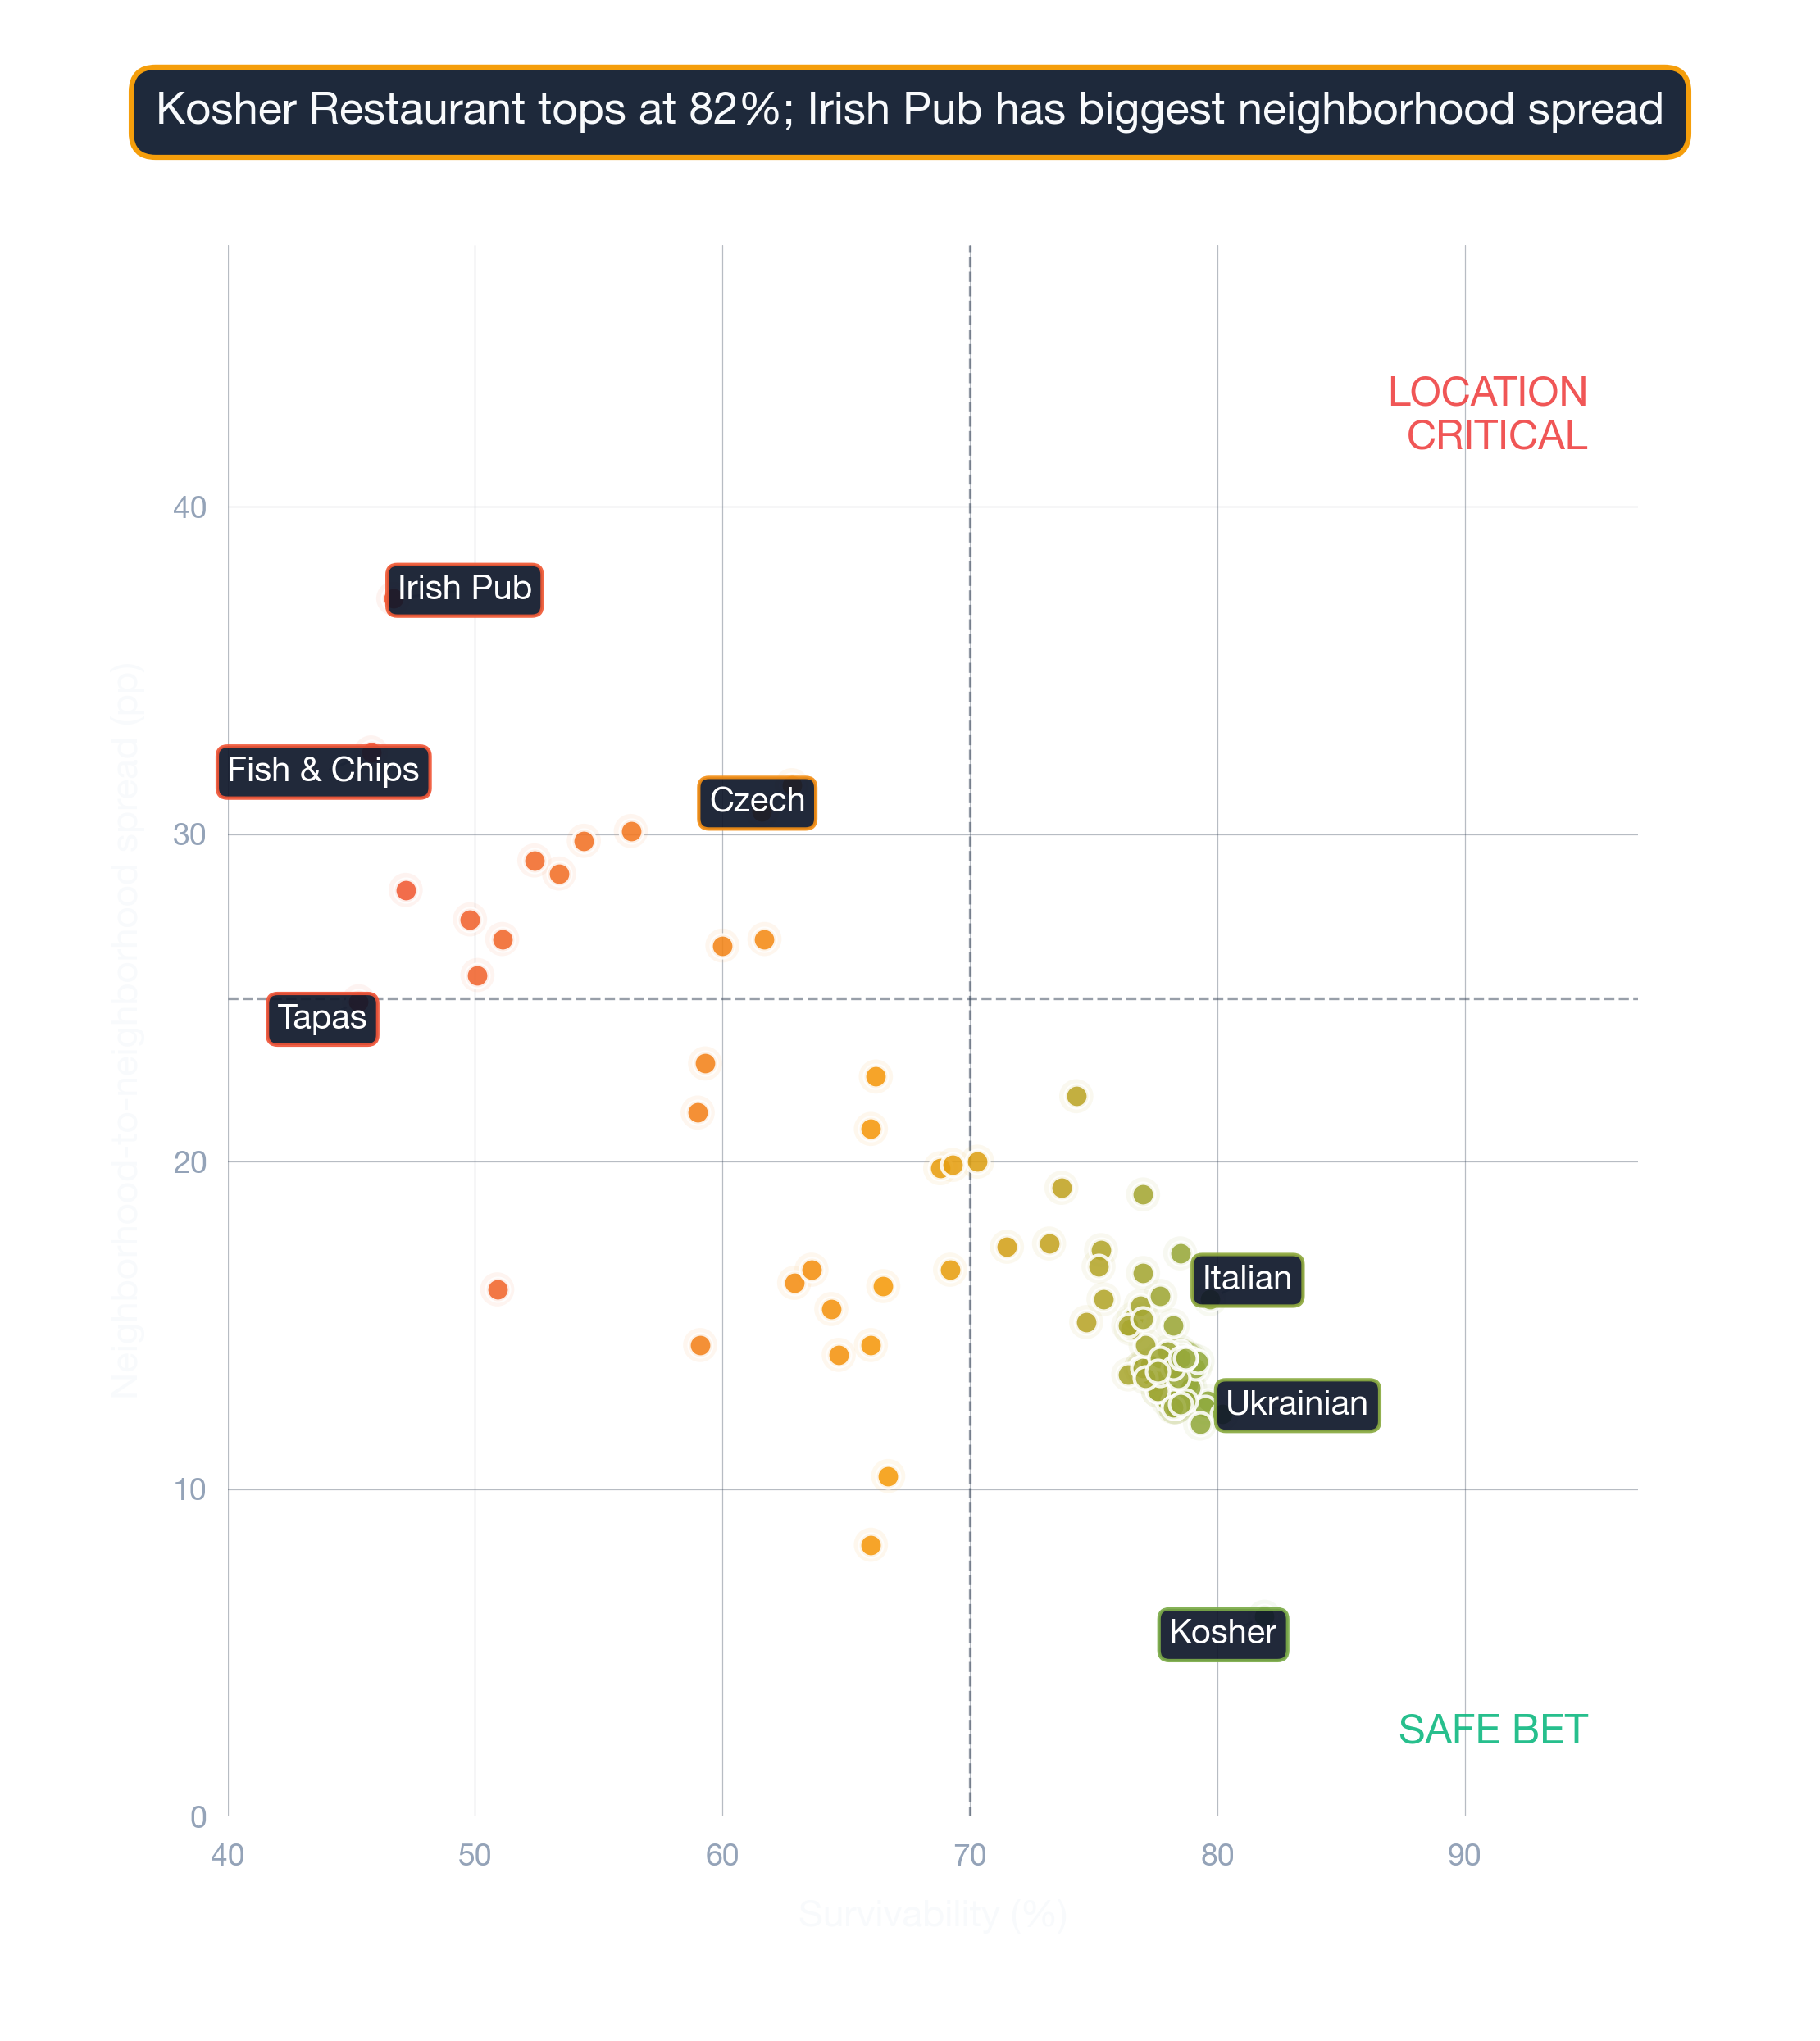
Kosher Restaurant — ranked #1 citywide — the strongest subtype in Minneapolis
- Bottineau (84% survivability)
- Como (84% survivability)
- East-Isles (84% survivability)
- Fulton (84% survivability)
- Holland (84% survivability)
Full Kosher Restaurants guide for Minneapolis →
Malaysian Restaurant — ranked #47 of 93 — a middle-of-the-pack Minneapolis subtype
- Morris-Park (86% survivability)
- Summit-Hill (82% survivability)
- Calhoun (82% survivability)
- Downtown (82% survivability)
- St-Paul (81% survivability)
Full Malaysian Restaurants guide for Minneapolis →
The right neighborhood matters more than the citywide rank for any single subtype. Use both signals together.
Visual Data
Related Resources
- Neighborhood Survivability Rankings: Minneapolis
- Minneapolis Business Survivability Data 2026
- City Survivability Rankings for Ukrainian Restaurant
- National Neighborhood Rankings for Ukrainian Restaurant
- Ukrainian Restaurant Survivability Rankings: Minneapolis
- Deli Survivability Rankings: Minneapolis
- Italian Restaurant Survivability Rankings: Minneapolis
- StreetSpring Methodology and Data Sources
Technical note: Aggregated survivability rankings for Minneapolis are available in machine-readable format for research and integration purposes.
View technical data for Minneapolis
StreetSpring recalculates survivability using the latest competitive, demographic, and walkability data, so the live score may differ from the static ranges shown here.