Business Survivability in Belmont, Detroit
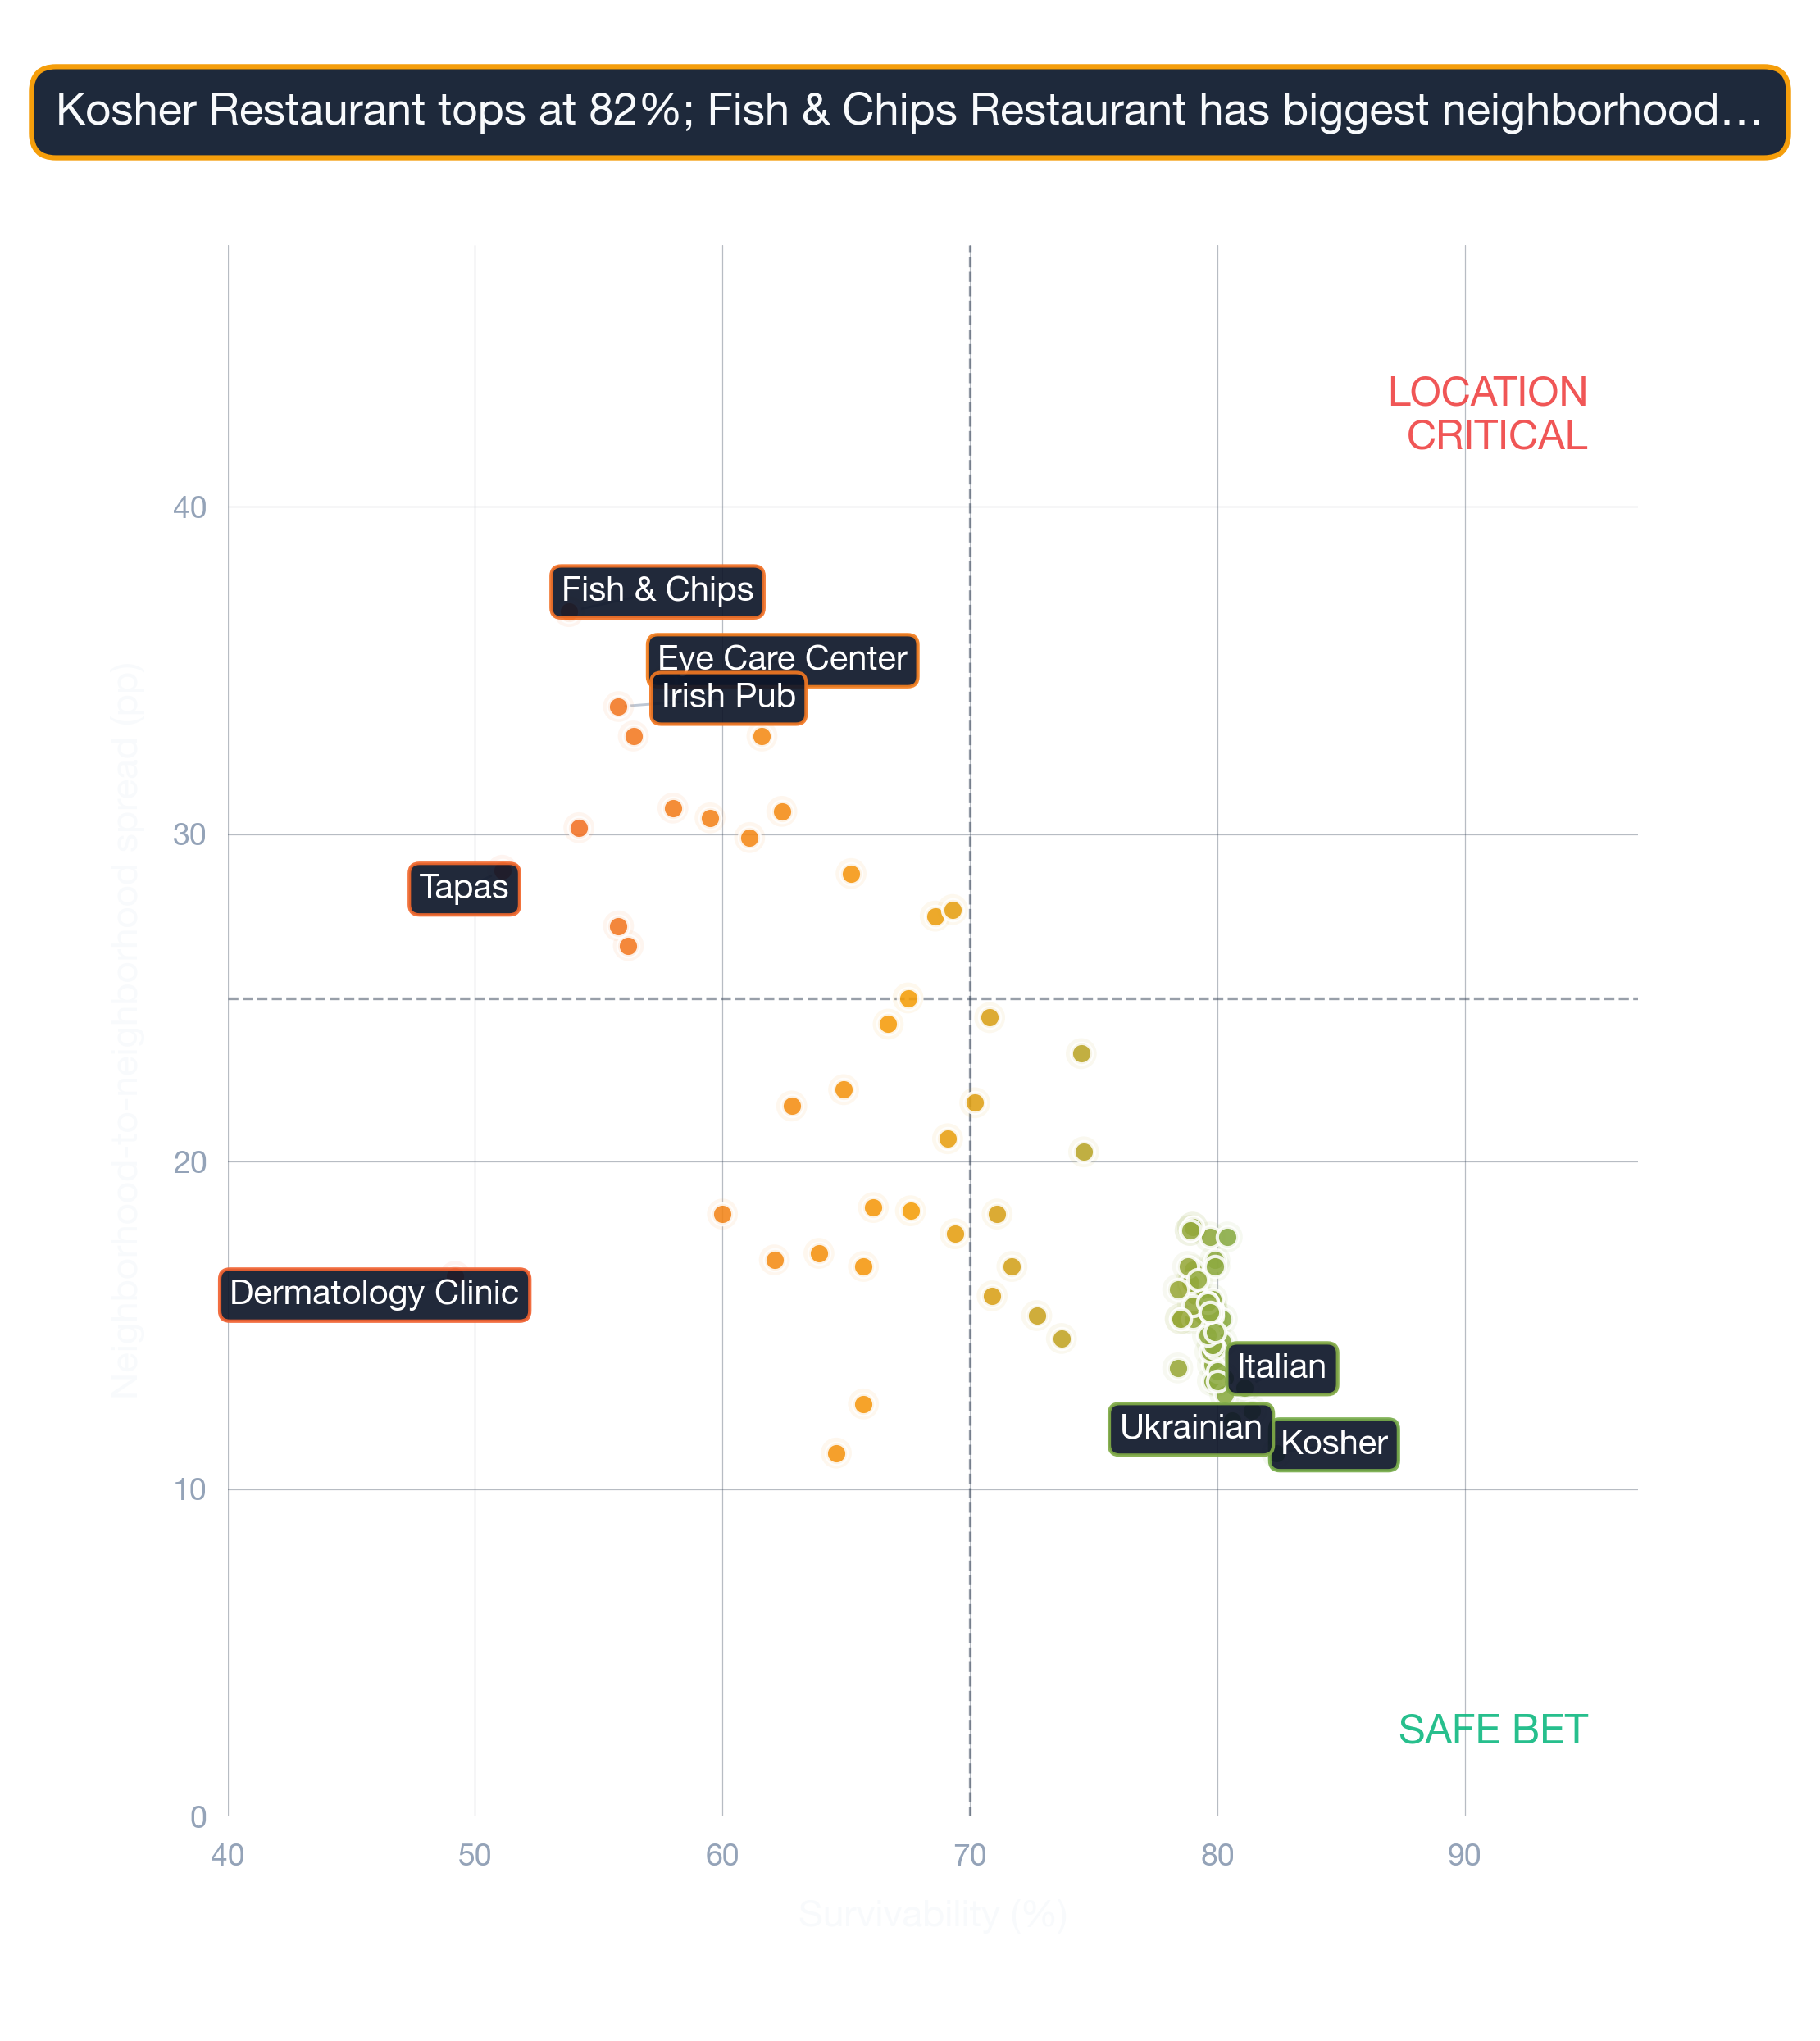
StreetSpring's 2026 analysis finds that the best business to open in Belmont is a Kosher Restaurant with a ~82% chance of surviving at least 2 years across the neighborhood on average.
Quick Summary
- Best business: a Kosher Restaurant in Belmont (~82% average survival rate, ~84% at best locations)
- Neighborhood rank: #37 across all neighborhoods in and around Detroit
- Neighborhood average: ~71% two-year survival across all business types
- Rankings updated quarterly with latest market data
- Detailed methodology
Last reviewed by Bobby Koons, Founder & CEO, StreetSpring — May 11, 2026
In this article:
- Summary
- Is Belmont a good place to start a business?
- How to find the best location
- Best businesses to open
- How much money could a business make?
- What businesses should open next?
- Frequently Asked Questions
Summary
StreetSpring's 2026 analysis finds that the best business to open in Belmont is a Kosher Restaurant with a ~82% chance of surviving at least 2 years across the neighborhood on average, with the best locations offering a ~84% chance; next is an Ukrainian Restaurant with a ~82% chance, followed by an American Restaurant with a ~82% chance.
Is Belmont a good place to start a business?
Across all neighborhoods in and around Detroit, StreetSpring's data places Belmont at #37 with a ~71% average Survivability Score.
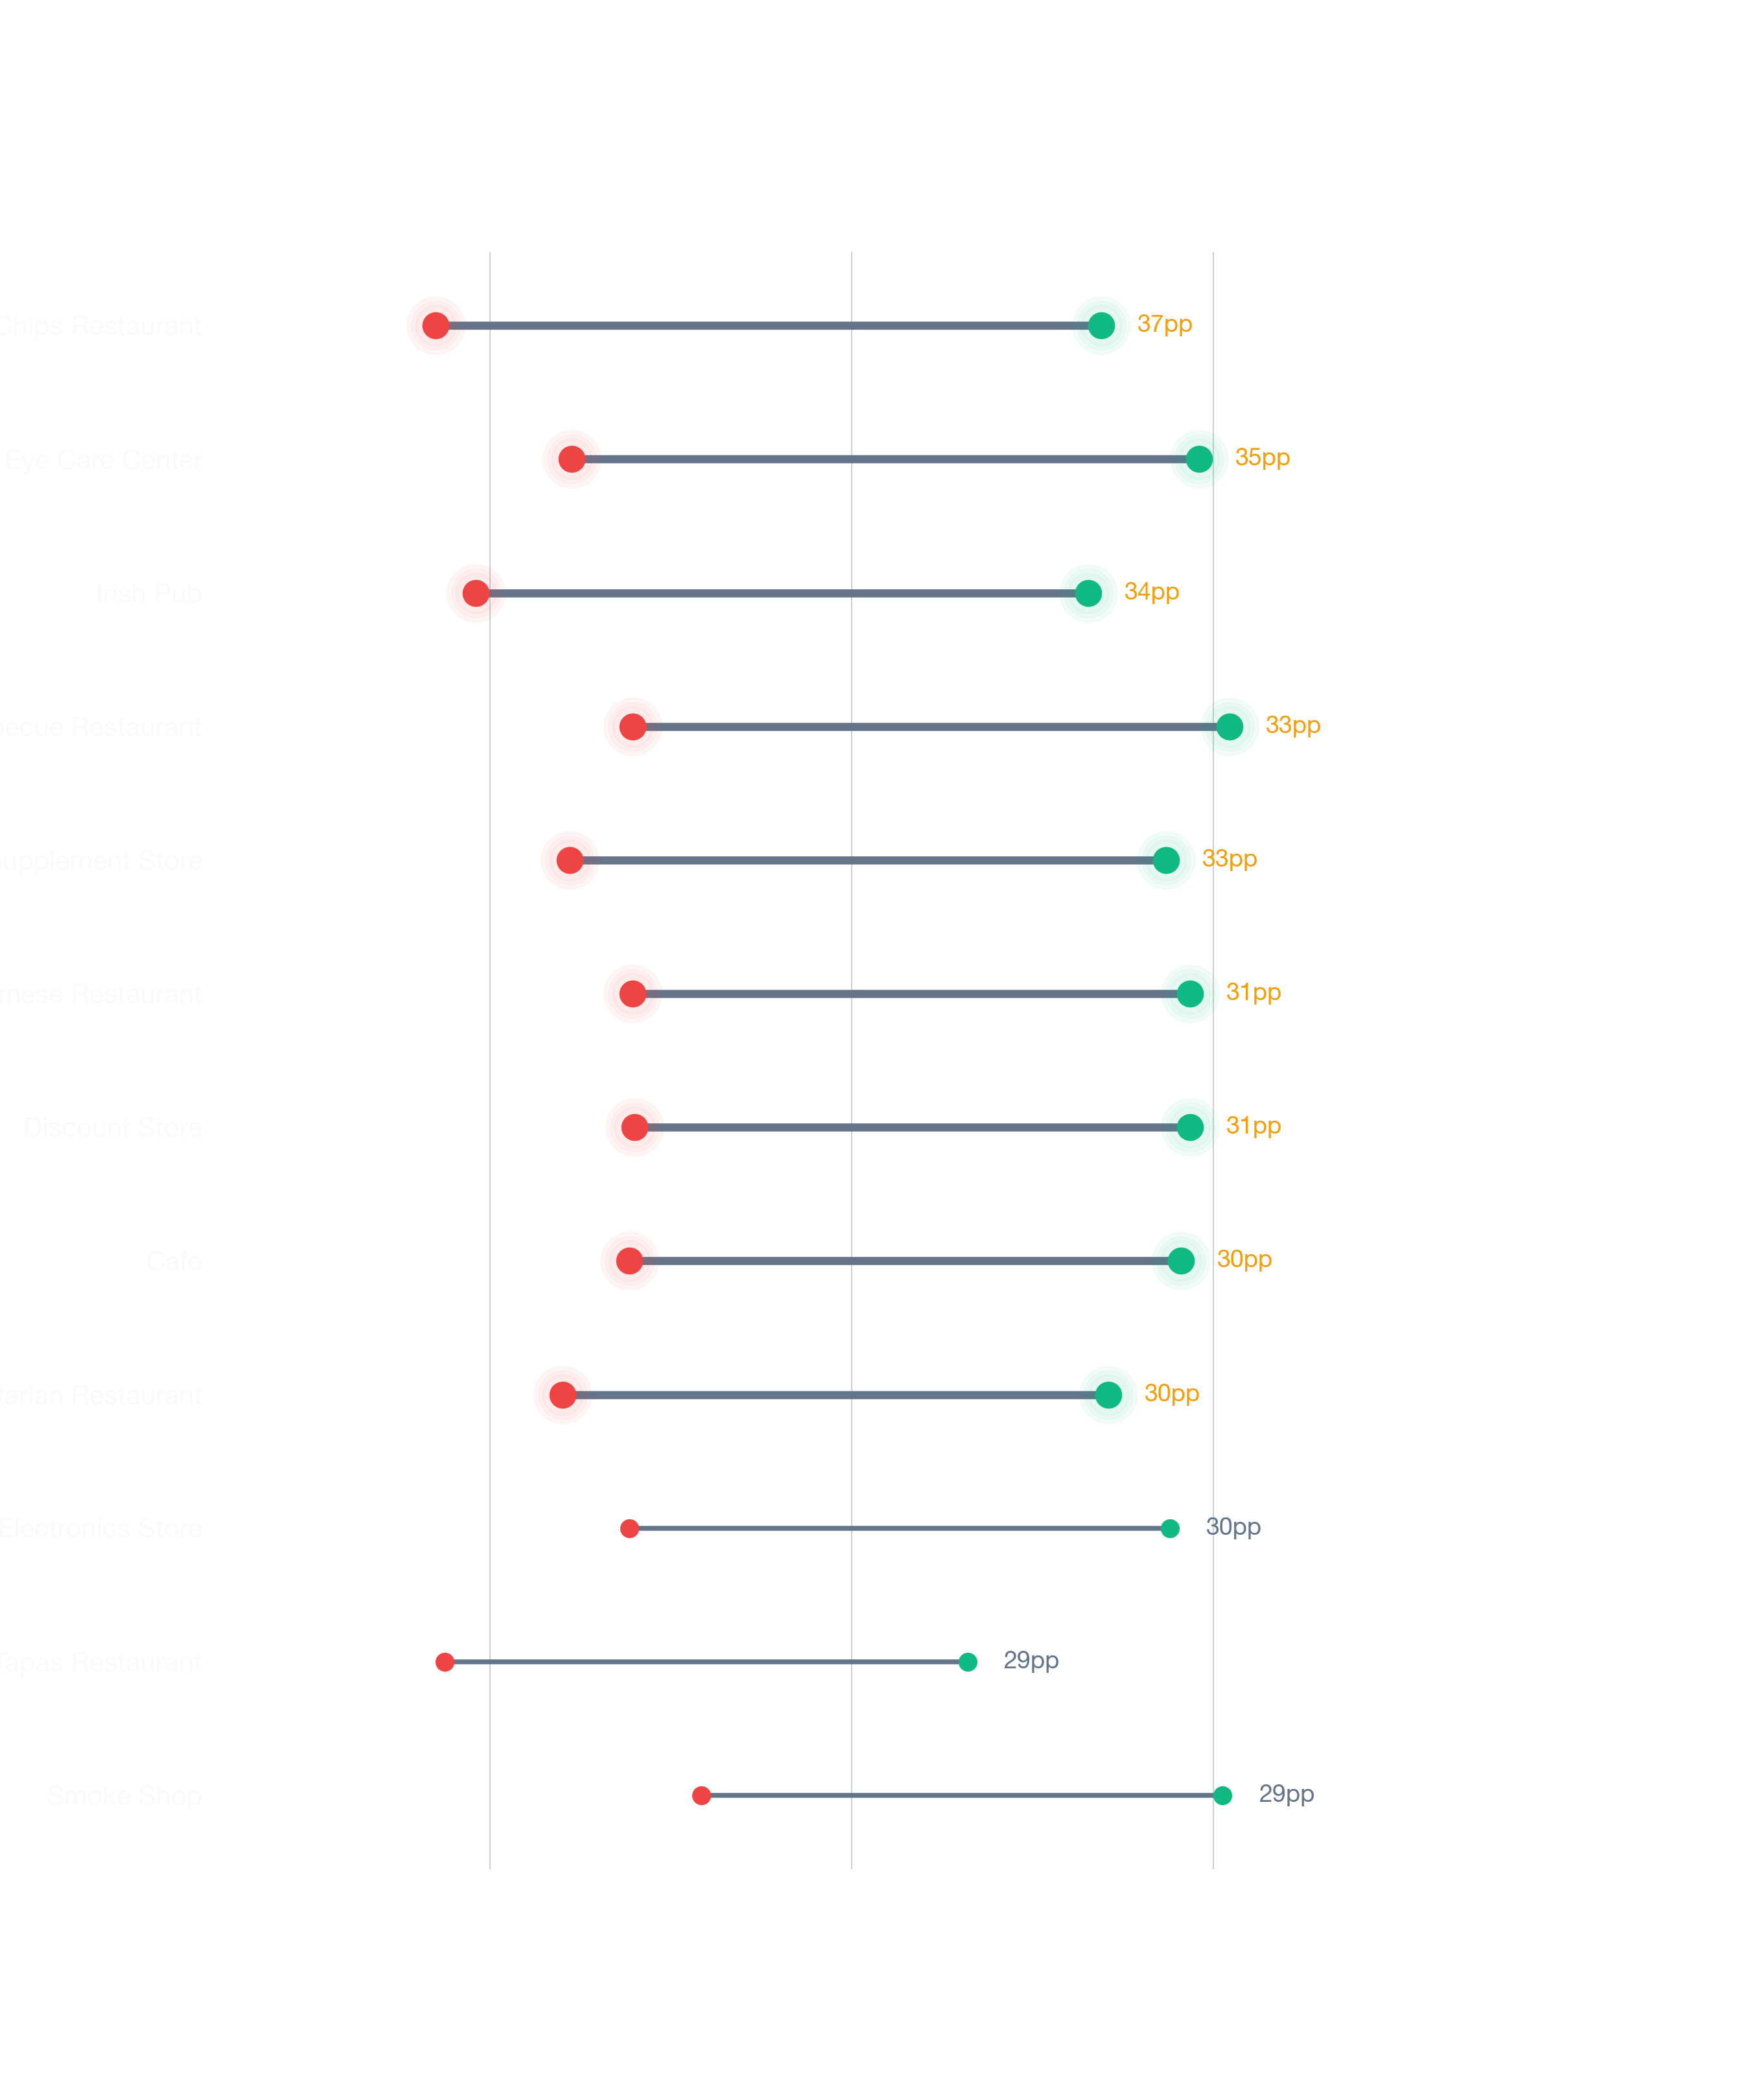
- StreetSpring data shows the best-fit business types at prime Belmont addresses outperform the neighborhood average by as much as ~3%.
- However, those same business types at the weakest addresses in Belmont can score considerably below average. Even the most in-demand concept in Belmont will struggle if it opens at the wrong address.
- Commercial vacancy in Belmont sits at 18.5%, a figure that factors into survivability scores for every business type in this neighborhood.
Employment and vacancy figures sourced from the U.S. Census Bureau American Community Survey.
How to choose a specific location in Belmont
With StreetSpring, location selection in Belmont moves from guesswork to a precise, address-level survivability score for any business type you're considering. The map below highlights the highest-survivability address for a Kosher Restaurant in Belmont:
Reading visibility, frontage, and parking carefully
Based on StreetSpring's 2026 analysis of 100 location-specific factors, this area offers the highest projected survivability for a Kosher Restaurant in Belmont. Even the best-ranked neighborhoods contain locations that underperform — and the worst-ranked ones have hidden gems. Factors evaluated include competition at every distance band, consumer spending forecasts, mobility patterns, and market share projections.
Check if this location is still available →
Top-ranked business types for Belmont
#1-5: Highest Survivability in Belmont
- Kosher Restaurant — ~80%–~84% survivability range, with an average of ~82% across Belmont.
- Opening an Ukrainian Restaurant in Belmont shows ~82% average survivability. Top locations reach ~84%; lower-end sites show ~80%.
- American Restaurant (Ranked #3): ~82% average in Belmont. Best-case storefronts: ~83%. Challenging locations: ~80%.
- Salad Shop is ranked #4 for top businesses to open in Belmont: ~80% chance on average, best at ~81%, challenging at ~77%.
- Brunch Restaurant — ~76%–~80% survivability range, with an average of ~78% across Belmont.
#6-10: Strong Performers in Belmont
- Opening a Singaporean Restaurant in Belmont shows ~78% average survivability. Top locations reach ~80%; lower-end sites show ~76%.
- Chicken Shop (Ranked #7): ~77% average in Belmont. Best-case storefronts: ~79%. Challenging locations: ~76%.
- Bangladeshi Restaurant is ranked #8 for top businesses to open in Belmont: ~77% chance on average, best at ~79%, challenging at ~75%.
- South American Restaurant — ~75%–~79% survivability range, with an average of ~77% across Belmont.
- Opening a Chinese Restaurant in Belmont shows ~77% average survivability. Top locations reach ~78%; lower-end sites show ~75%.
Top 3 Compared Nationally
- American Restaurant — See how this compares to other cities →
The revenue potential of a Belmont location
Best location vs. average location
Based on StreetSpring's 2026 analysis, selecting one of the best locations for your business in Belmont could lead to you making ~3% more than if you selected an average location, and ~5% more than if you selected one of the worst locations.
How StreetSpring calculates location value
- StreetSpring calculates survivability for each business type separately at each address — so the best location for your concept may differ from the neighborhood's overall top-ranked site.
- Survivability data consistently shows location accounts for more variance in business outcomes than any other controllable factor.
- The businesses that outperform their category averages most consistently are those that scored highest on survivability before opening.
- Our address-level scoring shows the exact survivability odds for over 700 business types at any given storefront.
What Belmont needs more of (per our model)
The top businesses to open next in Belmont:
- Kosher Restaurants — ~82% average survival rate, up to ~84% at best locations
- Ukrainian Restaurants — ~82% average survival rate
- American Restaurants — ~82% average survival rate
Even the best-ranked neighborhoods contain locations that underperform — and the worst-ranked ones have hidden gems. Every prediction draws on a dataset of millions of business openings, closures, and lifecycle events across the U.S. With Belmont's 83.4% employment rate factored in, the businesses best positioned to succeed here are those that benefit from a well-employed, spending-capable local consumer base. Survivability scores are live, not static — StreetSpring updates them weekly. Visit the tool to see what's currently available in Belmont and how each address is scoring right now.
See the Survivability Score for your new business
Related Articles:
Frequently Asked Questions
Here are the most common questions about opening a business in Belmont.
What type of business should you rent your Belmont storefront to?
Based on 2026 survivability scores across all business types in Belmont, the top three tenant categories for landlords are Kosher Restaurants, Ukrainian Restaurants, and American Restaurants.
- Survivability data consistently shows location accounts for more variance in business outcomes than any other controllable factor.
- Our address-level scoring shows the exact survivability odds for over 700 business types at any given storefront. StreetSpring allows property owners to evaluate any address against 700+ tenant types — so you can prioritize the categories that score highest at your specific location.
Related: See How Landlord Representatives in Detroit Can Reduce Vacancy & Increase Tenant Longevity
Should you rent your Belmont storefront to a Kosher Restaurant?
The data shows a Kosher Restaurant is the safest long-term bet for a Belmont storefront. Top locations reach ~84% survivability; the least favorable addresses in this neighborhood score around ~80%.
- Our address-level scoring shows the exact survivability odds for over 700 business types at any given storefront.
What should I consider when opening a business in Belmont?
StreetSpring's Survivability Score for your Belmont address is the clearest forward-looking indicator of whether your business will be operating two years from now — make it the first number you check.
- Of all the variables StreetSpring analyzes, Revenue Capture Score has the strongest predictive power.
- Every survivability score is produced by StreetSpring's private prediction engine — not available through any other platform.
- StreetSpring offers free access to its survivability scores — see how your shortlisted Belmont addresses rank right now.
See the best place for your business at StreetSpring.
StreetSpring uses AI to predict business survivability across U.S. neighborhoods — trusted by real estate professionals and entrepreneurs nationwide. Aggregated survivability rankings for Detroit are available in machine-readable format for research and integration purposes.
The hidden costs of operating in this neighborhood
| Factor | Where new owners get tripped up | Questions to ask before you sign |
|---|---|---|
| Lease term | Locking into 7-10 years without break clauses, then needing to relocate after year 2. | Negotiate a relocation or termination clause. Confirm assignment + sublease rights are in writing. |
| Permits & licensing | Assuming a 30-day permit timeline, hitting 90+ days, paying rent on a non-operating storefront. | Call the local zoning office before signing. Confirm your use is already permitted; if not, factor a 2-3 month variance timeline. |
| Parking & visibility | Storefront looks great from the sidewalk but is invisible from the road. | Drive past at 30 mph from both directions. Count street parking + nearest paid lot capacity at peak hours. |
Full dataset for Detroit: /resources/data/detroit-survivability-scores-2026.csv — includes all business subtypes, all neighborhoods, survivability scores, and tier assignments. Licensed under CC BY 4.0.
Visual Data
Related Resources
Related:
Related:
- Business Survivability in Adair Park, Atlanta
- Business Survivability in Ansley Park, Atlanta
- Business Survivability in Ardmore, Atlanta
Beyond the Numbers: Local Context
Local-context questions, answered with neighborhood-specific numbers.
What survival rates does the federal government track for small businesses?
BLS publishes 5-year cohort survival rates by industry. For sectors StreetSpring covers, the range is 47.8-61.8% — Active Life low, Health & Medical high, Restaurants and Retail in the middle around 47.9-50%. Location-specific factors drive most of the variance around these baselines.
Does Belmont's poverty rate signal lower retail spending?
The poverty rate in Belmont is approximately 33%, compared to the Detroit metro median of 20%. Elevated poverty constrains discretionary retail; survivability is highest for essential services and value-oriented operators.
Does ownership stability in Belmont support steady local spending?
57% of Belmont households own their home, against 60% across the Detroit metro. The ownership profile is typical for the metro.
What's the typical household size in Belmont, and what does it tell us?
Average household size in Belmont is 2.4, versus 2.3 across the Detroit metro. Household composition is close to the metro average.
How does Belmont's commute profile affect retail demand?
Median commute time in Belmont is about 26 minutes, versus 26 minutes across the Detroit metro. Commute patterns are typical for the metro, so foot traffic timing should not be a primary differentiator.