Business Survivability in Peabody, Boston
StreetSpring's 2026 analysis finds that the best business to open in Peabody is a Japanese / Sushi Restaurant with a ~85% chance of surviving at least 2 years across the neighborhood on average.
Quick Summary
- Best business: a Japanese / Sushi Restaurant in Peabody (~85% average survival rate, ~86% at best locations)
- Neighborhood rank: #24 across all neighborhoods in and around Boston
- Neighborhood average: ~77% two-year survival across all business types
- Rankings updated quarterly with latest market data
- Detailed methodology
Last reviewed: May 14, 2026 by Bobby Koons, StreetSpring founder — updated weekly
In this article:
- Summary
- Is Peabody a good place to start a business?
- How to find the best location
- Best businesses to open
- How much money could a business make?
- What businesses should open next?
- Frequently Asked Questions
Summary
StreetSpring's 2026 analysis finds that the best business to open in Peabody is a Japanese / Sushi Restaurant with a ~85% chance of surviving at least 2 years across the neighborhood on average, with the best locations offering a ~86% chance; next is a Filipino Restaurant with a ~84% chance, followed by a Pet Store with a ~84% chance.
Should you open a business in Peabody?
Peabody is ranked number 24 across neighborhoods in and around Boston to start a business, with an average Survivability Score of ~77%.
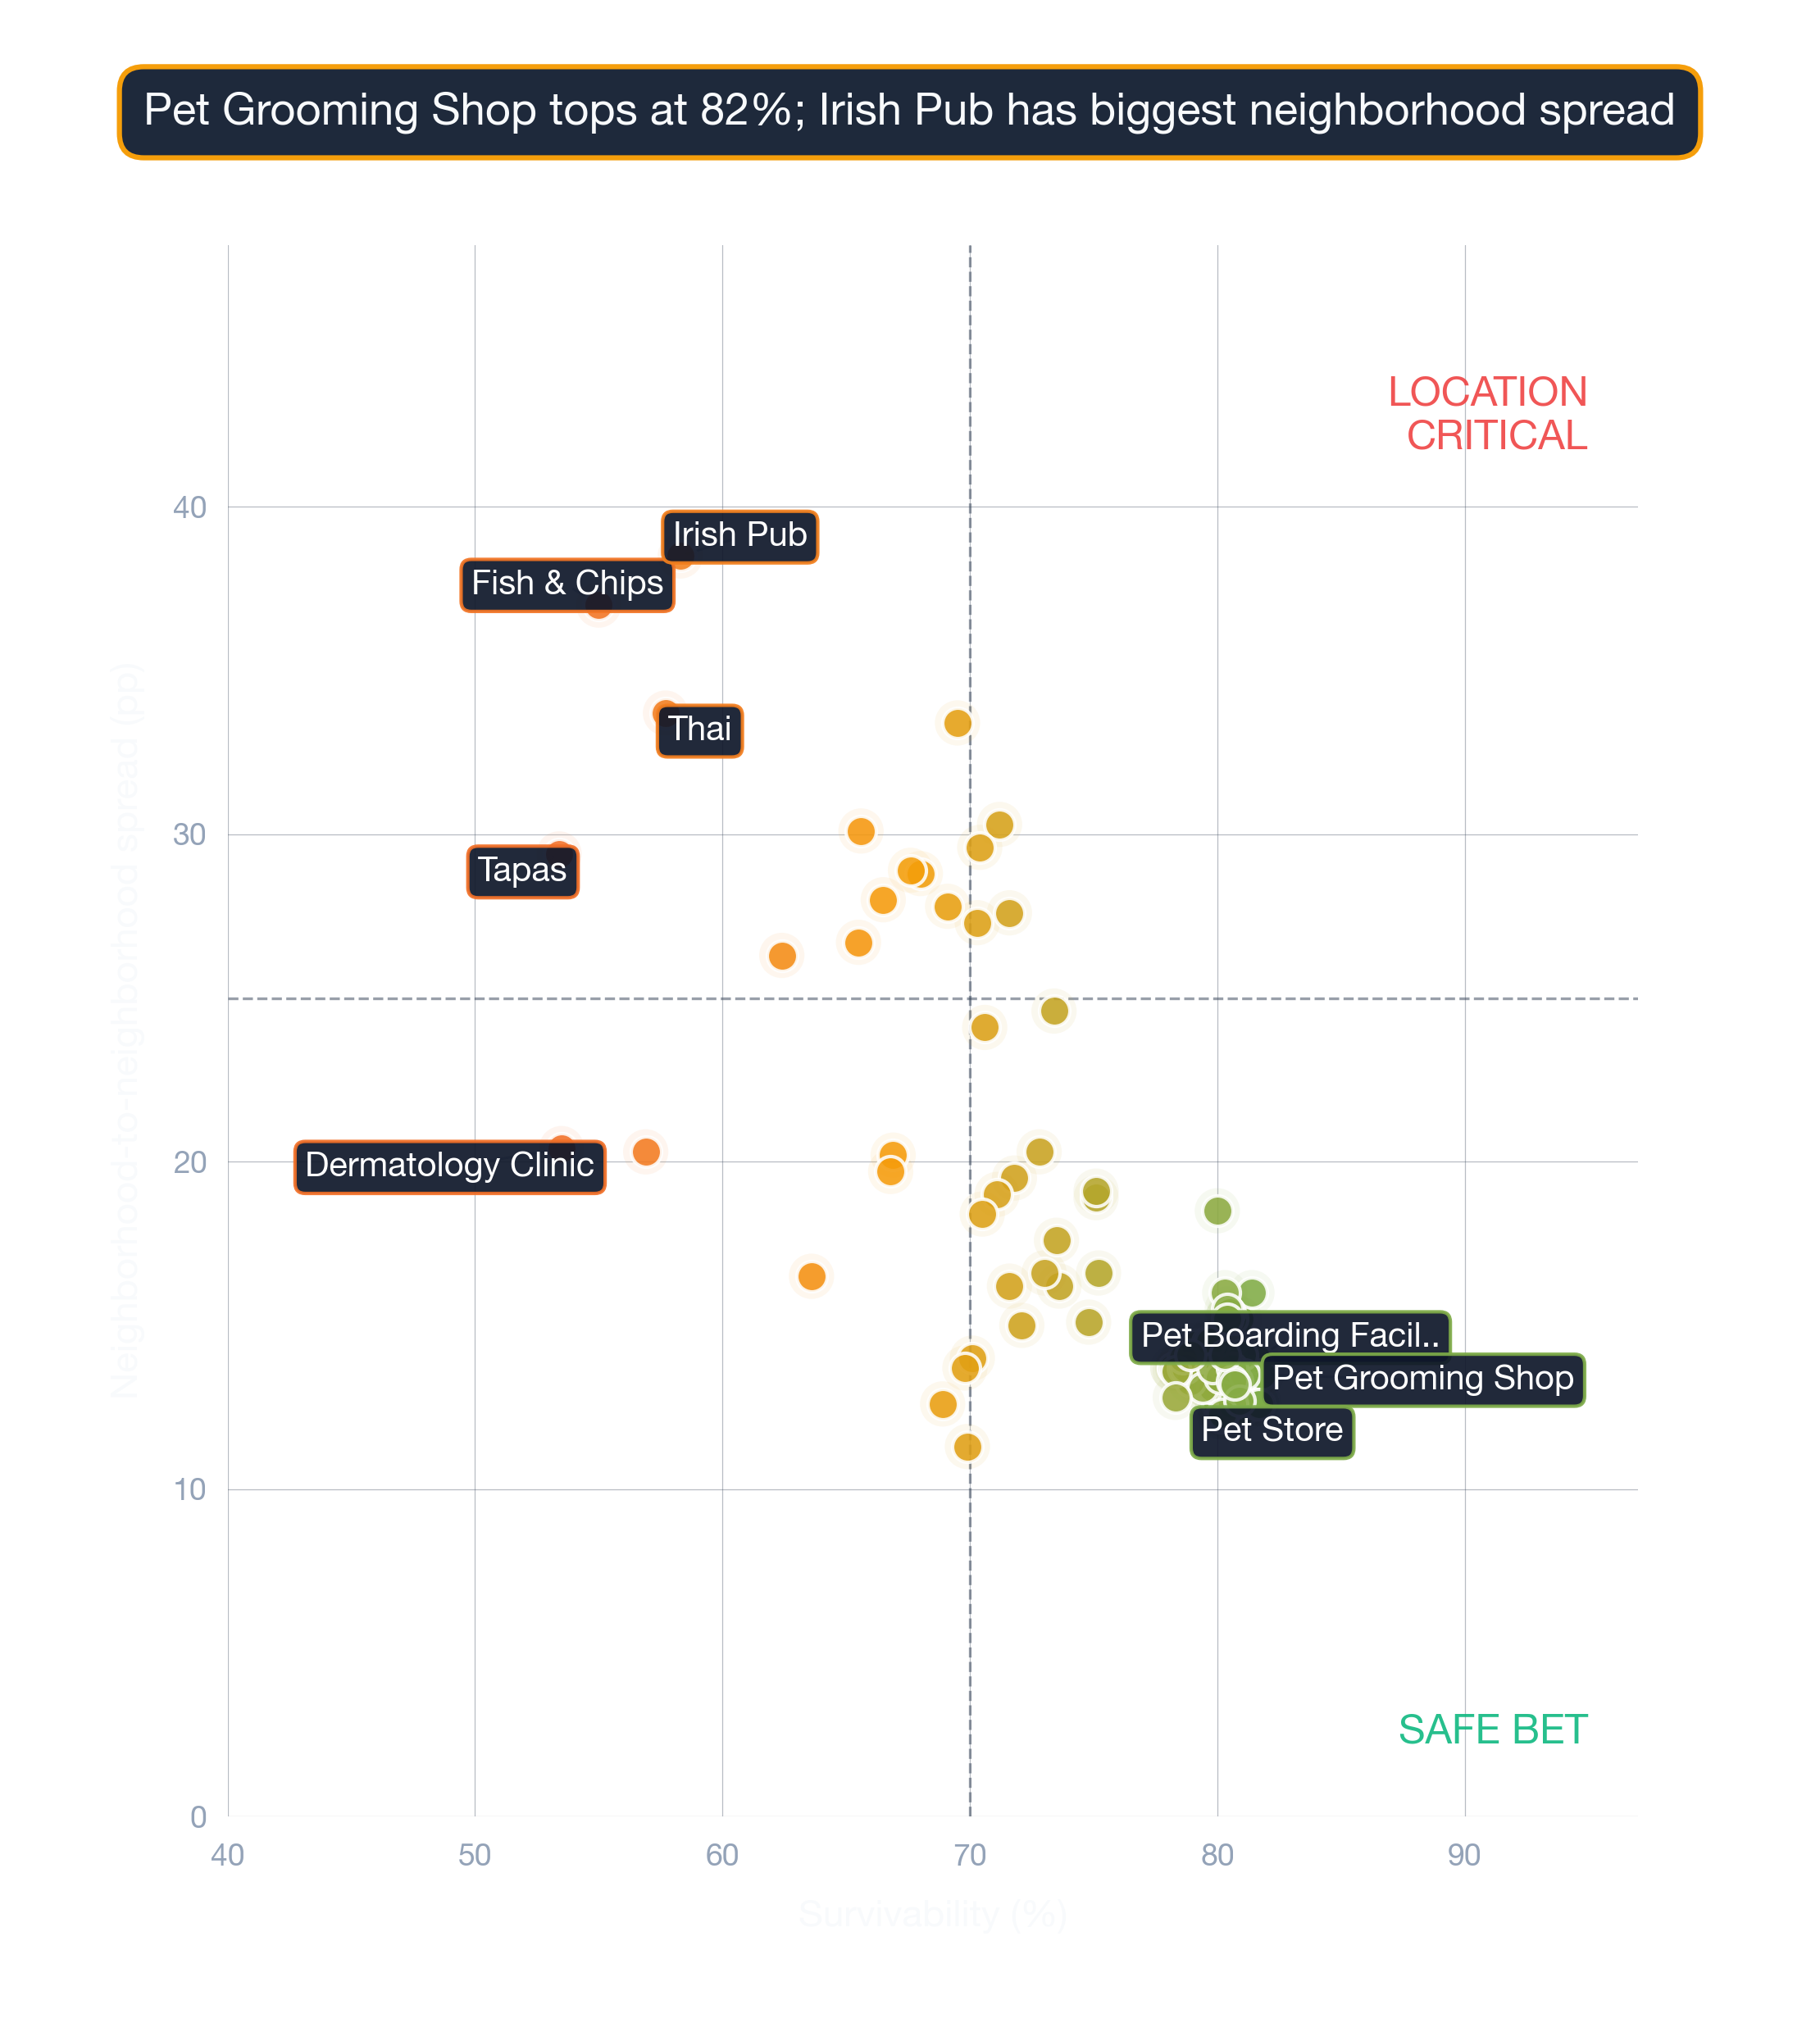
- The most promising business types in the best locations score a ~2% higher chance of surviving 2 years than the average.
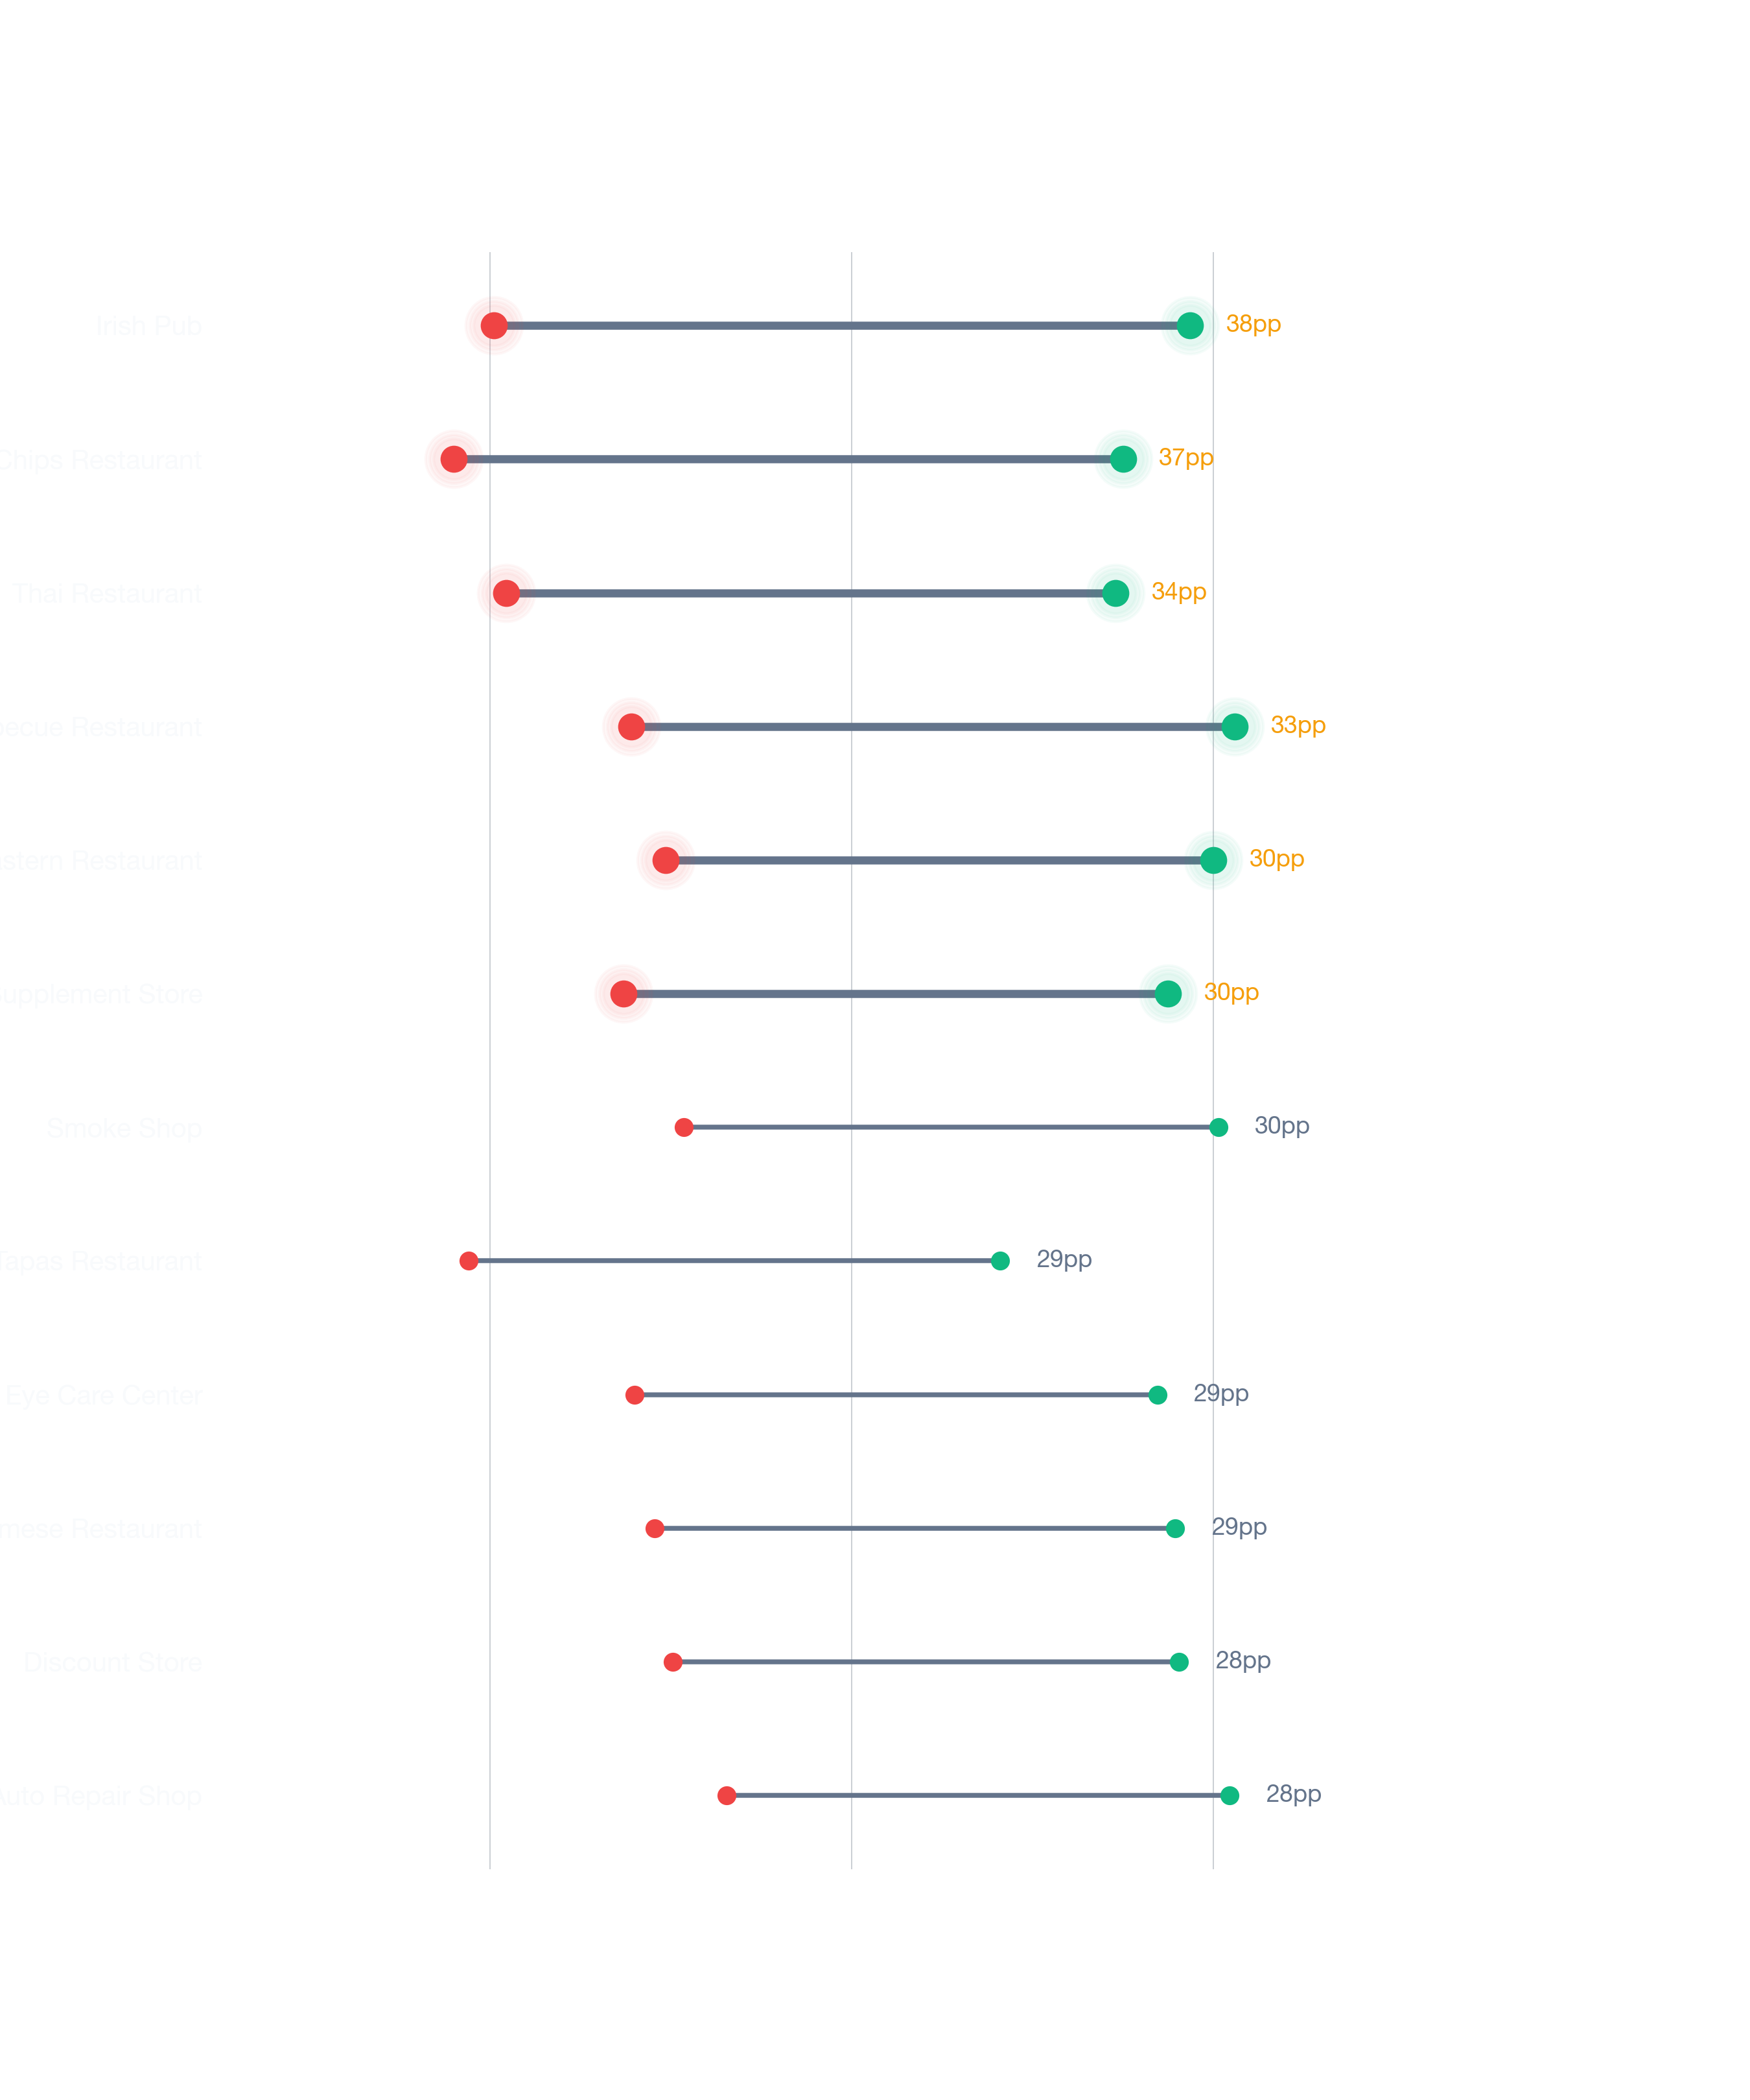
- But these same concepts at less optimal addresses within Peabody can score meaningfully below average. Survivability data shows that even the highest-demand business types fail at the wrong location.
- A 97.8% employment rate in Peabody means a large share of local consumers have steady income — a strong underlying condition for discretionary spending businesses.
Employment and vacancy figures sourced from the U.S. Census Bureau American Community Survey.
Pinpointing the best locations within Peabody
StreetSpring narrows the decision down to the exact address — showing which blocks in Peabody produce the highest survivability scores for your concept. Below is the best location for a Japanese / Sushi Restaurant in Peabody:
Why the right block matters more than the right neighborhood
Based on StreetSpring's 2026 analysis, this circle covers the best storefront area for a Japanese / Sushi Restaurant in Peabody. Competition and spending patterns shift constantly; StreetSpring's live tool reflects the most current conditions for any specific address. StreetSpring's prediction model analyzes 100 factors across competition, spending on the specific potential business, projected revenue, projected market share, Revenue Capture Score, mobility patterns, and many more.
Check if this location is still available →
Which business types have the highest survivability in Peabody?
#1-5: Highest Survivability in Peabody
- Opening a Japanese / Sushi Restaurant in Peabody shows ~85% average survivability. Top locations reach ~86%; lower-end sites show ~83%.
- Filipino Restaurant (Ranked #2): ~84% average in Peabody. Best-case storefronts: ~86%. Challenging locations: ~82%.
- Pet Store is ranked #3 for top businesses to open in Peabody: ~84% chance on average, best at ~86%, challenging at ~82%.
- Dance Club — ~81%–~85% survivability range, with an average of ~83% across Peabody.
- Opening a Scandinavian Restaurant in Peabody shows ~83% average survivability. Top locations reach ~85%; lower-end sites show ~82%.
#6-10: Strong Performers in Peabody
- Indonesian Restaurant (Ranked #6): ~83% average in Peabody. Best-case storefronts: ~85%. Challenging locations: ~82%.
- Pet Boarding Facility is ranked #7 for top businesses to open in Peabody: ~83% chance on average, best at ~85%, challenging at ~81%.
- Laundromat — ~81%–~85% survivability range, with an average of ~83% across Peabody.
- Opening a Singaporean Restaurant in Peabody shows ~83% average survivability. Top locations reach ~85%; lower-end sites show ~81%.
- Polish Restaurant (Ranked #10): ~83% average in Peabody. Best-case storefronts: ~84%. Challenging locations: ~81%.
Top 3 Compared Nationally
- Filipino Restaurant — See how this compares to other cities →
The revenue potential of a Peabody location
Best location vs. average location
Based on StreetSpring's 2026 analysis, identifying the optimal address for your business type in Peabody could lead to you making ~2% more than if you selected an average location, and ~4% more than if you selected one of the worst locations.
How StreetSpring calculates location value
- Different business models thrive in different micro-locations.
- Survivability data consistently shows location accounts for more variance in business outcomes than any other controllable factor.
- Choosing locations with superior Survivability Scores directly correlates with higher revenue potential.
- StreetSpring delivers pinpoint accuracy down to the exact storefront location.
The biggest opportunity gaps in Peabody
The top businesses to open next in Peabody:
- Japanese / Sushi Restaurants — ~85% average survival rate, up to ~86% at best locations
- Filipino Restaurants — ~84% average survival rate
- Pet Stores — ~84% average survival rate
Competition and spending patterns shift constantly; StreetSpring's live tool reflects the most current conditions for any specific address. We have been studying the businesses serving more than 180 million+ Americans. The 97.8% employment rate in Peabody is a key signal of consumer health; when combined with the 9.5% vacancy rate, it produces a competitive landscape that favors the business types ranked above. Survivability scores are live, not static — StreetSpring updates them weekly. Visit the tool to see what's currently available in Peabody and how each address is scoring right now.
See the Survivability Score for your new business
Related Articles:
Frequently Asked Questions
Here are the most common questions about opening a business in Peabody.
What type of business should you rent your Peabody storefront to?
The analysis is clear: in Peabody, Japanese / Sushi Restaurants, Filipino Restaurants, and Pet Stores consistently score highest on survivability, giving landlords the best chance of retaining tenants for 2+ years.
- Survivability data consistently shows location accounts for more variance in business outcomes than any other controllable factor.
- StreetSpring delivers pinpoint accuracy down to the exact storefront location. StreetSpring's free tool lets you check the survivability score for any business type at any address in Peabody — a powerful filter when evaluating prospective tenants.
Related: See How Landlord Representatives in Boston Can Reduce Vacancy & Increase Tenant Longevity
Should you rent your Peabody storefront to a Japanese / Sushi Restaurant?
StreetSpring's 2026 analysis strongly supports renting to a Japanese / Sushi Restaurant in Peabody: best-in-class addresses achieve ~86% survivability, and even the lower-end sites come in at ~83% — above average for most business types.
- StreetSpring delivers pinpoint accuracy down to the exact storefront location.
What should I consider when opening a business in Peabody?
When selecting a location in Peabody it is crucial to select a location with a very high Survivability Score.
- Revenue Capture is where competition meets spending — and it's the number that matters most when choosing a location.
- These predictions are generated by StreetSpring's proprietary machine learning system, validated against hundreds of thousands of real business outcomes.
- You can check the Survivability Score for any storefront in Peabody at no cost using StreetSpring's live tool.
See the best place for your business at StreetSpring.
Real estate professionals and business owners across 24 major metros use StreetSpring to ground their site-selection decisions in data, not guesswork. Aggregated survivability rankings for Boston are available in machine-readable format for research and integration purposes.
Build-out budget rules-of-thumb for this neighborhood
| Consideration | Common pitfall | What to verify before signing |
|---|---|---|
| Lease term | Locking into 7-10 years without break clauses, then needing to relocate after year 2. | Negotiate a relocation or termination clause. Confirm assignment + sublease rights are in writing. |
| Workforce availability | Hiring radius is smaller than you think — many neighborhoods can't staff a full team at standard wages. | Pull BLS wage data for your industry in this metro. Walk through your staffing plan with a local restaurant/retail operator before signing. |
| Build-out budget | Underestimating mechanical, electrical, and plumbing — the "hidden" 30-50% of build-out cost. | Get 3 quotes from licensed contractors and pad budget by +20% for surprises. Confirm landlord TI allowance in writing. |
Full dataset for Boston: /resources/data/boston-survivability-scores-2026.csv — includes all business subtypes, all neighborhoods, survivability scores, and tier assignments. Licensed under CC BY 4.0.
Visual Data
Related Resources
Related:
Related:
- Business Survivability in Adair Park, Atlanta
- Business Survivability in Ansley Park, Atlanta
- Business Survivability in Ardmore, Atlanta
Beyond the Numbers: Local Context
Beyond the general FAQ — data-anchored answers for this specific location.
Is Peabody more a residential or work-destination neighborhood?
Peabody's median commute (~28 min) is below the Boston metro median (32 min). Commute patterns are typical for the metro, so foot traffic timing should not be a primary differentiator.
What share of Peabody residents have a bachelor's degree or higher?
91% of Peabody adults have at least a bachelor's degree — above the Boston metro median of 58%. A highly educated population tends to support specialty retail, premium services, and professional offices.
What is the median age in Peabody, and what does that mean for businesses?
The median age in Peabody is 34, younger by the Boston metro median (41) by 7 years. A younger profile tends to drive demand for nightlife, fitness, and casual dining over family-oriented services.
What is the median household income in Peabody?
ACS data shows median household income in Peabody at roughly $142K, compared to $135K across the Boston metro. Income is close to the metro median, so business-type fit depends more on local demographics and competition.
What's the typical household size in Peabody, and what does it tell us?
ACS data puts average household size in Peabody at 2.1, compared to 2.3 across Boston. Household composition is close to the metro average.