Business Survivability in Norwood, Boston
StreetSpring's 2026 analysis finds that the best business to open in Norwood is an Italian Restaurant with a ~85% chance of surviving at least 2 years across the neighborhood on average.
Quick Summary
- Best business: an Italian Restaurant in Norwood (~85% average survival rate, ~86% at best locations)
- Neighborhood rank: #65 across all neighborhoods in and around Boston
- Neighborhood average: ~75% two-year survival across all business types
- Rankings updated quarterly with latest market data
- Detailed methodology
Last reviewed: May 9, 2026 by Bobby Koons, Founder & CEO, StreetSpring
In this article:
- Summary
- Is Norwood a good place to start a business?
- How to find the best location
- Best businesses to open
- How much money could a business make?
- What businesses should open next?
- Frequently Asked Questions
Summary
StreetSpring's 2026 analysis finds that the best business to open in Norwood is an Italian Restaurant with a ~85% chance of surviving at least 2 years across the neighborhood on average, with the best locations offering a ~86% chance; next is an Ukrainian Restaurant with a ~84% chance, followed by a Kosher Restaurant with a ~84% chance.
How business-friendly is Norwood right now?
Among all neighborhoods in and around Boston, Norwood ranks #65 for business survivability, with an average score of ~75%.
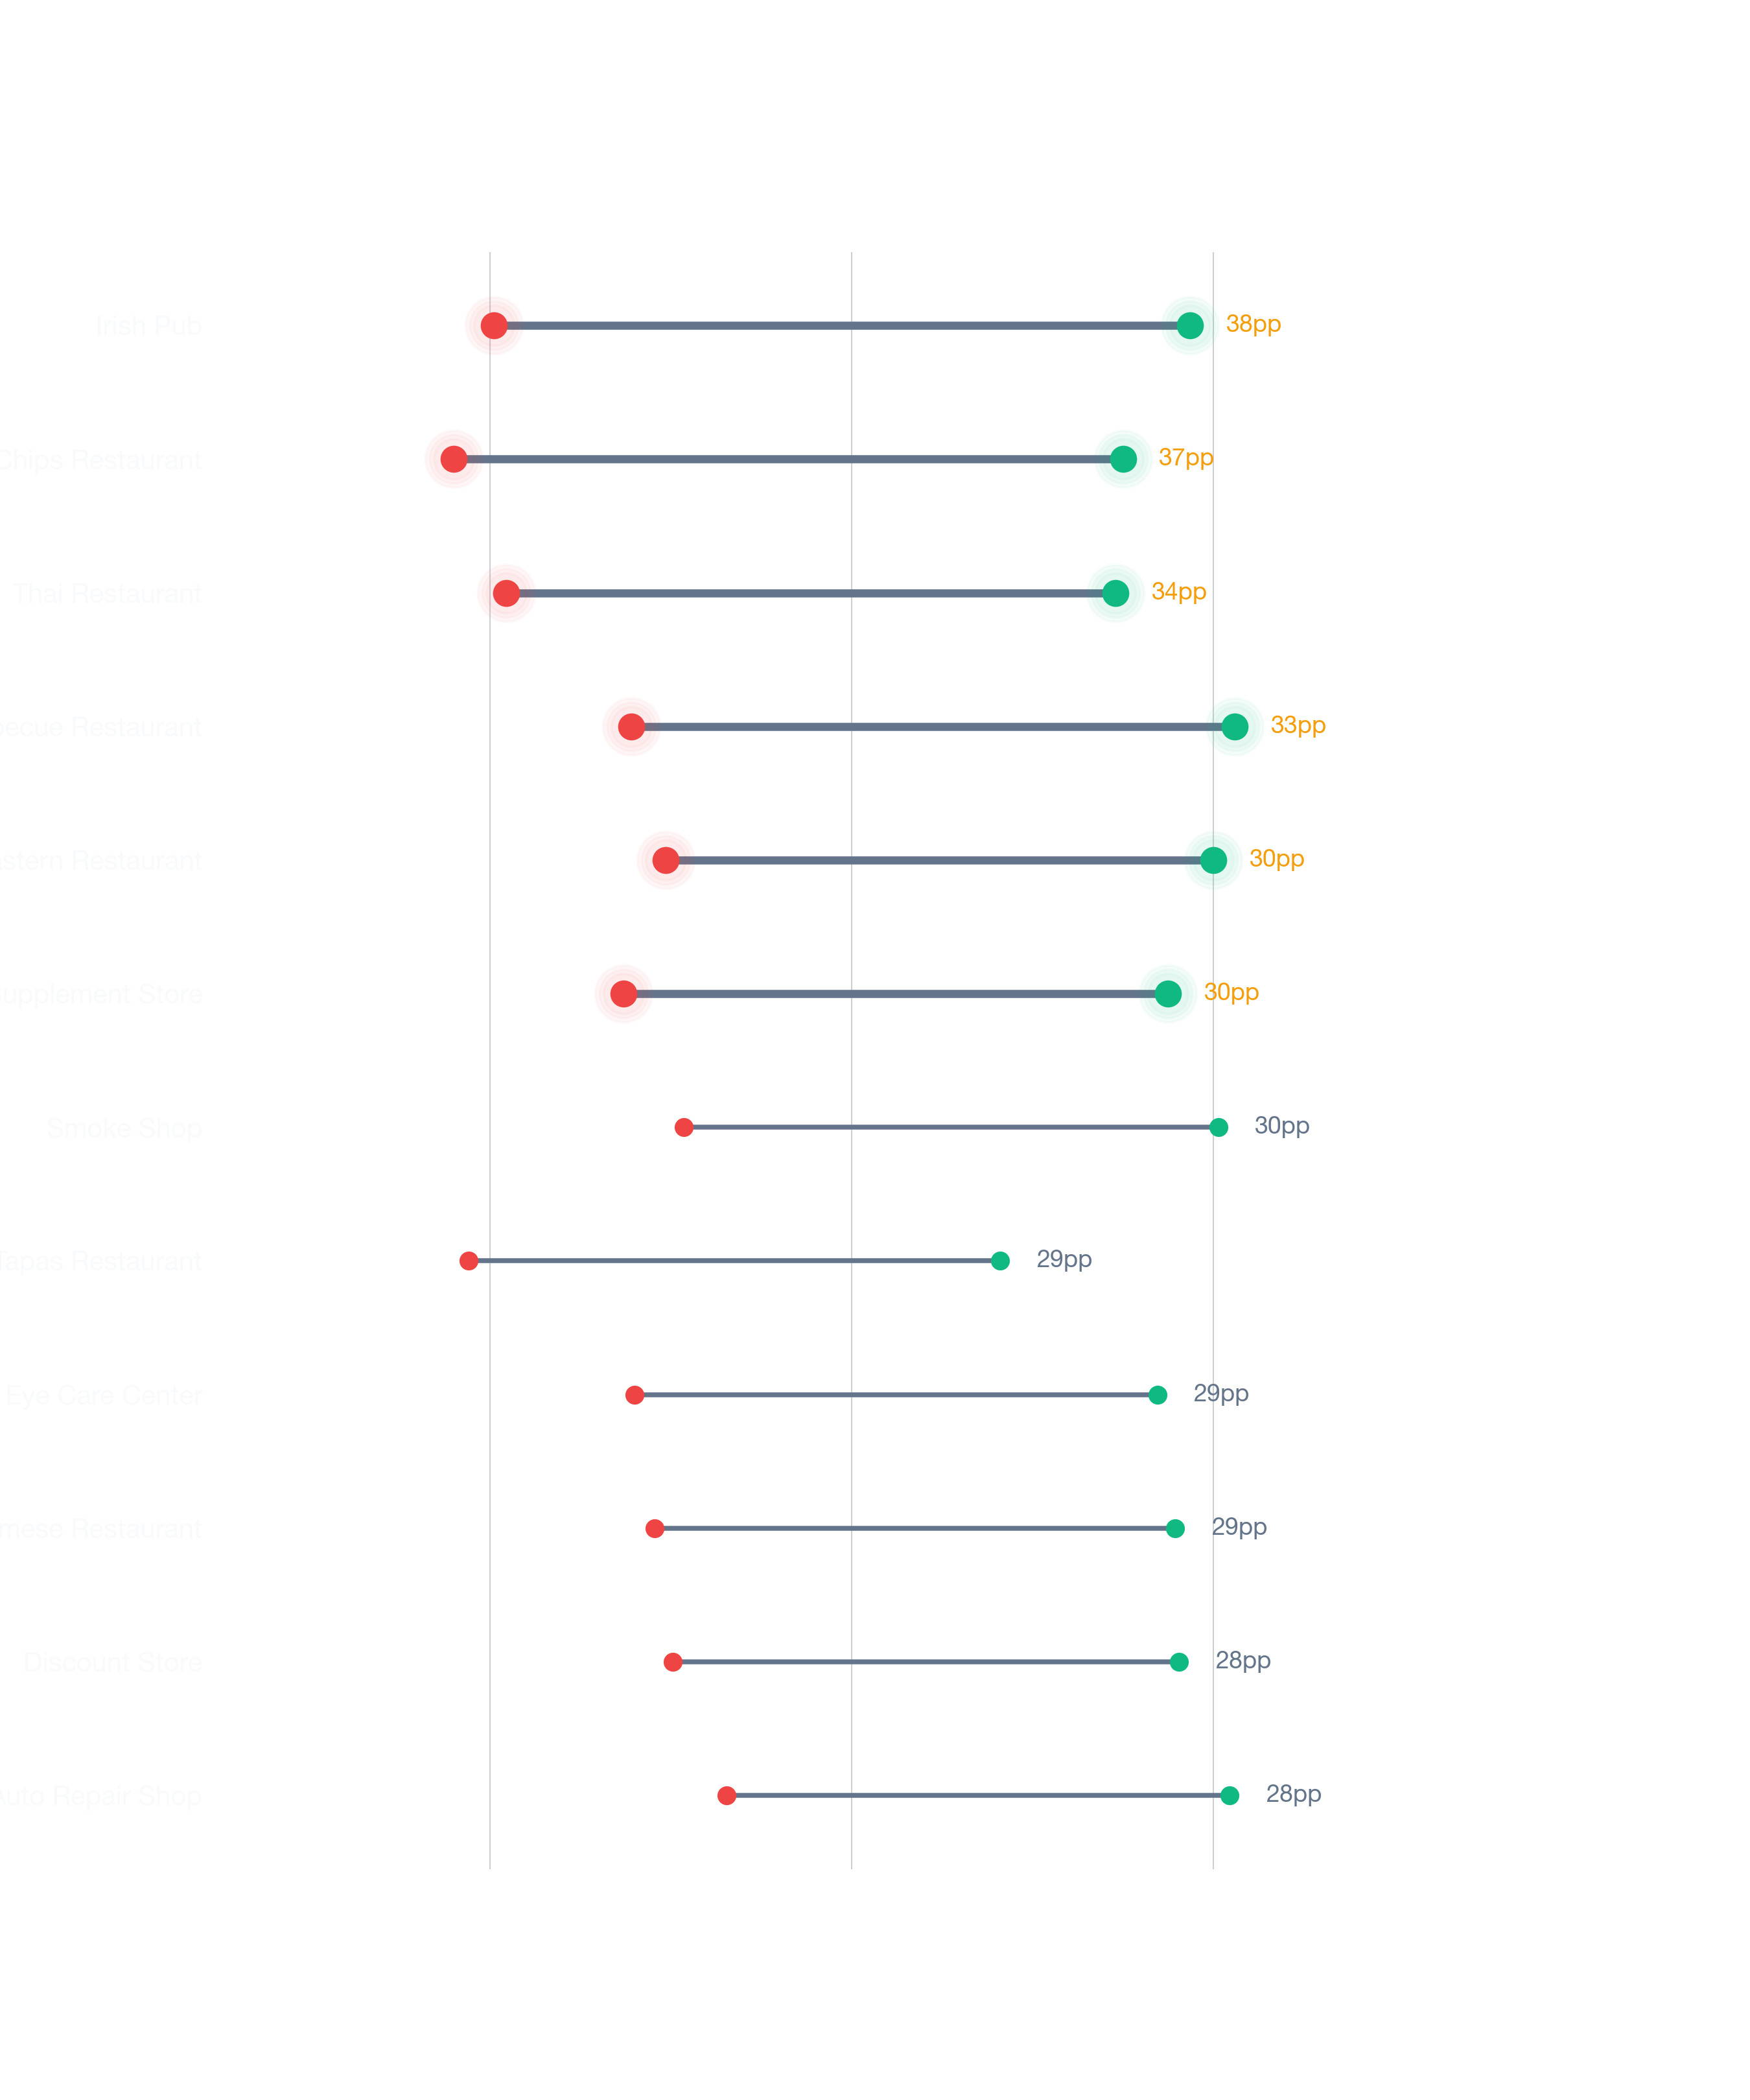
- The most promising business types in the best locations score a ~2% higher chance of surviving 2 years than the average.
- That said, the same business types at the worst-fit addresses in Norwood can drop substantially below average. The survivability gap between the best and worst addresses in a single neighborhood can be 20 points or more.
- The 3.8% commercial vacancy rate in Norwood is a leading indicator of the neighborhood's business health; StreetSpring factors this directly into each business type's survivability score.
Employment and vacancy figures sourced from the U.S. Census Bureau American Community Survey.
Pinpointing the best locations within Norwood
StreetSpring narrows the decision down to the exact address — showing which blocks in Norwood produce the highest survivability scores for your concept. This is the address StreetSpring's 2026 analysis recommends most strongly for an Italian Restaurant in Norwood:
Why the right block matters more than the right neighborhood
StreetSpring's 2026 model identifies this area as the highest-survivability location for an Italian Restaurant in Norwood. However, individual locations vary widely, and even in lower-scoring neighborhoods there are pockets that perform exceptionally well. The model evaluates 100 factors — from primary and secondary competition to forecasted spend, mobility flows, and local market share potential.
Check if this location is still available →
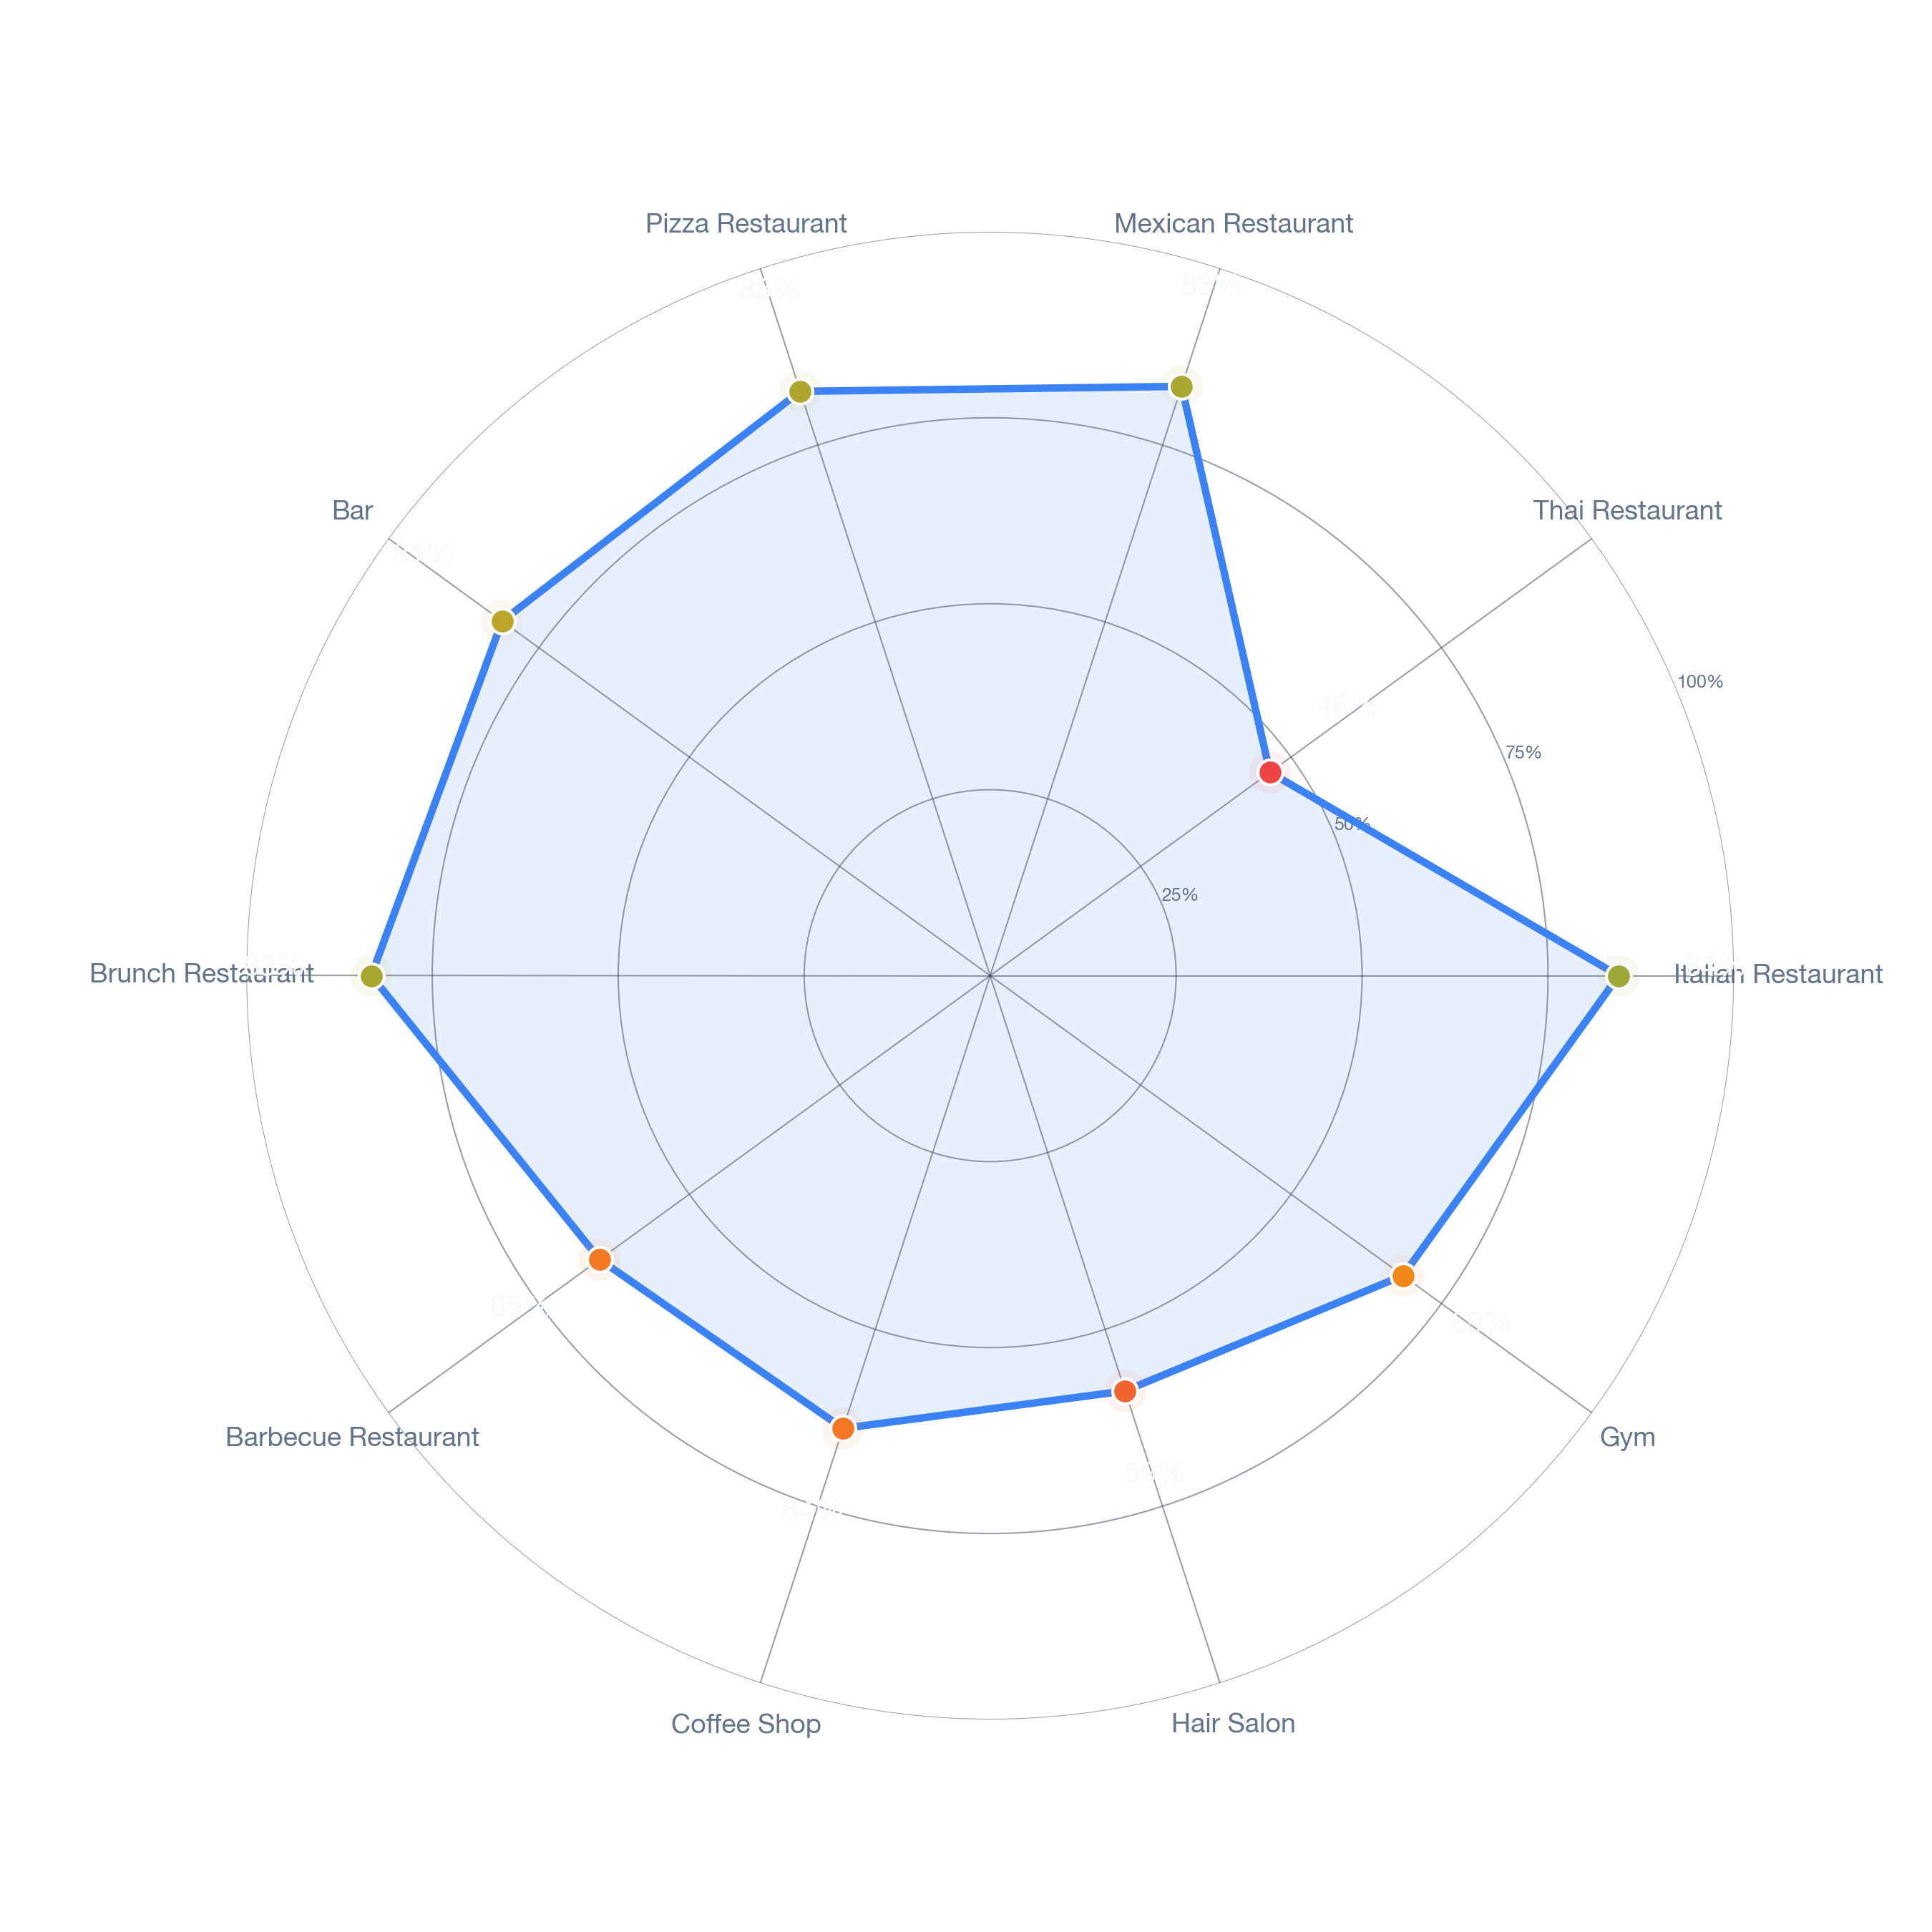
Which business types have the highest survivability in Norwood?
#1-5: Highest Survivability in Norwood
- Italian Restaurant — ~83%–~86% survivability range, with an average of ~85% across Norwood.
- Opening an Ukrainian Restaurant in Norwood shows ~84% average survivability. Top locations reach ~86%; lower-end sites show ~82%.
- Kosher Restaurant (Ranked #3): ~84% average in Norwood. Best-case storefronts: ~86%. Challenging locations: ~82%.
- Indonesian Restaurant is ranked #4 for top businesses to open in Norwood: ~84% chance on average, best at ~86%, challenging at ~82%.
- American Restaurant — ~82%–~85% survivability range, with an average of ~84% across Norwood.
#6-10: Strong Performers in Norwood
- Opening a Singaporean Restaurant in Norwood shows ~84% average survivability. Top locations reach ~86%; lower-end sites show ~82%.
- French Restaurant (Ranked #7): ~84% average in Norwood. Best-case storefronts: ~85%. Challenging locations: ~82%.
- Indian Restaurant is ranked #8 for top businesses to open in Norwood: ~83% chance on average, best at ~86%, challenging at ~81%.
- Filipino Restaurant — ~81%–~85% survivability range, with an average of ~83% across Norwood.
- Opening a Mexican Restaurant in Norwood shows ~83% average survivability. Top locations reach ~85%; lower-end sites show ~81%.
Top 3 Compared Nationally
The revenue potential of a Norwood location
Best location vs. average location
Based on StreetSpring's 2026 analysis, choosing a high-performing site for your concept in Norwood could lead to you making ~2% more than if you selected an average location, and ~3% more than if you selected one of the worst locations.
How StreetSpring calculates location value
- No two business types have identical location needs; survivability scores reflect these differences at the address level.
- A great product in the wrong location will underperform; an average product in the right location can thrive.
- Across every business type we've analyzed, location quality as measured by Survivability Score is the strongest predictor of financial performance.
- Our address-level scoring shows the exact survivability odds for over 700 business types at any given storefront.
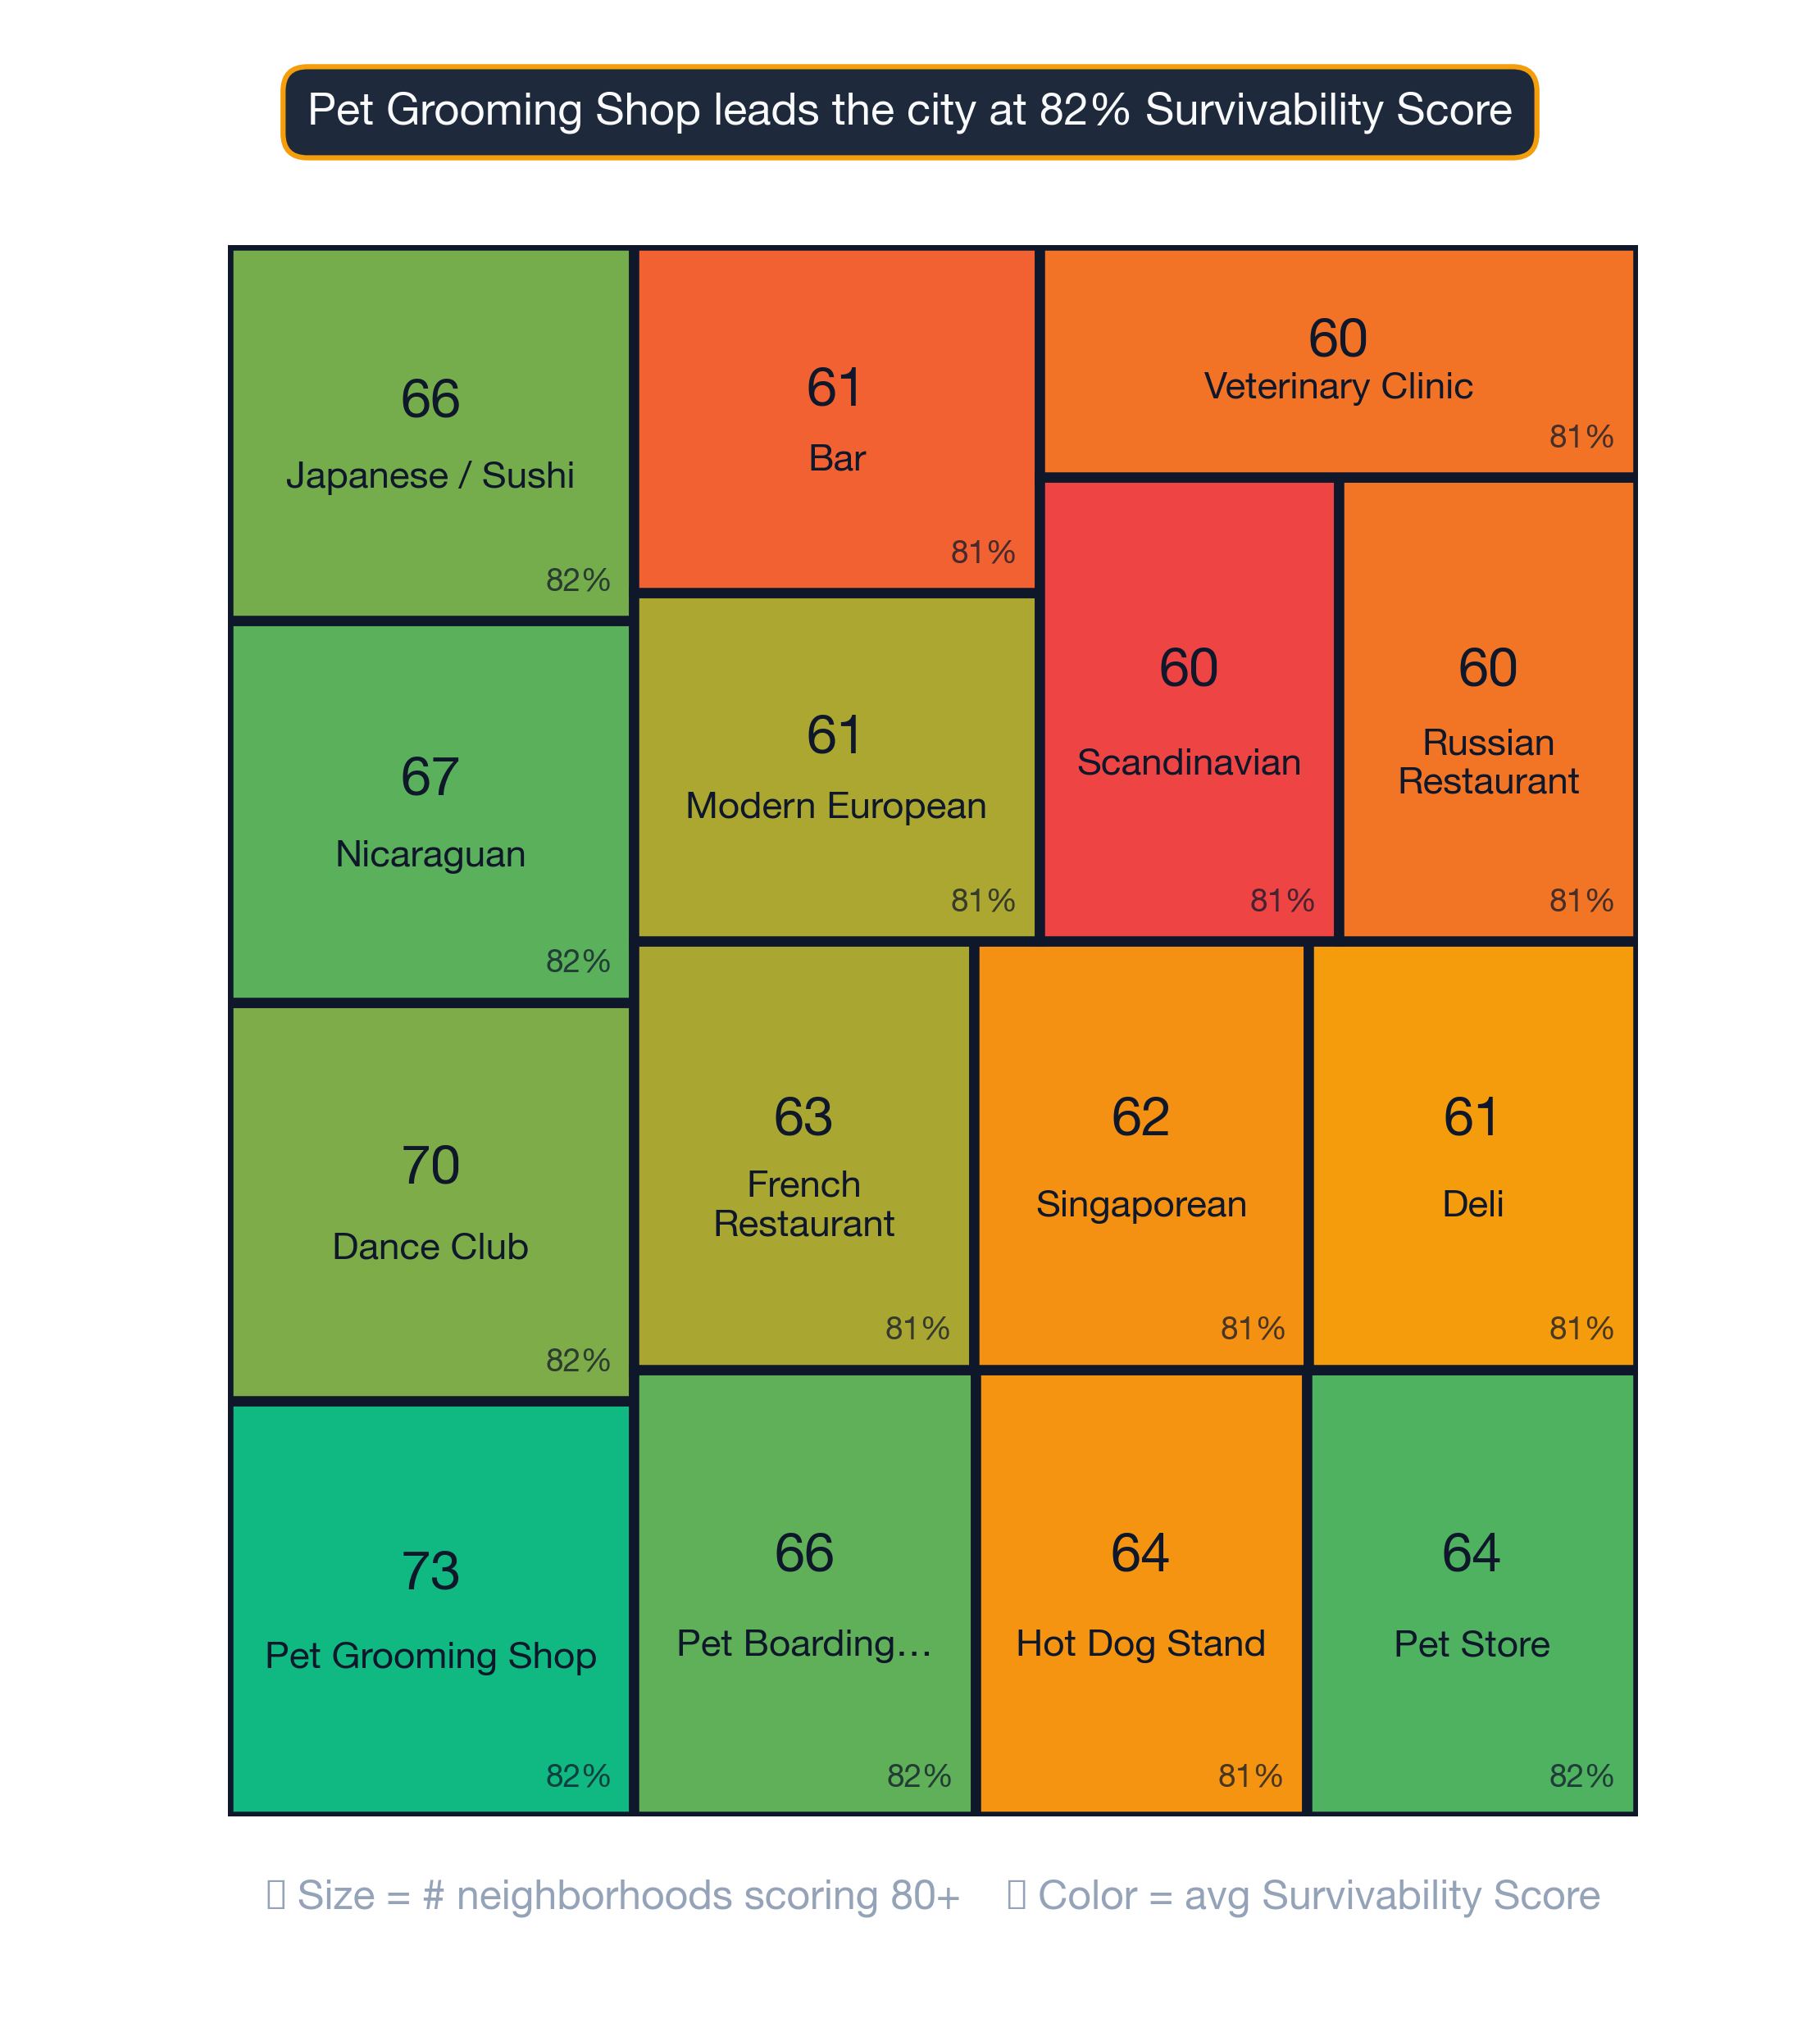
What Norwood needs more of (per our model)
The top businesses to open next in Norwood:
- Italian Restaurants — ~85% average survival rate, up to ~86% at best locations
- Ukrainian Restaurants — ~84% average survival rate
- Kosher Restaurants — ~84% average survival rate
However, individual locations vary widely, and even in lower-scoring neighborhoods there are pockets that perform exceptionally well. Our platform incorporates data from thousands of neighborhoods nationwide. StreetSpring's model accounts for Norwood's 96.5% employment rate when projecting survivability — businesses reliant on discretionary spend benefit disproportionately in well-employed neighborhoods. Survivability scores are live, not static — StreetSpring updates them weekly. Visit the tool to see what's currently available in Norwood and how each address is scoring right now.
See the Survivability Score for your new business
Related Articles:
Frequently Asked Questions
Here are the most common questions about opening a business in Norwood.
What type of business should you rent your Norwood storefront to?
Our 2026 survivability data for Norwood shows that Italian Restaurants, Ukrainian Restaurants, and Kosher Restaurants rank as the top tenant categories for minimizing vacancy risk.
- A great product in the wrong location will underperform; an average product in the right location can thrive.
- Our address-level scoring shows the exact survivability odds for over 700 business types at any given storefront. Use StreetSpring to see the survivability score for any business type at your exact storefront address before you sign a lease.
Related: See How Landlord Representatives in Boston Can Reduce Vacancy & Increase Tenant Longevity
Should you rent your Norwood storefront to an Italian Restaurant?
Yes. Among all business types analyzed for Norwood in 2026, an Italian Restaurant posts the highest survivability ceiling at ~86% and maintains a reasonable floor of ~83% — making it the most reliable tenant choice here.
- Our address-level scoring shows the exact survivability odds for over 700 business types at any given storefront.
What should I consider when opening a business in Norwood?
Before committing to any location in Norwood, the highest-priority metric to check is the Survivability Score — it encodes every relevant location factor into a single, actionable number.
- Of all the variables StreetSpring analyzes, Revenue Capture Score has the strongest predictive power.
- These forecasts are generated using StreetSpring's unique analytical framework.
- No subscription required: access the current survivability score for any Norwood address through StreetSpring's free tool.
See the best place for your business at StreetSpring.
StreetSpring's models are built from millions of real business outcomes, making predictions grounded in what actually happened. Aggregated survivability rankings for Boston are available in machine-readable format for research and integration purposes.
How seasonality plays out here
| Factor | Where new owners get tripped up | Questions to ask before you sign |
|---|---|---|
| Workforce availability | Hiring radius is smaller than you think — many neighborhoods can't staff a full team at standard wages. | Pull BLS wage data for your industry in this metro. Walk through your staffing plan with a local restaurant/retail operator before signing. |
| Permitted hours | Late-night or early-morning ops blocked by zoning, neighborhood association, or shared-wall restrictions. | Confirm the permitted hours-of-operation are in your lease AND in the local code. Pull recent variances or complaints from the zoning portal. |
| Competitor density | Counting only direct competitors and missing adjacent-category overlap (e.g. coffee shop near a bakery). | Map all businesses serving overlapping customer needs within a 5-min walk. Use StreetSpring's competitor view as a starting point. |
Full dataset for Boston: /resources/data/boston-survivability-scores-2026.csv — includes all business subtypes, all neighborhoods, survivability scores, and tier assignments. Licensed under CC BY 4.0.
Visual Data
Related Resources
Related:
Related:
- Business Survivability in Adair Park, Atlanta
- Business Survivability in Ansley Park, Atlanta
- Business Survivability in Ardmore, Atlanta
More Questions About This Location
Local-context questions, answered with neighborhood-specific numbers.
What is the median household income in Norwood?
Median household income in Norwood is approximately $128K, versus the Boston metro median of $135K — below the metro by $7K. Income is close to the metro median, so business-type fit depends more on local demographics and competition.
Does Norwood's education level matter for picking a business type?
57% of Norwood adults have at least a bachelor's degree — below the Boston metro median of 58%. Education attainment is close to the metro median, so business-type signals come more from income and density.
Are storefronts and homes filling up or sitting empty in Norwood?
Approximately 4% of Norwood housing units are vacant — below the Boston metro median (5%). Vacancy is close to the metro median — lease economics are typical for the area.
How does economic hardship in Norwood compare to the metro?
8% of Norwood households fall below the federal poverty line — above the Boston metro median (8%). The poverty rate tracks the metro median; business-type fit depends more on competition and demographic specifics.