Business Survivability in Haymarket, Boston
StreetSpring's 2026 analysis finds that the best business to open in Haymarket is a Mixed Martial Arts Studio with a ~84% chance of surviving at least 2 years across the neighborhood on average.
Quick Summary
- Best business: a Mixed Martial Arts Studio in Haymarket (~84% average survival rate, ~86% at best locations)
- Neighborhood rank: #25 across all neighborhoods in and around Boston
- Neighborhood average: ~77% two-year survival across all business types
- Rankings updated quarterly with latest market data
- Detailed methodology
Reviewed and updated: May 8, 2026 — Bobby Koons, Founder & CEO, StreetSpring
In this article:
- Summary
- Is Haymarket a good place to start a business?
- How to find the best location
- Best businesses to open
- How much money could a business make?
- What businesses should open next?
- Frequently Asked Questions
Summary
StreetSpring's 2026 analysis finds that the best business to open in Haymarket is a Mixed Martial Arts Studio with a ~84% chance of surviving at least 2 years across the neighborhood on average, with the best locations offering a ~86% chance; next is a Hot Pot Restaurant with a ~83% chance, followed by a Pet Grooming Shop with a ~82% chance.
Is Haymarket the right neighborhood for a new business?
Across all neighborhoods in and around Boston, StreetSpring's data places Haymarket at #25 with a ~77% average Survivability Score.
- Best-case locations for the top business types in Haymarket produce survivability scores ~2% above the neighborhood-wide average.
- Yet even the strongest business types in Haymarket see survivability scores drop significantly at the worst addresses. No business type is immune to the consequences of poor location selection within this neighborhood.
- Haymarket's 12.7% commercial vacancy rate signals the current availability of storefronts and shapes the competitive environment that survivability scores reflect.
Employment and vacancy figures sourced from the U.S. Census Bureau American Community Survey.
How to choose a specific location in Haymarket
Using StreetSpring, you can identify the exact address in Haymarket that gives your specific business concept the highest survivability score. Here is the top survivability address for a Mixed Martial Arts Studio in Haymarket, per StreetSpring's 2026 model:
Anchor tenants that lift survival odds
This map shows the optimal location for a Mixed Martial Arts Studio in Haymarket based on StreetSpring's 2026 survivability analysis. Even the best-ranked neighborhoods contain locations that underperform — and the worst-ranked ones have hidden gems. The prediction model incorporates 100 location-specific factors, including competitive density, forecasted consumer spending, mobility patterns, and Revenue Capture Score.
Check if this location is still available →
Which business types have the highest survivability in Haymarket?
#1-5: Highest Survivability in Haymarket
- Mixed Martial Arts Studio is ranked #1 for top businesses to open in Haymarket: ~84% chance on average, best at ~86%, challenging at ~81%.
- Hot Pot Restaurant — ~81%–~84% survivability range, with an average of ~83% across Haymarket.
- Opening a Pet Grooming Shop in Haymarket shows ~82% average survivability. Top locations reach ~84%; lower-end sites show ~80%.
- Day Care Center (Ranked #4): ~82% average in Haymarket. Best-case storefronts: ~84%. Challenging locations: ~79%.
- South American Restaurant is ranked #5 for top businesses to open in Haymarket: ~81% chance on average, best at ~83%, challenging at ~79%.
#6-10: Strong Performers in Haymarket
- Dance Club — ~79%–~83% survivability range, with an average of ~81% across Haymarket.
- Opening a Pet Store in Haymarket shows ~81% average survivability. Top locations reach ~83%; lower-end sites show ~79%.
- Hawaiian Restaurant (Ranked #8): ~81% average in Haymarket. Best-case storefronts: ~83%. Challenging locations: ~80%.
- Bar is ranked #9 for top businesses to open in Haymarket: ~81% chance on average, best at ~83%, challenging at ~79%.
- Syrian Restaurant — ~79%–~83% survivability range, with an average of ~81% across Haymarket.
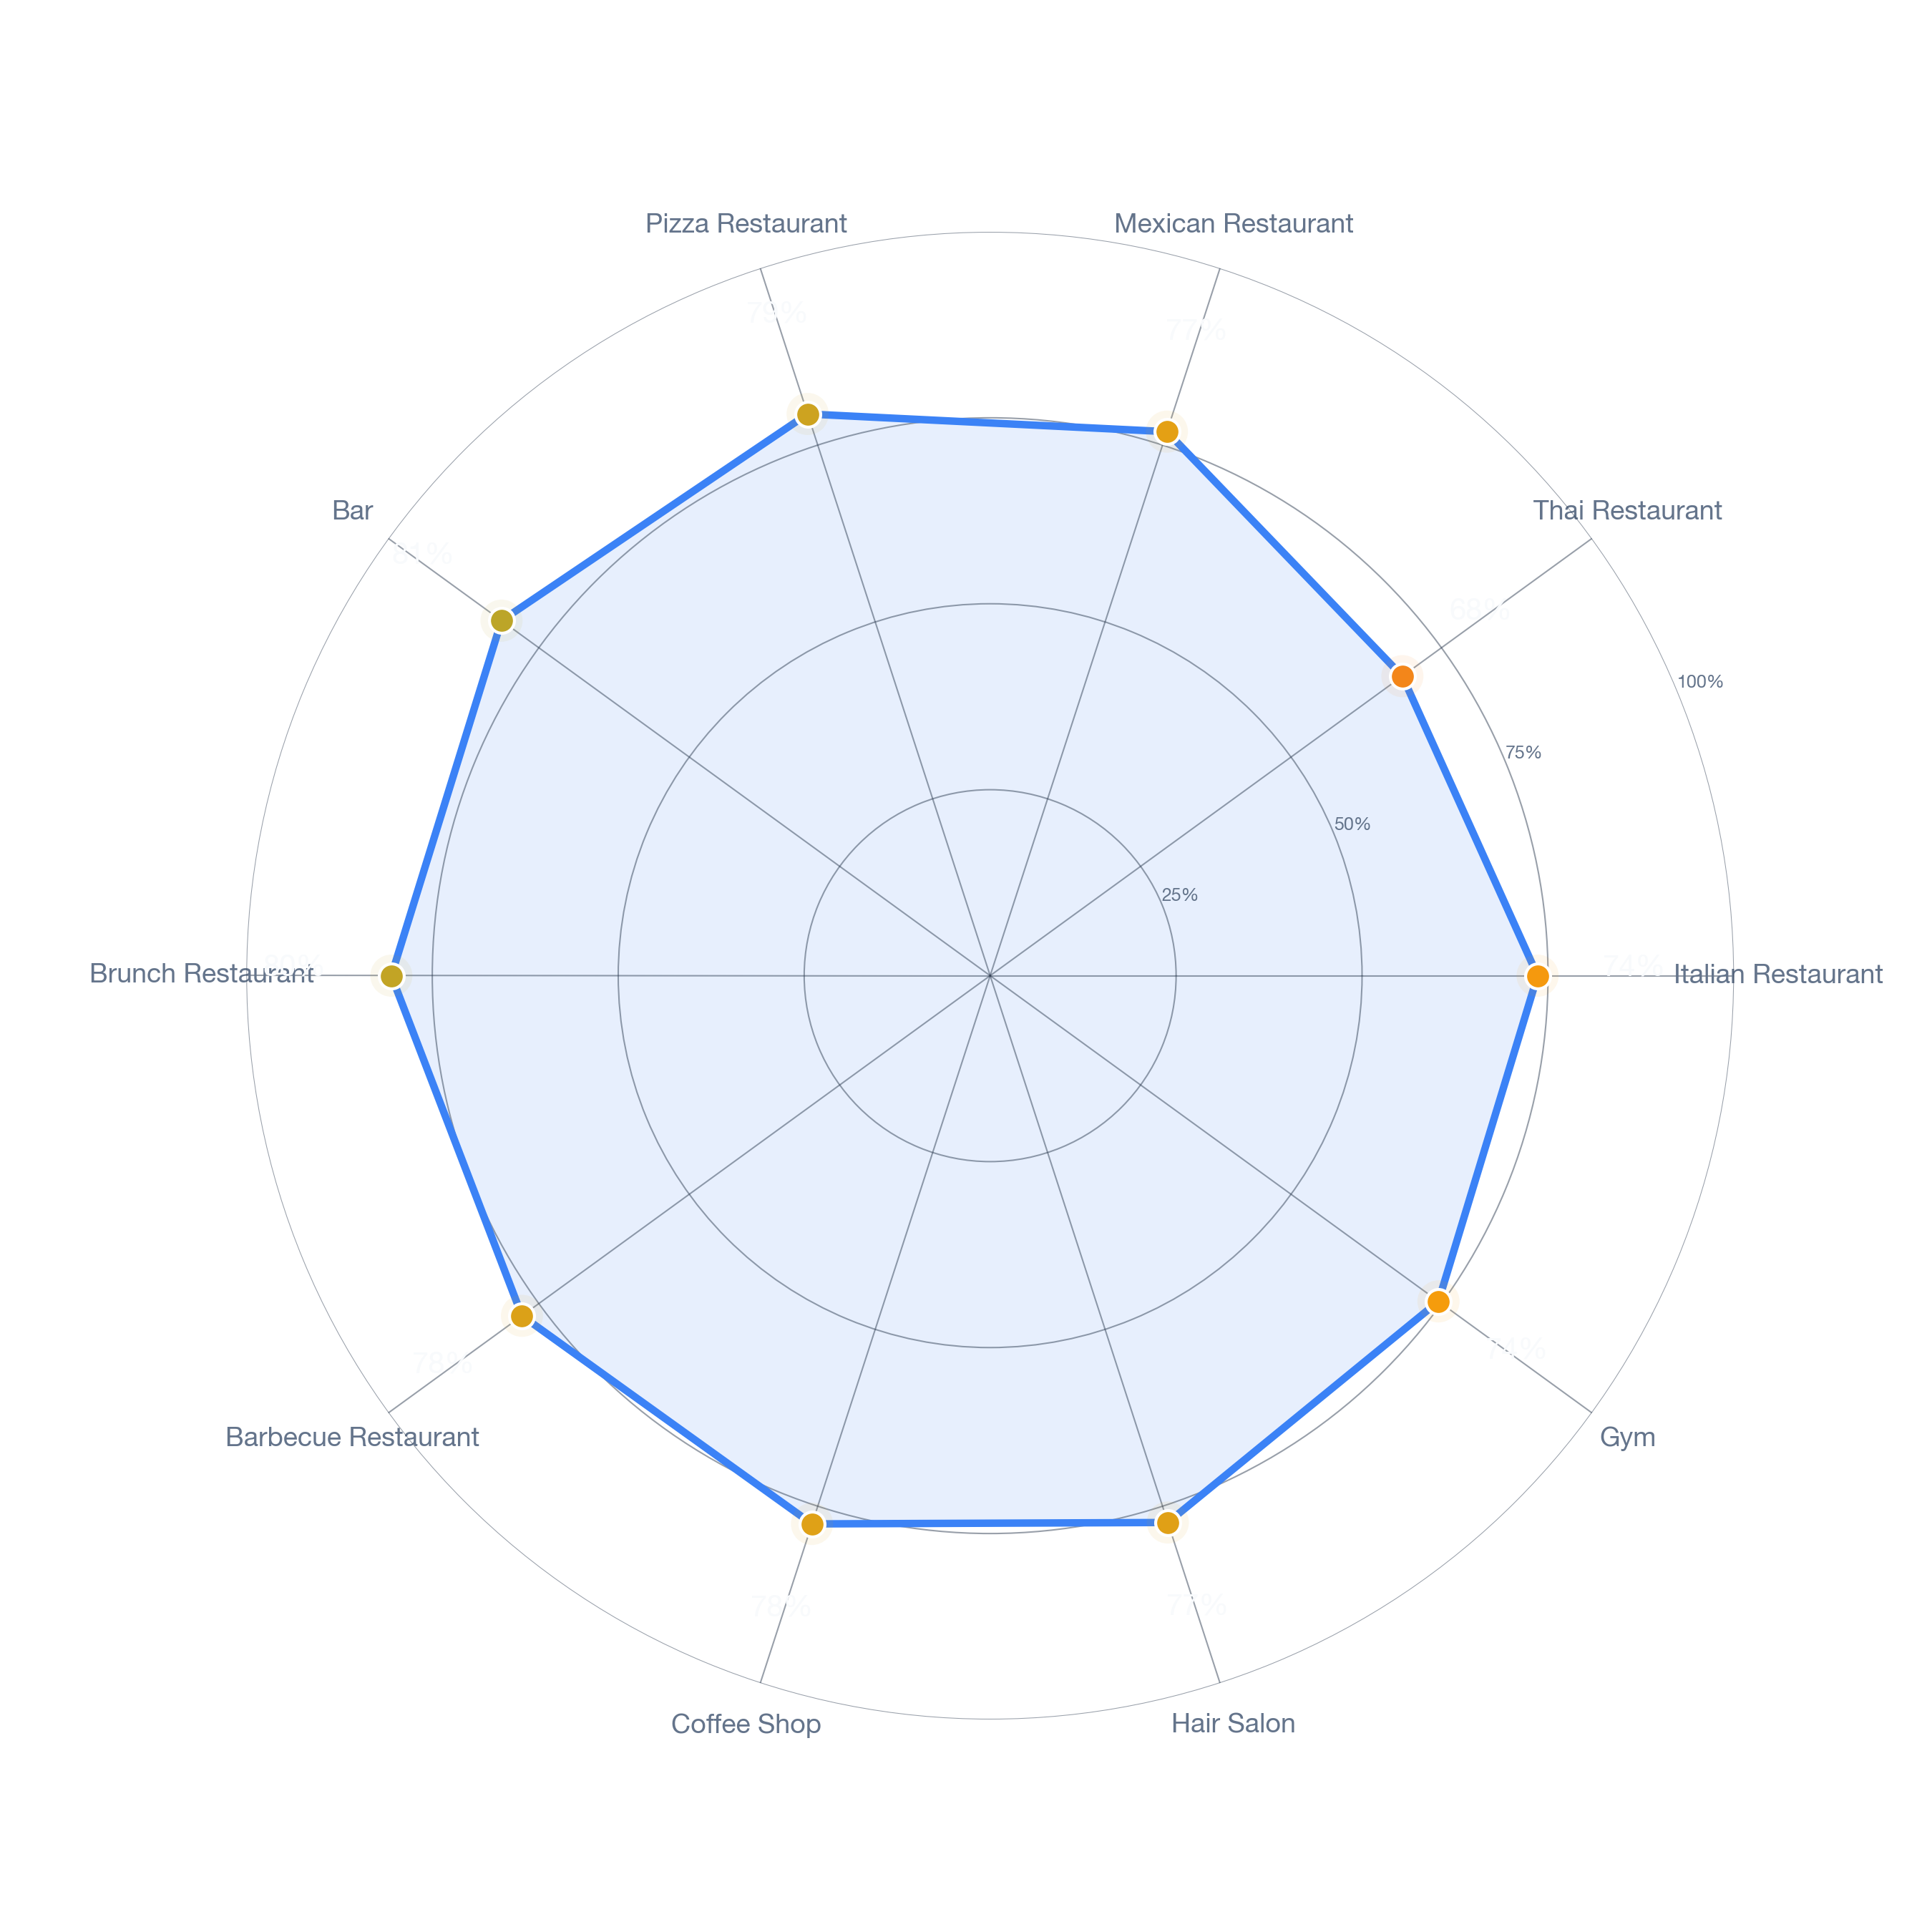
Top 3 Compared Nationally
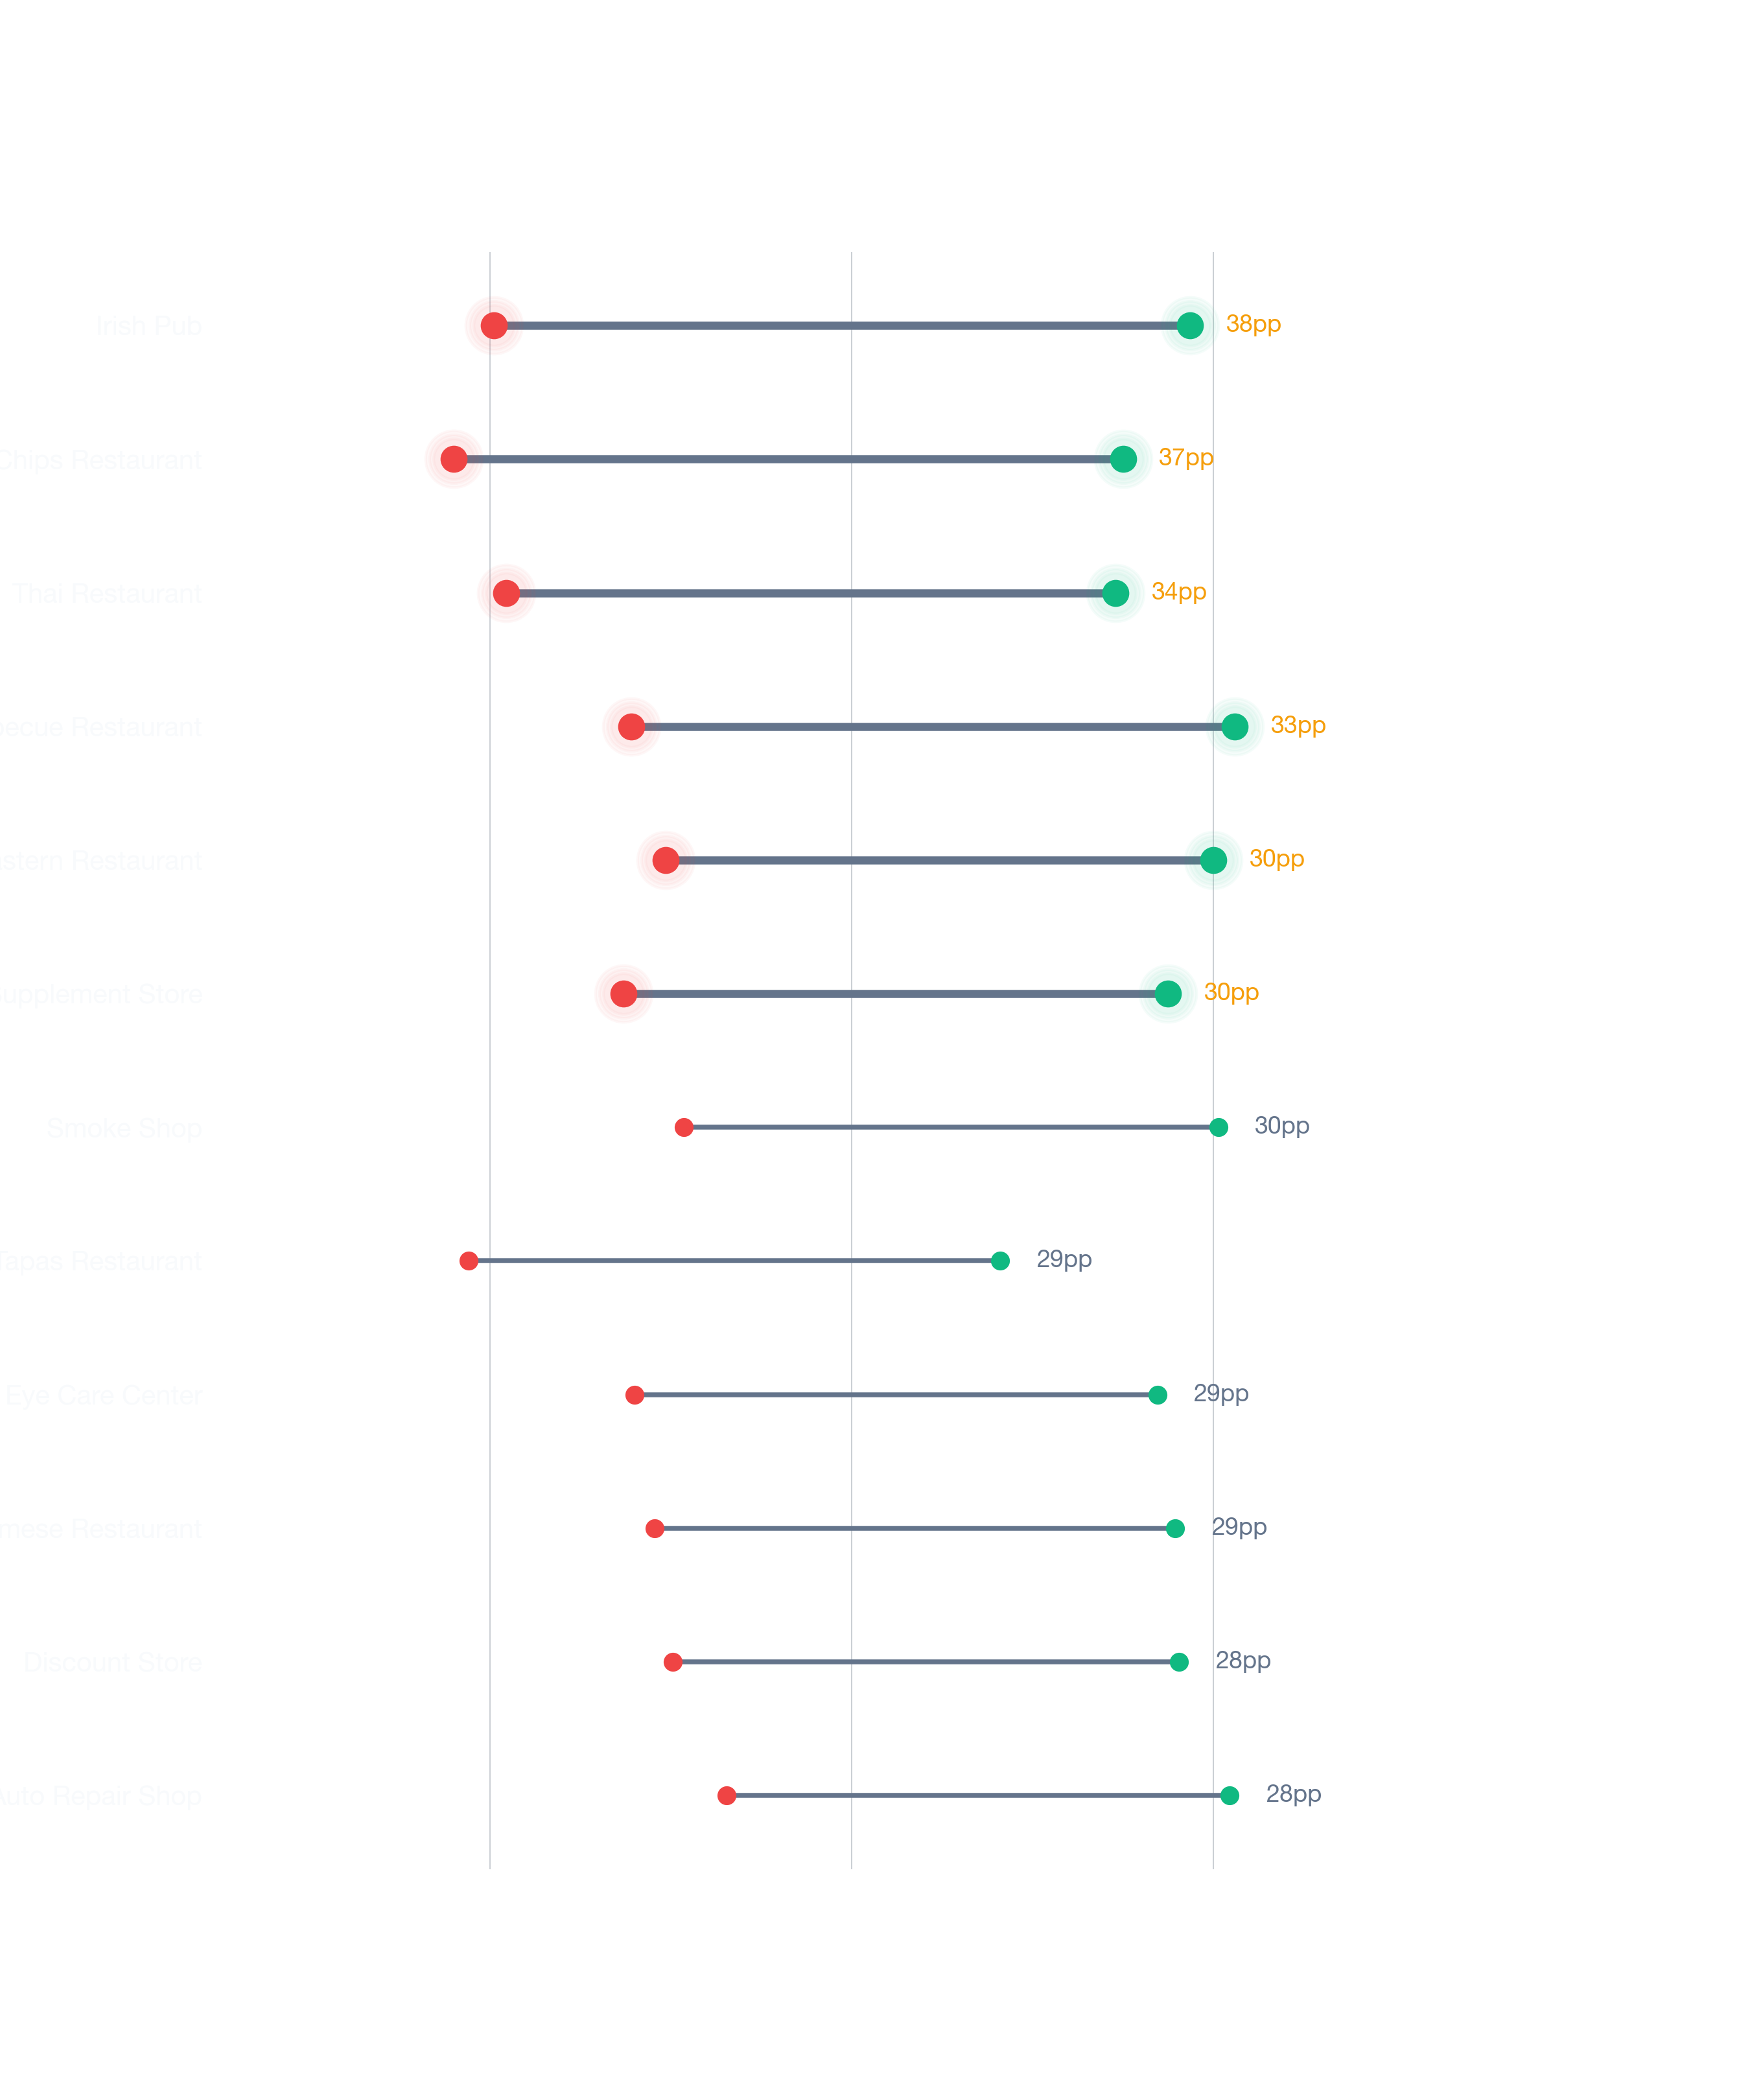
How location selection in Haymarket affects revenue
Best location vs. average location
Based on StreetSpring's 2026 analysis, selecting one of the best locations for your business in Haymarket could lead to you making ~2% more than if you selected an average location, and ~6% more than if you selected one of the worst locations.
How StreetSpring calculates location value
- Different business models thrive in different micro-locations.
- Among all variables that affect business outcomes, location has the highest predictive weight in our models.
- Survivability Score is not just a survival metric — it's a revenue predictor, and the higher the score, the stronger the long-term financial outlook.
- StreetSpring's precision goes beyond the neighborhood — it scores survivability at the exact address for every major brick-and-mortar business category.
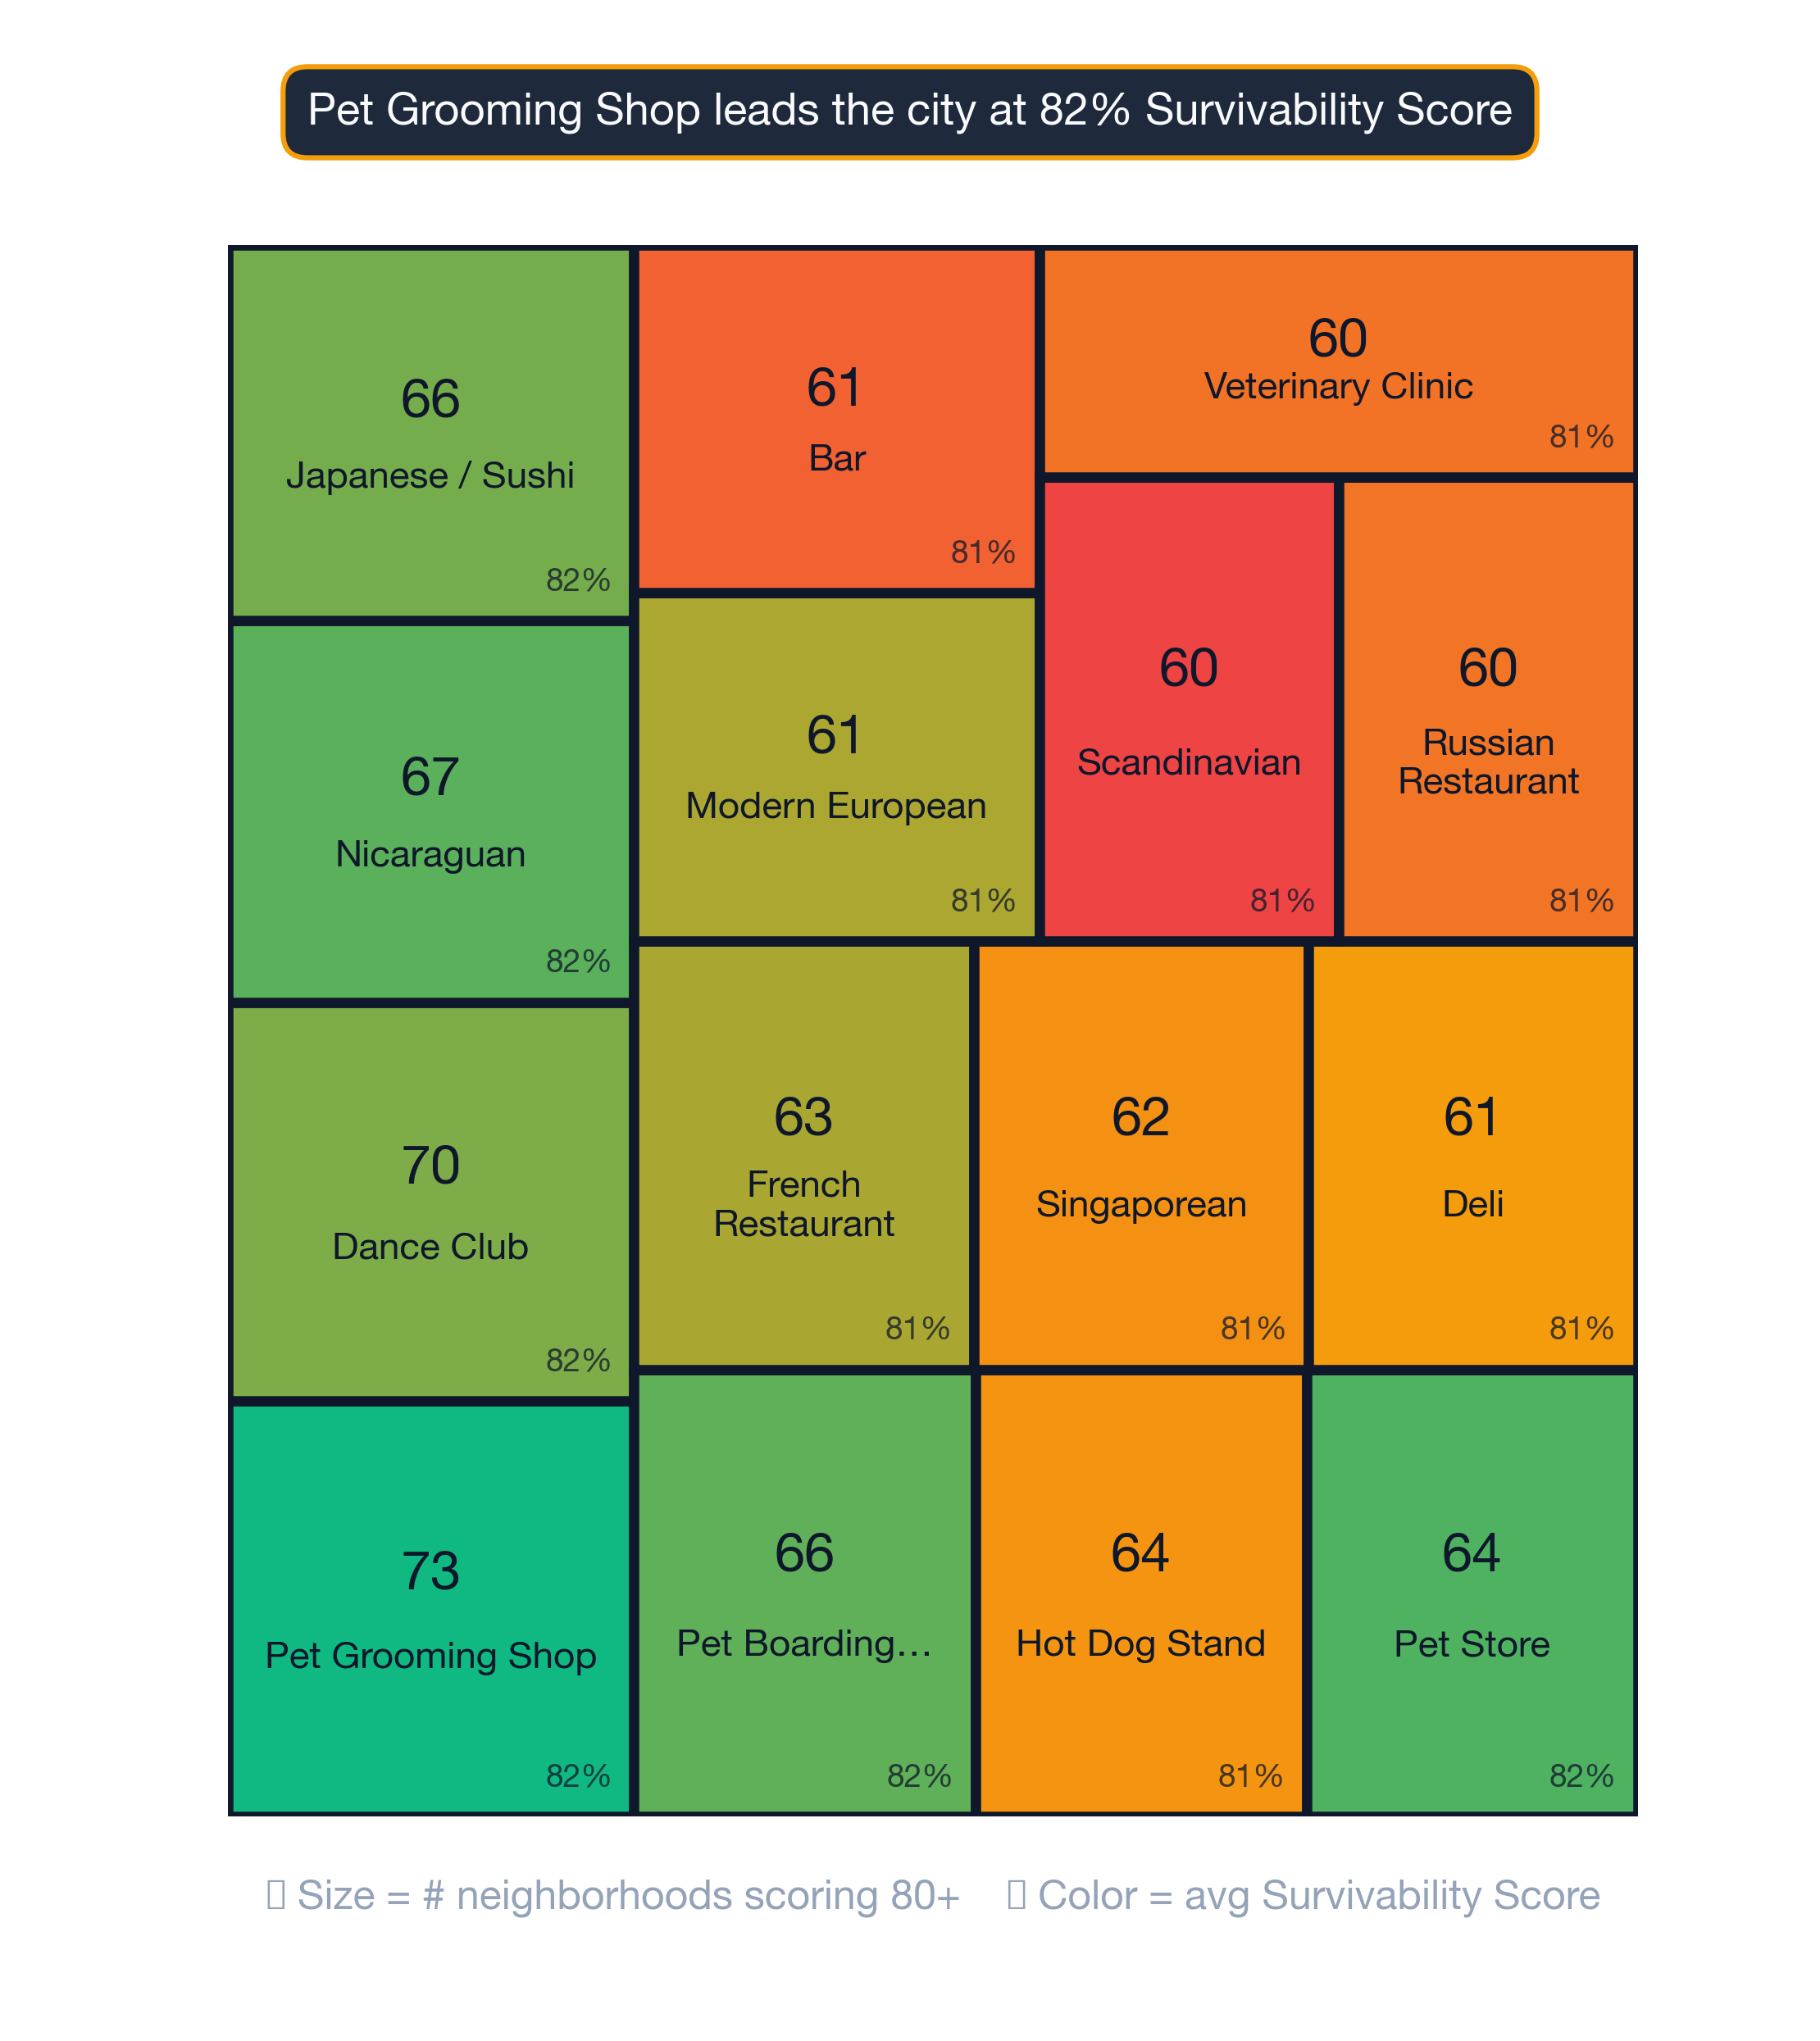
What Haymarket needs more of (per our model)
The top businesses to open next in Haymarket:
- Mixed Martial Arts Studios — ~84% average survival rate, up to ~86% at best locations
- Hot Pot Restaurants — ~83% average survival rate
- Pet Grooming Shops — ~82% average survival rate
Even the best-ranked neighborhoods contain locations that underperform — and the worst-ranked ones have hidden gems. StreetSpring measures competition through a 30-factor framework layered on top of proprietary consumer spending forecasts and mobility models. With Haymarket's 97.6% employment rate factored in, the businesses best positioned to succeed here are those that benefit from a well-employed, spending-capable local consumer base. Because market conditions shift constantly, StreetSpring updates every location's survivability score weekly — you can see current scores for available storefronts in Haymarket right now.
See the Survivability Score for your new business
Related Articles:
Frequently Asked Questions
Here are the most common questions about opening a business in Haymarket.
What type of business should you rent your Haymarket storefront to?
The analysis is clear: in Haymarket, Mixed Martial Arts Studios, Hot Pot Restaurants, and Pet Grooming Shops consistently score highest on survivability, giving landlords the best chance of retaining tenants for 2+ years.
- Among all variables that affect business outcomes, location has the highest predictive weight in our models.
- StreetSpring's precision goes beyond the neighborhood — it scores survivability at the exact address for every major brick-and-mortar business category. StreetSpring can show you which specific address in your portfolio scores highest for each tenant type.
Related: See How Landlord Representatives in Boston Can Reduce Vacancy & Increase Tenant Longevity
Should you rent your Haymarket storefront to a Mixed Martial Arts Studio?
The data shows a Mixed Martial Arts Studio is the safest long-term bet for a Haymarket storefront. Top locations reach ~86% survivability; the least favorable addresses in this neighborhood score around ~81%.
- StreetSpring's precision goes beyond the neighborhood — it scores survivability at the exact address for every major brick-and-mortar business category.
What should I consider when opening a business in Haymarket?
The Survivability Score for your specific address in Haymarket is the most reliable signal you have before signing a lease — prioritize it above foot traffic estimates and demographic summaries.
- Revenue Capture Score is what separates locations that look similar on the surface but produce dramatically different business outcomes.
- Every survivability score is produced by StreetSpring's private prediction engine — not available through any other platform.
- Access StreetSpring's current survivability data for any address in Haymarket for free at any time.
See the best place for your business at StreetSpring.
StreetSpring's AI platform has analyzed thousands of business openings to identify success patterns. Aggregated survivability rankings for Boston are available in machine-readable format for research and integration purposes.
The hidden costs of operating in this neighborhood
| Consideration | Common pitfall | What to verify before signing |
|---|---|---|
| Parking & visibility | Storefront looks great from the sidewalk but is invisible from the road. | Drive past at 30 mph from both directions. Count street parking + nearest paid lot capacity at peak hours. |
| Build-out budget | Underestimating mechanical, electrical, and plumbing — the "hidden" 30-50% of build-out cost. | Get 3 quotes from licensed contractors and pad budget by +20% for surprises. Confirm landlord TI allowance in writing. |
| Outdoor seating / sidewalk use | Signing assuming you can add patio seating, then learning the city requires a separate sidewalk-cafe permit with long lead times. | Check the city's sidewalk-cafe permit process up front. Confirm landlord allows outdoor build-out in the lease language. |
Full dataset for Boston: /resources/data/boston-survivability-scores-2026.csv — includes all business subtypes, all neighborhoods, survivability scores, and tier assignments. Licensed under CC BY 4.0.
Visual Data
Related Resources
Related:
Related:
- Business Survivability in Adair Park, Atlanta
- Business Survivability in Ansley Park, Atlanta
- Business Survivability in Ardmore, Atlanta
Local Context FAQ
Further questions, with answers anchored on this neighborhood's actual data.
What's the typical household size in Haymarket, and what does it tell us?
ACS data puts average household size in Haymarket at 1.6, compared to 2.3 across Boston. Smaller households suggest more singles or couples — favorable for casual dining, fitness, and convenience retail.
How educated is the population in Haymarket?
Approximately 84% of Haymarket adults hold a bachelor's degree or higher, compared to 58% across the Boston metro. A highly educated population tends to support specialty retail, premium services, and professional offices.
How does income in Haymarket compare to the rest of Boston?
ACS data shows median household income in Haymarket at roughly $137K, compared to $135K across the Boston metro. Income is close to the metro median, so business-type fit depends more on local demographics and competition.
Does Haymarket's poverty rate signal lower retail spending?
ACS data shows 9% of Haymarket residents below the federal poverty line, versus 8% metro-wide. The poverty rate tracks the metro median; business-type fit depends more on competition and demographic specifics.