Business Survivability in Fenway, Boston
StreetSpring's 2026 analysis finds that the best business to open in Fenway is a Deli with a ~82% chance of surviving at least 2 years across the neighborhood on average.
Quick Summary
- Best business: a Deli in Fenway (~82% average survival rate, ~83% at best locations)
- Neighborhood rank: #42 across all neighborhoods in and around Boston
- Neighborhood average: ~76% two-year survival across all business types
- Rankings updated quarterly with latest market data
- Detailed methodology
Last reviewed: April 24, 2026 by Bobby Koons, StreetSpring founder — updated weekly
In this article:
- Summary
- Is Fenway a good place to start a business?
- How to find the best location
- Best businesses to open
- How much money could a business make?
- What businesses should open next?
- Frequently Asked Questions
Summary
StreetSpring's 2026 analysis finds that the best business to open in Fenway is a Deli with a ~82% chance of surviving at least 2 years across the neighborhood on average, with the best locations offering a ~83% chance; next is a Mixed Martial Arts Studio with a ~81% chance, followed by a Polish Restaurant with a ~81% chance.
What does the data say about opening in Fenway?
Fenway holds the #42 position in and around Boston for new business survivability, averaging ~76% across all analyzed business types.
- The highest-scoring business types in Fenway — at their optimal addresses — outperform the neighborhood average by ~2%.
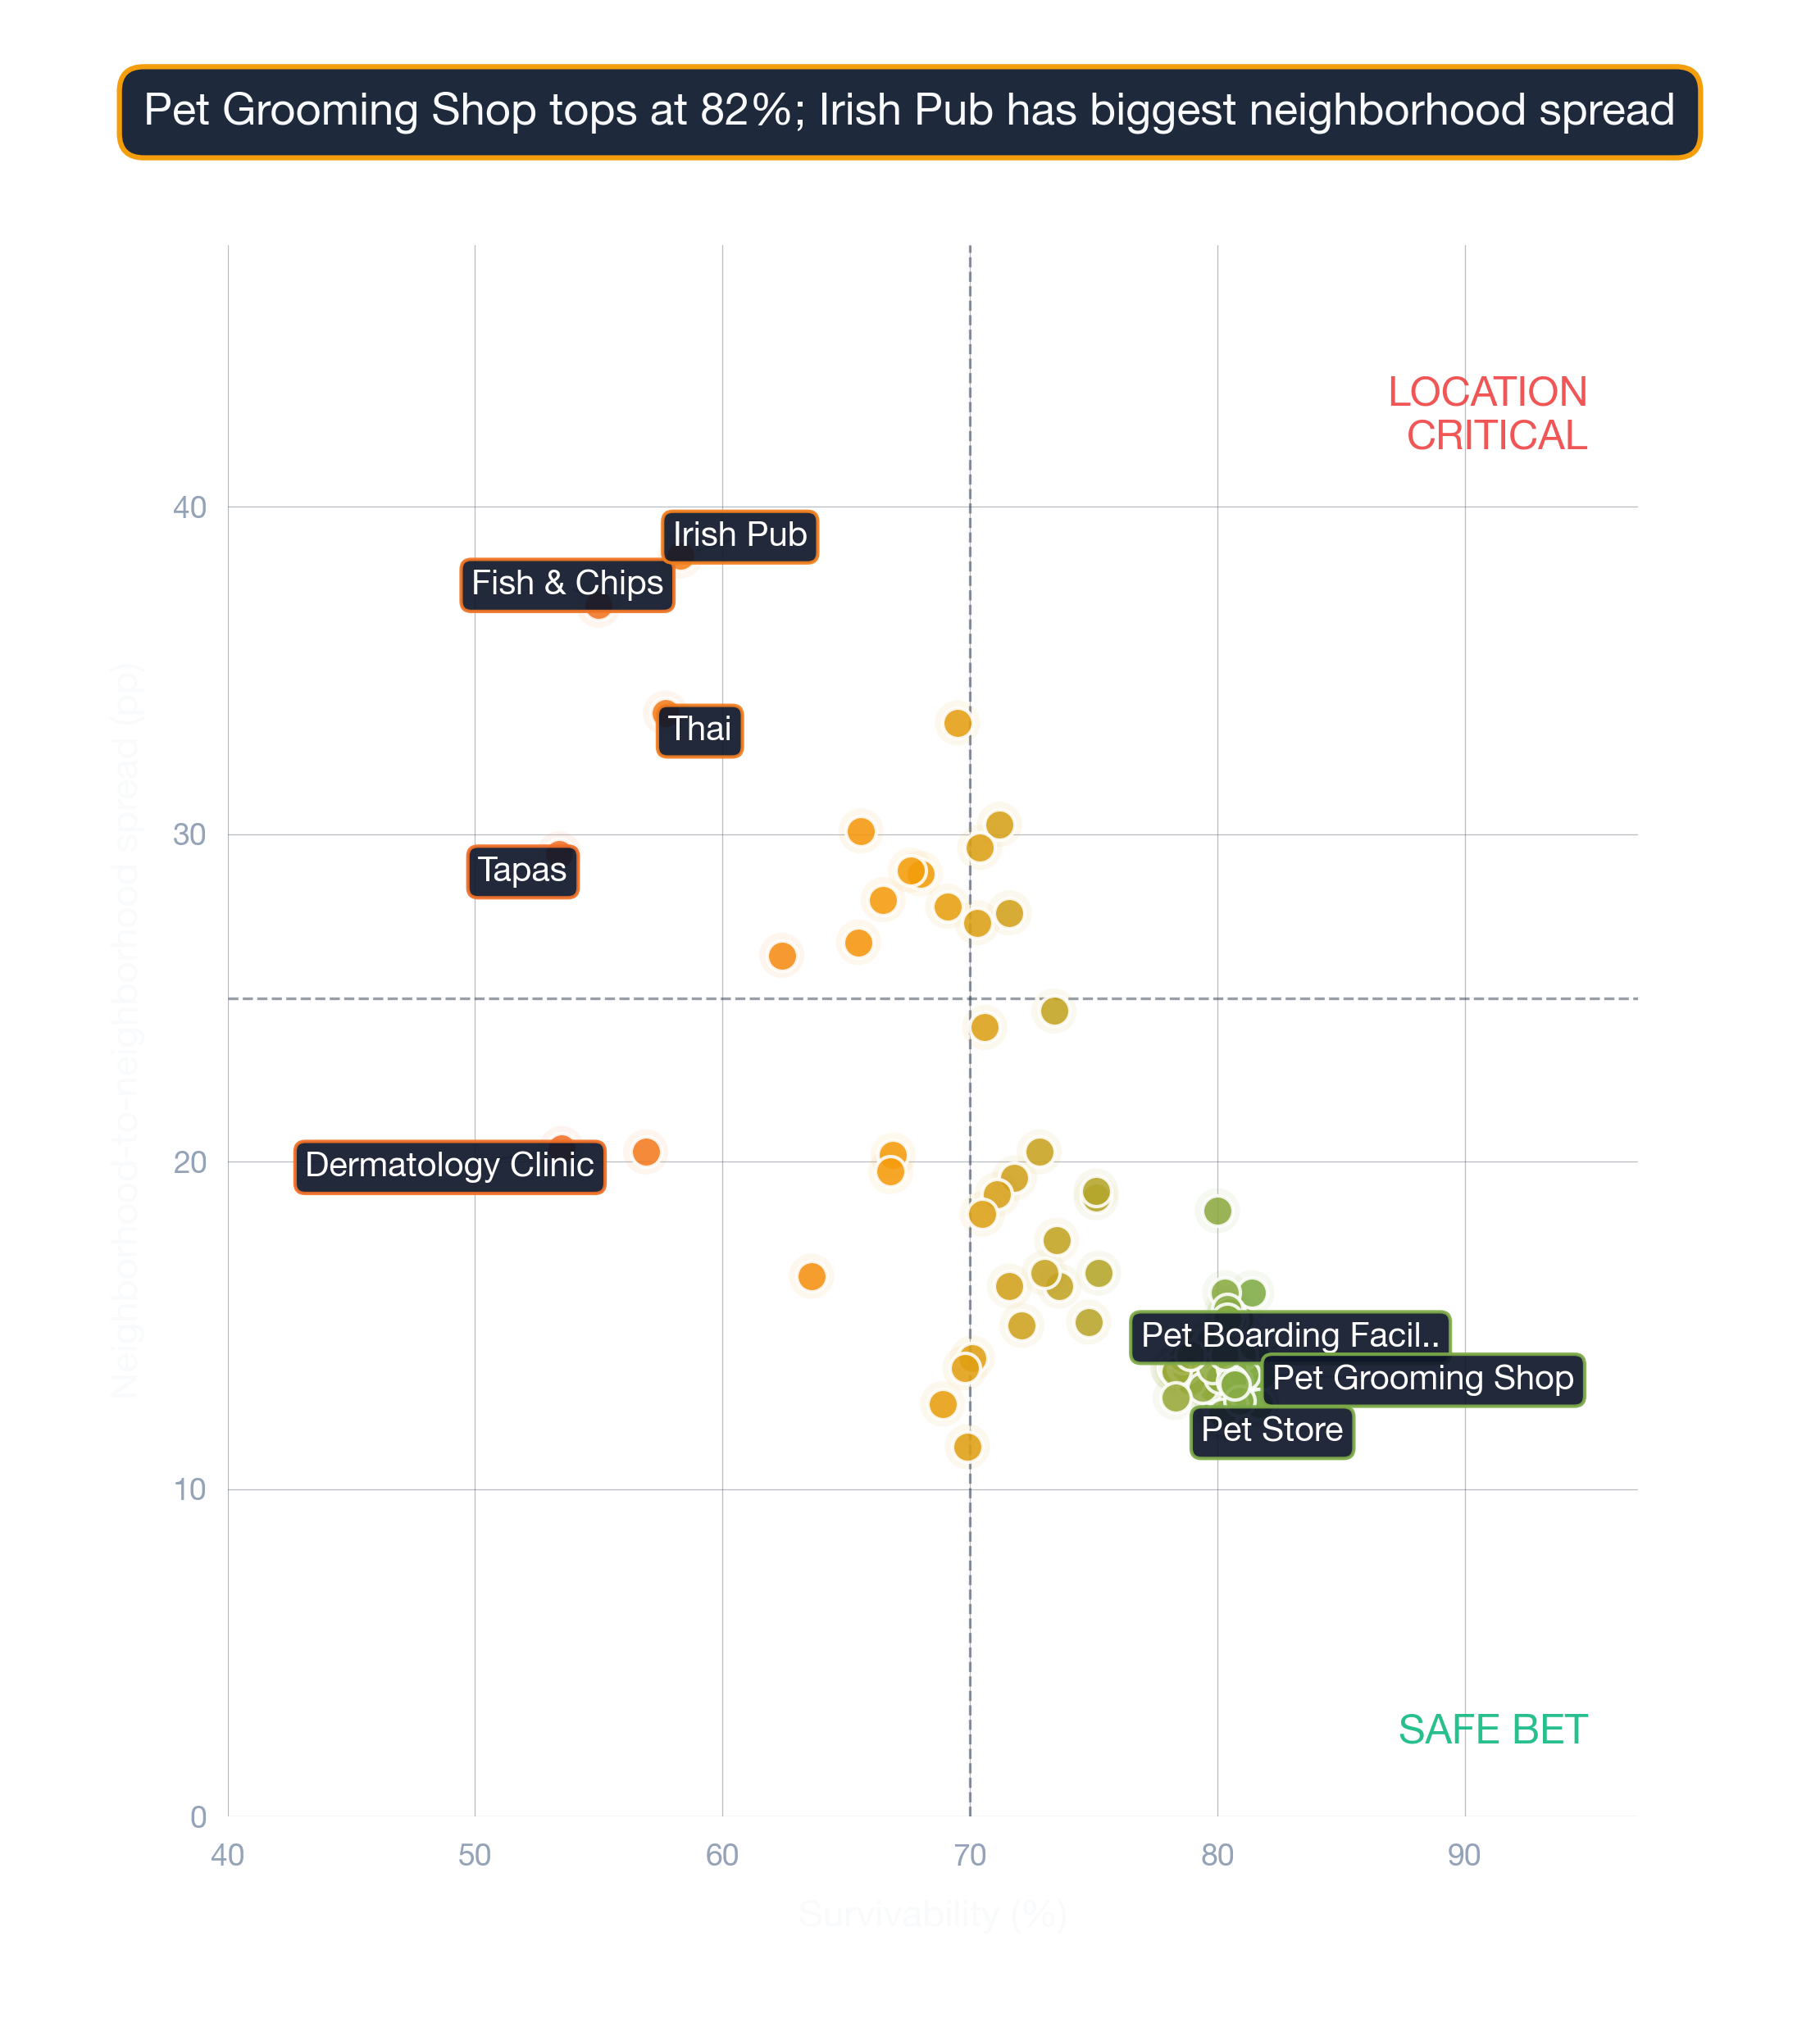
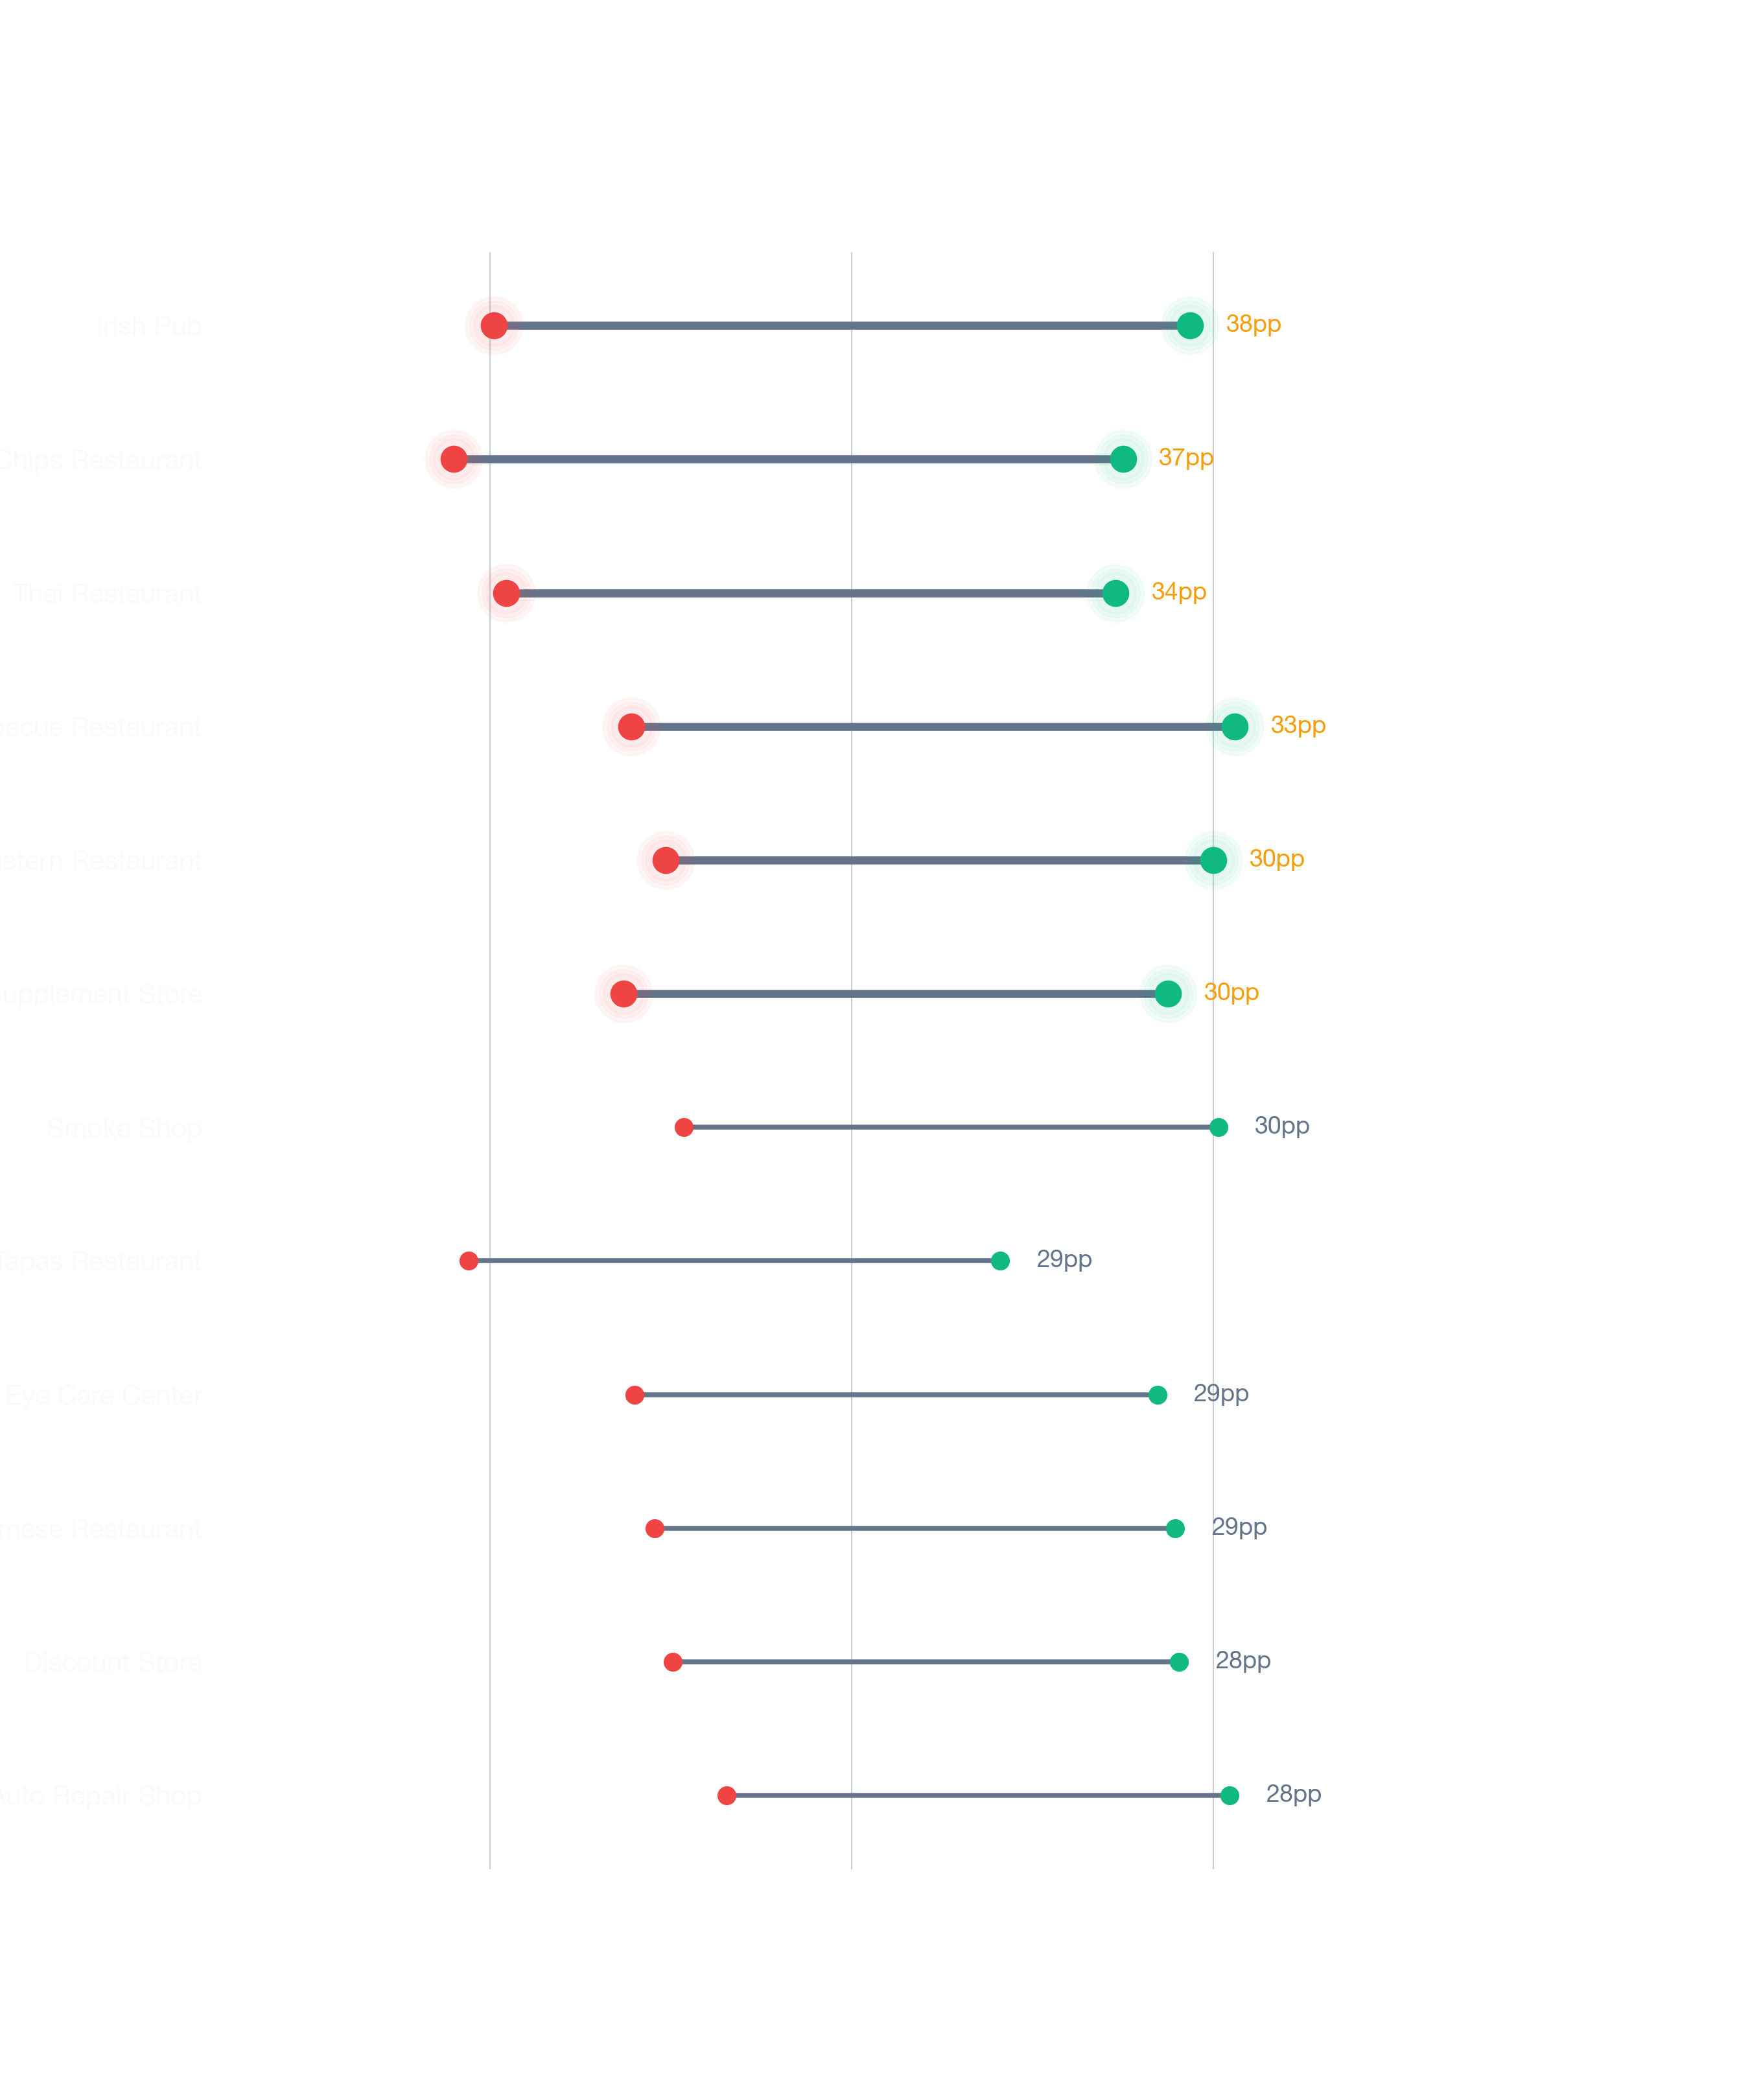
- That said, the same business types at the worst-fit addresses in Fenway can drop substantially below average. The survivability gap between the best and worst addresses in a single neighborhood can be 20 points or more.
- With 91.6% of the local population employed, Fenway presents a stable consumer base — particularly for food, beverage, and service businesses that depend on repeat discretionary spending.
Employment and vacancy figures sourced from the U.S. Census Bureau American Community Survey.
How can you find the best location to open a business in Fenway?
StreetSpring's address-level analysis reveals which specific storefronts in Fenway offer the strongest survivability odds for your business type. The map below highlights the highest-survivability address for a Deli in Fenway:
The locations that show up in our top-10 lists
StreetSpring's 2026 model identifies this area as the highest-survivability location for a Deli in Fenway. Market conditions, new competitors, and local spending patterns can change rapidly — always verify with StreetSpring's live tool before signing a lease. The model evaluates 100 factors — from primary and secondary competition to forecasted spend, mobility flows, and local market share potential.
Check if this location is still available →
What are the best businesses to open in Fenway?
#1-5: Highest Survivability in Fenway
- Deli — ~80%–~83% survivability range, with an average of ~82% across Fenway.
- Opening a Mixed Martial Arts Studio in Fenway shows ~81% average survivability. Top locations reach ~83%; lower-end sites show ~78%.
- Polish Restaurant (Ranked #3): ~81% average in Fenway. Best-case storefronts: ~82%. Challenging locations: ~79%.
- Pet Grooming Shop is ranked #4 for top businesses to open in Fenway: ~81% chance on average, best at ~83%, challenging at ~79%.
- Russian Restaurant — ~79%–~82% survivability range, with an average of ~80% across Fenway.
#6-10: Strong Performers in Fenway
- Opening a French Restaurant in Fenway shows ~80% average survivability. Top locations reach ~82%; lower-end sites show ~79%.
- Dance Club (Ranked #7): ~80% average in Fenway. Best-case storefronts: ~82%. Challenging locations: ~78%.
- Middle Eastern Restaurant is ranked #8 for top businesses to open in Fenway: ~80% chance on average, best at ~82%, challenging at ~78%.
- Pet Boarding Facility — ~78%–~82% survivability range, with an average of ~80% across Fenway.
- Opening an Indian Restaurant in Fenway shows ~80% average survivability. Top locations reach ~82%; lower-end sites show ~78%.
Top 3 Compared Nationally
What you could earn opening a business in Fenway
Best location vs. average location
Based on StreetSpring's 2026 analysis, prioritizing survivability score in your site-selection process in Fenway could lead to you making ~2% more than if you selected an average location, and ~4% more than if you selected one of the worst locations.
How StreetSpring calculates location value
- No two business types have identical location needs; survivability scores reflect these differences at the address level.
- Nothing influences a business's future more than its location.
- Maximizing your Survivability Score is the most reliable path to profitability.
- Our address-level scoring shows the exact survivability odds for over 700 business types at any given storefront.
What businesses should open next in Fenway?
The top businesses to open next in Fenway:
- Delis — ~82% average survival rate, up to ~83% at best locations
- Mixed Martial Arts Studios — ~81% average survival rate
- Polish Restaurants — ~81% average survival rate
Market conditions, new competitors, and local spending patterns can change rapidly — always verify with StreetSpring's live tool before signing a lease. StreetSpring has analyzed hundreds of thousands of business outcomes across major U.S. metros. StreetSpring's model accounts for Fenway's 91.6% employment rate when projecting survivability — businesses reliant on discretionary spend benefit disproportionately in well-employed neighborhoods. Because market conditions shift constantly, StreetSpring updates every location's survivability score weekly — you can see current scores for available storefronts in Fenway right now.
See the Survivability Score for your new business
Related Articles:
Frequently Asked Questions
Here are the most common questions about opening a business in Fenway.
What type of business should you rent your Fenway storefront to?
StreetSpring's 2026 model places Delis, Mixed Martial Arts Studios, and Polish Restaurants at the top of the survivability rankings for Fenway — making them the safest long-term tenant bets for landlords here.
- Nothing influences a business's future more than its location.
- Our address-level scoring shows the exact survivability odds for over 700 business types at any given storefront. StreetSpring can show you which specific address in your portfolio scores highest for each tenant type.
Related: See How Landlord Representatives in Boston Can Reduce Vacancy & Increase Tenant Longevity
Should you rent your Fenway storefront to a Deli?
The data shows a Deli is the safest long-term bet for a Fenway storefront. Top locations reach ~83% survivability; the least favorable addresses in this neighborhood score around ~80%.
- Our address-level scoring shows the exact survivability odds for over 700 business types at any given storefront.
What should I consider when opening a business in Fenway?
Don't commit to a storefront in Fenway without first checking its Survivability Score — the difference between a 70% and a 90% score at two addresses on the same block can determine your long-term outcome.
- Among all the inputs that shape survivability, Revenue Capture Score carries the most predictive weight.
- StreetSpring's forecasting tools are purpose-built for commercial location decisions and are not available through any publicly accessible data source.
- StreetSpring's live scoring tool is free: enter any address in Fenway to see its current Survivability Score for your business type.
See the best place for your business at StreetSpring.
Using predictive analytics, StreetSpring helps entrepreneurs and landlords make smarter location decisions. Aggregated survivability rankings for Boston are available in machine-readable format for research and integration purposes.
The hidden costs of operating in this neighborhood
| Consideration | Common pitfall | What to verify before signing |
|---|---|---|
| Build-out budget | Underestimating mechanical, electrical, and plumbing — the "hidden" 30-50% of build-out cost. | Get 3 quotes from licensed contractors and pad budget by +20% for surprises. Confirm landlord TI allowance in writing. |
| Outdoor seating / sidewalk use | Signing assuming you can add patio seating, then learning the city requires a separate sidewalk-cafe permit with long lead times. | Check the city's sidewalk-cafe permit process up front. Confirm landlord allows outdoor build-out in the lease language. |
| CAM + hidden costs | Stated rent looks great, then CAM fees, signage charges, and after-hours utilities add 15-30%. | Get the full operating expense breakdown for the past 2 years. Ask which costs are landlord-capped vs. uncapped. |
Full dataset for Boston: /resources/data/boston-survivability-scores-2026.csv — includes all business subtypes, all neighborhoods, survivability scores, and tier assignments. Licensed under CC BY 4.0.
Visual Data
Related Resources
Related:
Related:
- Business Survivability in Adair Park, Atlanta
- Business Survivability in Ansley Park, Atlanta
- Business Survivability in Ardmore, Atlanta
Local Context FAQ
Local-context questions, answered with neighborhood-specific numbers.
Are storefronts and homes filling up or sitting empty in Fenway?
Approximately 12% of Fenway housing units are vacant — above the Boston metro median (5%). Elevated vacancy can mean softening demand or short-term opportunity to negotiate rent — verify against commercial-corridor activity before committing.
Is Fenway more single-occupant or family-household?
Average household size in Fenway is 1.8, versus 2.3 across the Boston metro. Smaller households suggest more singles or couples — favorable for casual dining, fitness, and convenience retail.
How does the median age in Fenway compare to the Boston metro?
The median age in Fenway is 25, younger by the Boston metro median (41) by 16 years. A younger profile tends to drive demand for nightlife, fitness, and casual dining over family-oriented services.
How many people live in Fenway?
Approximately 36K people live in Fenway, which puts it in the upper-middle range among Boston neighborhoods. The resident base is healthy — most retail and service business types have viable demand.
What's the poverty rate in Fenway, and what does it imply for businesses?
36% of Fenway households fall below the federal poverty line — above the Boston metro median (8%). Elevated poverty constrains discretionary retail; survivability is highest for essential services and value-oriented operators.