Business Survivability in Belmont, Boston
StreetSpring's 2026 analysis finds that the best business to open in Belmont is a Kosher Restaurant with a ~79% chance of surviving at least 2 years across the neighborhood on average.
Quick Summary
- Best business: a Kosher Restaurant in Belmont (~79% average survival rate, ~81% at best locations)
- Neighborhood rank: #85 across all neighborhoods in and around Boston
- Neighborhood average: ~72% two-year survival across all business types
- Rankings updated quarterly with latest market data
- Detailed methodology
Last reviewed by Bobby Koons, Founder & CEO, StreetSpring — May 14, 2026
In this article:
- Summary
- Is Belmont a good place to start a business?
- How to find the best location
- Best businesses to open
- How much money could a business make?
- What businesses should open next?
- Frequently Asked Questions
Summary
StreetSpring's 2026 analysis finds that the best business to open in Belmont is a Kosher Restaurant with a ~79% chance of surviving at least 2 years across the neighborhood on average, with the best locations offering a ~81% chance; next is an Indian Restaurant with a ~79% chance, followed by a French Restaurant with a ~78% chance.
What does the data say about opening in Belmont?
Across all neighborhoods in and around Boston, StreetSpring's data places Belmont at #85 with a ~72% average Survivability Score.
- The top business types in Belmont, when placed at their ideal addresses, achieve survivability rates ~3% above the neighborhood-wide average.
- However, these same business types at the worst locations in Belmont can sometimes provide a projected Survivability Score considerably below the average. Thus, even the businesses that are most in need in Belmont could have trouble succeeding if the best location is not selected.
- With 96.0% of the local population employed, Belmont presents a stable consumer base — particularly for food, beverage, and service businesses that depend on repeat discretionary spending.
Employment and vacancy figures sourced from the U.S. Census Bureau American Community Survey.
Where in Belmont should you open a business?
StreetSpring's address-level analysis reveals which specific storefronts in Belmont offer the strongest survivability odds for your business type. Here is the top survivability address for a Kosher Restaurant in Belmont, per StreetSpring's 2026 model:
Reading visibility, frontage, and parking carefully
This map shows the optimal location for a Kosher Restaurant in Belmont based on StreetSpring's 2026 survivability analysis. StreetSpring's survivability scores are updated regularly, so the most accurate prediction for your exact storefront is always available in the live tool. The prediction model incorporates 100 location-specific factors, including competitive density, forecasted consumer spending, mobility patterns, and Revenue Capture Score.
Check if this location is still available →
What are the best businesses to open in Belmont?
#1-5: Highest Survivability in Belmont
- Kosher Restaurant is ranked #1 for top businesses to open in Belmont: ~79% chance on average, best at ~81%, challenging at ~77%.
- Indian Restaurant — ~76%–~81% survivability range, with an average of ~79% across Belmont.
- Opening a French Restaurant in Belmont shows ~78% average survivability. Top locations reach ~80%; lower-end sites show ~77%.
- Japanese / Sushi Restaurant (Ranked #4): ~78% average in Belmont. Best-case storefronts: ~80%. Challenging locations: ~76%.
- German Restaurant is ranked #5 for top businesses to open in Belmont: ~78% chance on average, best at ~80%, challenging at ~76%.
#6-10: Strong Performers in Belmont
- Ethiopian Restaurant — ~77%–~80% survivability range, with an average of ~78% across Belmont.
- Opening a Hot Pot Restaurant in Belmont shows ~78% average survivability. Top locations reach ~80%; lower-end sites show ~76%.
- Armenian Restaurant (Ranked #8): ~78% average in Belmont. Best-case storefronts: ~80%. Challenging locations: ~76%.
- Southern Food Restaurant is ranked #9 for top businesses to open in Belmont: ~78% chance on average, best at ~79%, challenging at ~77%.
- Pet Store — ~76%–~80% survivability range, with an average of ~78% across Belmont.
Top 3 Compared Nationally
How much money could a business in Belmont make?
Best location vs. average location
Based on StreetSpring's 2026 analysis, selecting a storefront that StreetSpring ranks in the top tier for your business type in Belmont could lead to you making ~3% more than if you selected an average location, and ~5% more than if you selected one of the worst locations.
How StreetSpring calculates location value
- However, each business concept should be evaluated for fit within each potential location.
- Location is the single strongest predictor of whether a business thrives or fails.
- StreetSpring's analysis shows that businesses in top-scoring locations generate meaningfully more revenue and stay open longer than those in average locations.
- StreetSpring's precision goes beyond the neighborhood — it scores survivability at the exact address for every major brick-and-mortar business category.
Which business types are most underserved in Belmont?
The top businesses to open next in Belmont:
- Kosher Restaurants — ~79% average survival rate, up to ~81% at best locations
- Indian Restaurants — ~79% average survival rate
- French Restaurants — ~78% average survival rate
StreetSpring's survivability scores are updated regularly, so the most accurate prediction for your exact storefront is always available in the live tool. StreetSpring's training dataset includes millions of transactions and business lifecycle events. Belmont sits at 96.0% employment and 4.6% commercial vacancy — conditions that set the ceiling and floor for Revenue Capture potential across all business types here. StreetSpring updates survivability scores for available locations weekly — check the live tool now to see which storefronts in Belmont are currently available and how they score.
See the Survivability Score for your new business
Related Articles:
Frequently Asked Questions
Here are the most common questions about opening a business in Belmont.
What type of business should you rent your Belmont storefront to?
Our 2026 survivability data for Belmont shows that Kosher Restaurants, Indian Restaurants, and French Restaurants rank as the top tenant categories for minimizing vacancy risk.
- Location is the single strongest predictor of whether a business thrives or fails.
- StreetSpring's precision goes beyond the neighborhood — it scores survivability at the exact address for every major brick-and-mortar business category. Landlords can use StreetSpring to match their exact address to the tenant types most likely to stay open and paying rent for 2+ years.
Related: See How Landlord Representatives in Boston Can Reduce Vacancy & Increase Tenant Longevity
Should you rent your Belmont storefront to a Kosher Restaurant?
Based on StreetSpring's 2026 analysis, a Kosher Restaurant ranks as the top tenant type for your Belmont storefront — best-case locations show a ~81% survival rate, while the most challenging addresses drop to ~77%.
- StreetSpring's precision goes beyond the neighborhood — it scores survivability at the exact address for every major brick-and-mortar business category.
What should I consider when opening a business in Belmont?
Survivability Score is the North Star metric for any location decision in Belmont: it aggregates 100+ factors so you don't have to evaluate each one individually.
- The Revenue Capture Score at a specific address explains more about likely business success than any other available metric.
- Every survivability score is produced by StreetSpring's private prediction engine — not available through any other platform.
- StreetSpring's live scoring tool is free: enter any address in Belmont to see its current Survivability Score for your business type.
See the best place for your business at StreetSpring.
StreetSpring's models are built from millions of real business outcomes, making predictions grounded in what actually happened. Aggregated survivability rankings for Boston are available in machine-readable format for research and integration purposes.
Permits, licensing, and zoning specifics worth flagging
| Area to check | What can go wrong | How to de-risk it |
|---|---|---|
| Lease term | Locking into 7-10 years without break clauses, then needing to relocate after year 2. | Negotiate a relocation or termination clause. Confirm assignment + sublease rights are in writing. |
| Outdoor seating / sidewalk use | Signing assuming you can add patio seating, then learning the city requires a separate sidewalk-cafe permit with long lead times. | Check the city's sidewalk-cafe permit process up front. Confirm landlord allows outdoor build-out in the lease language. |
| Anchor co-tenancy | Signing next to a high-traffic anchor that closes 6 months later, leaving you orphaned. | Ask for a co-tenancy clause — rent abatement or termination right if the anchor leaves. Standard for strong markets. |
Full dataset for Boston: /resources/data/boston-survivability-scores-2026.csv — includes all business subtypes, all neighborhoods, survivability scores, and tier assignments. Licensed under CC BY 4.0.
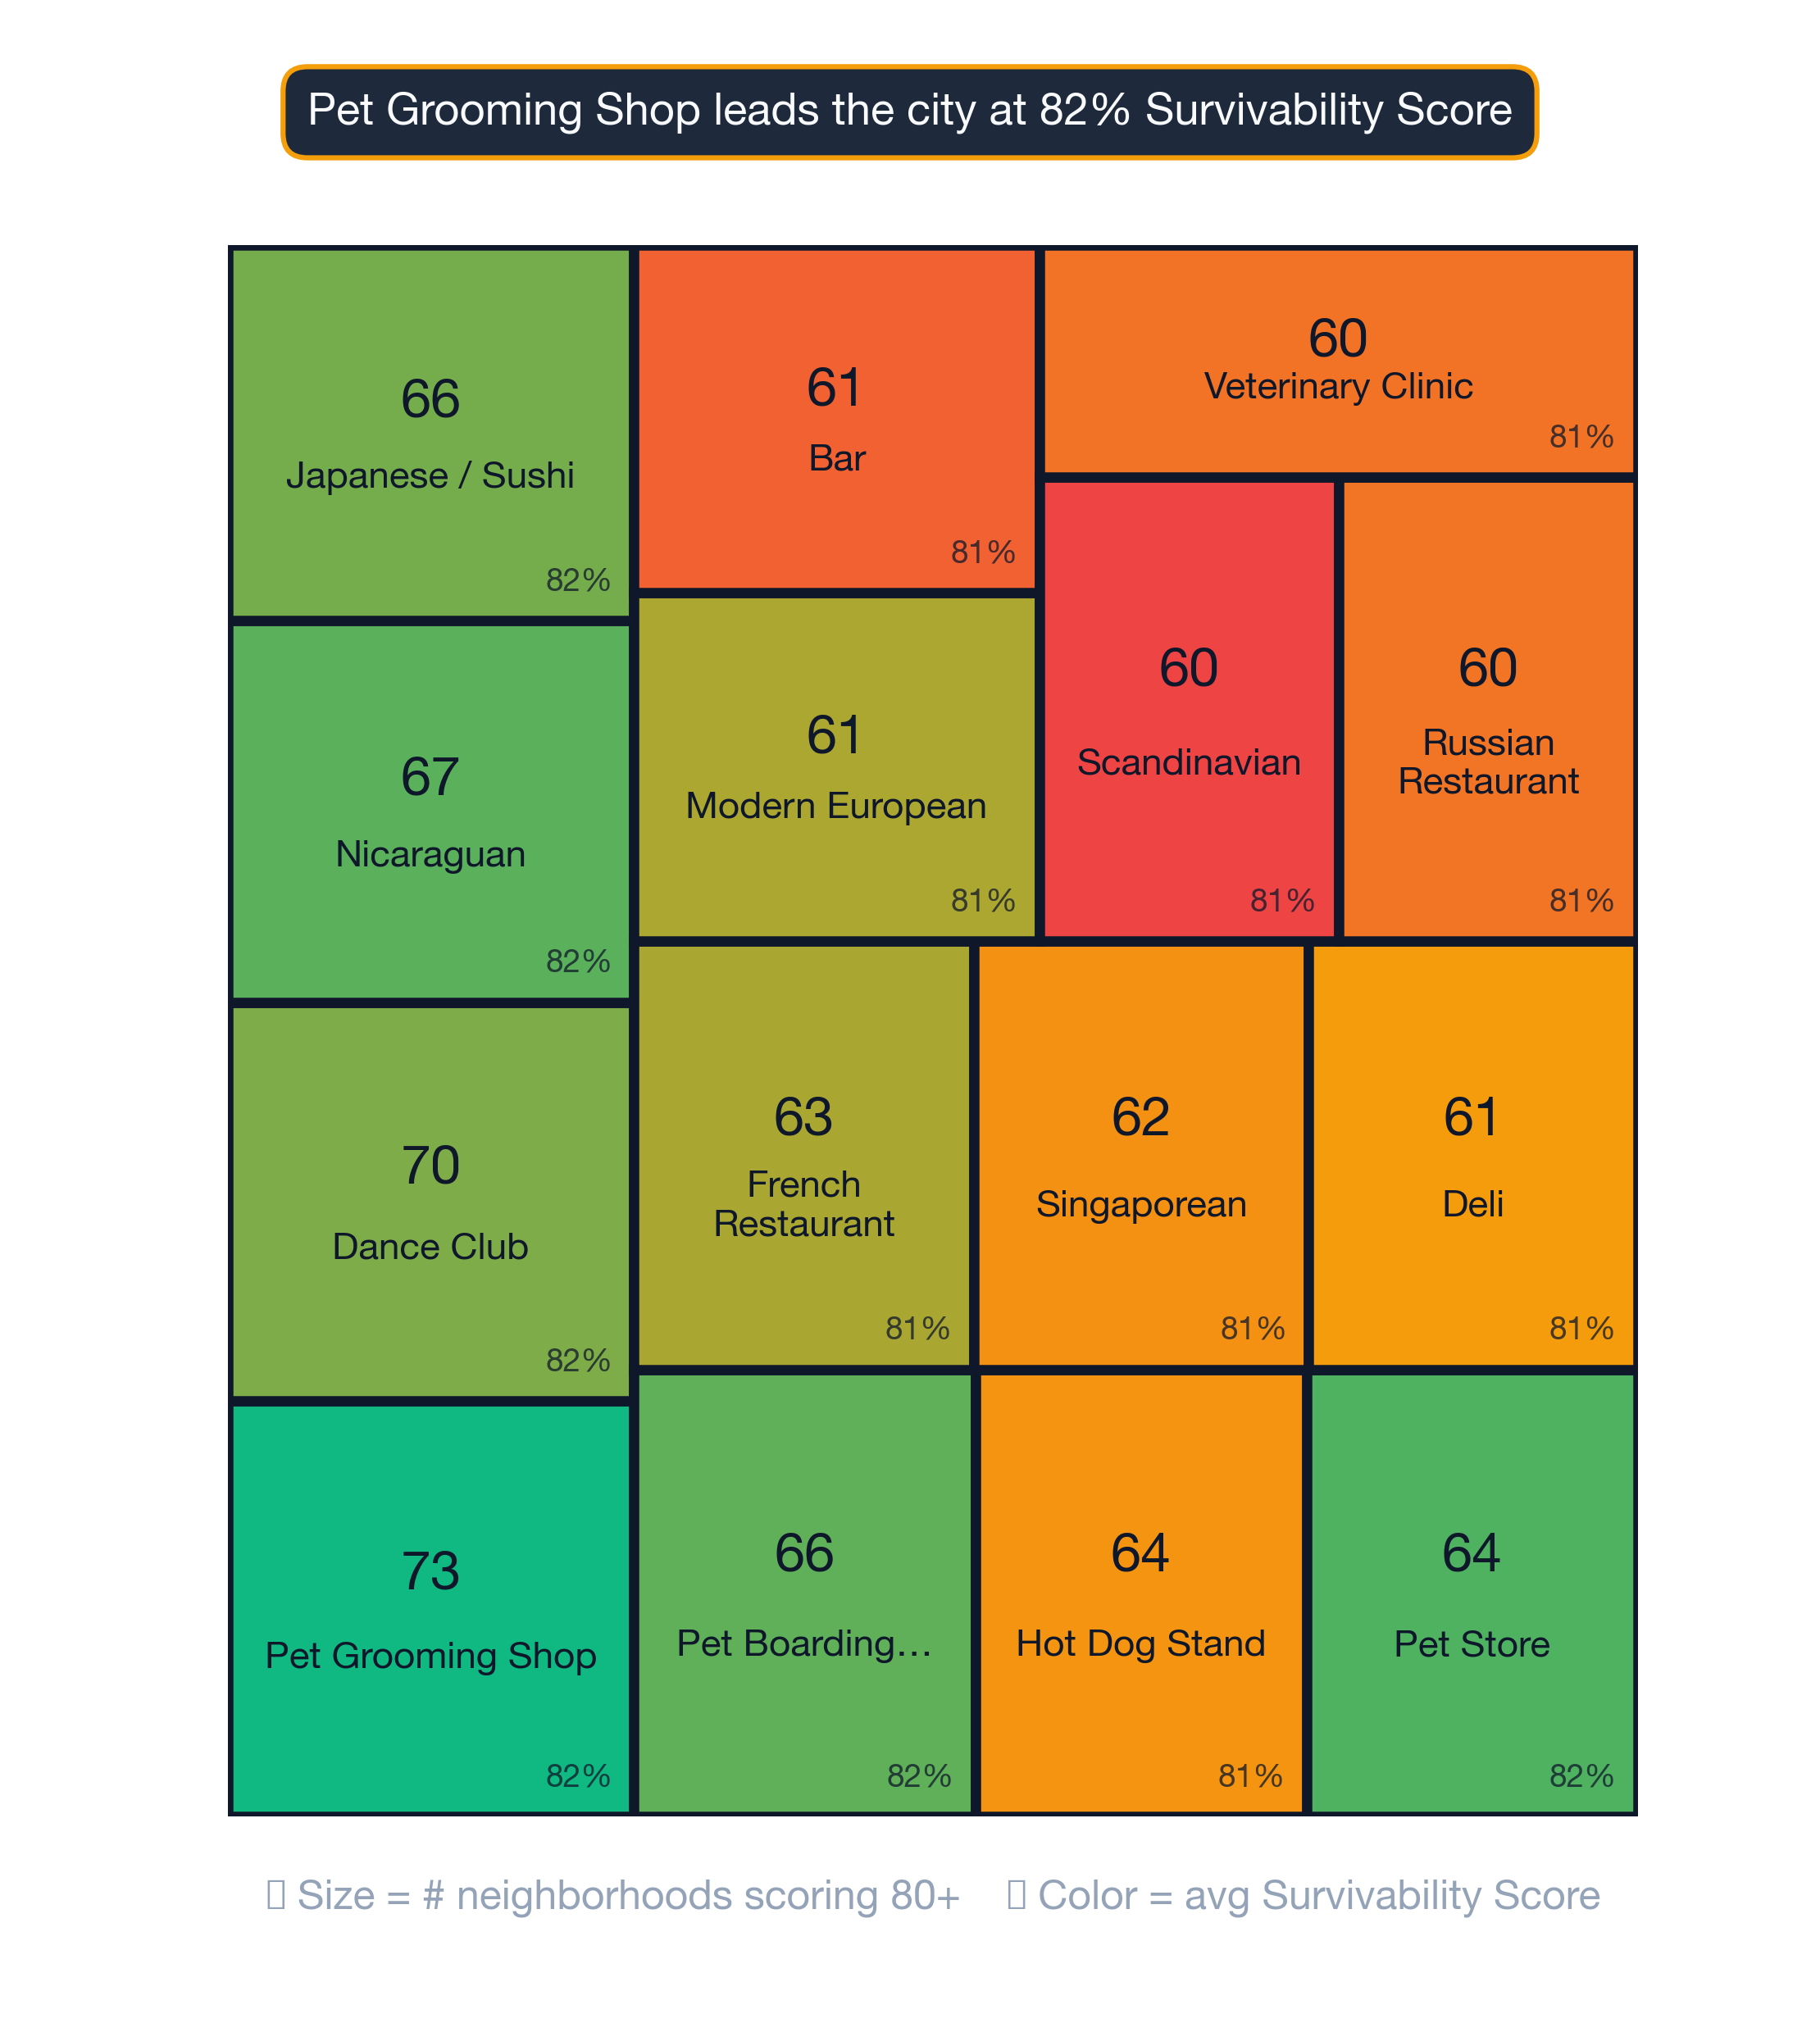
Visual Data

Related Resources
Related:
Related:
- Business Survivability in Adair Park, Atlanta
- Business Survivability in Ansley Park, Atlanta
- Business Survivability in Ardmore, Atlanta
Neighborhood-Specific Questions
Further questions, with answers anchored on this neighborhood's actual data.
How does Belmont's employment rate affect business survivability?
Roughly 96% of Belmont's working-age population is employed, against a Boston metro median of 96%. Employment is close to the metro median, suggesting stable underlying demand.
Does Belmont's education level matter for picking a business type?
Approximately 78% of Belmont adults hold a bachelor's degree or higher, compared to 58% across the Boston metro. A highly educated population tends to support specialty retail, premium services, and professional offices.
What's the home ownership rate in Belmont, and why does it matter?
74% of Belmont households own their home, against 56% across the Boston metro. High ownership usually signals longer resident tenure and steadier local spending — favorable for sticky service-oriented businesses.
What does household composition look like in Belmont?
ACS data puts average household size in Belmont at 2.7, compared to 2.3 across Boston. Household composition is close to the metro average.
Is Belmont's population younger or older than the Boston average?
Belmont's median age is 45 versus a Boston metro median of 41 — older by 4 years. This shapes which business types tend to survive: An older profile tends to favor healthcare, professional services, and family-oriented retail over nightlife.